
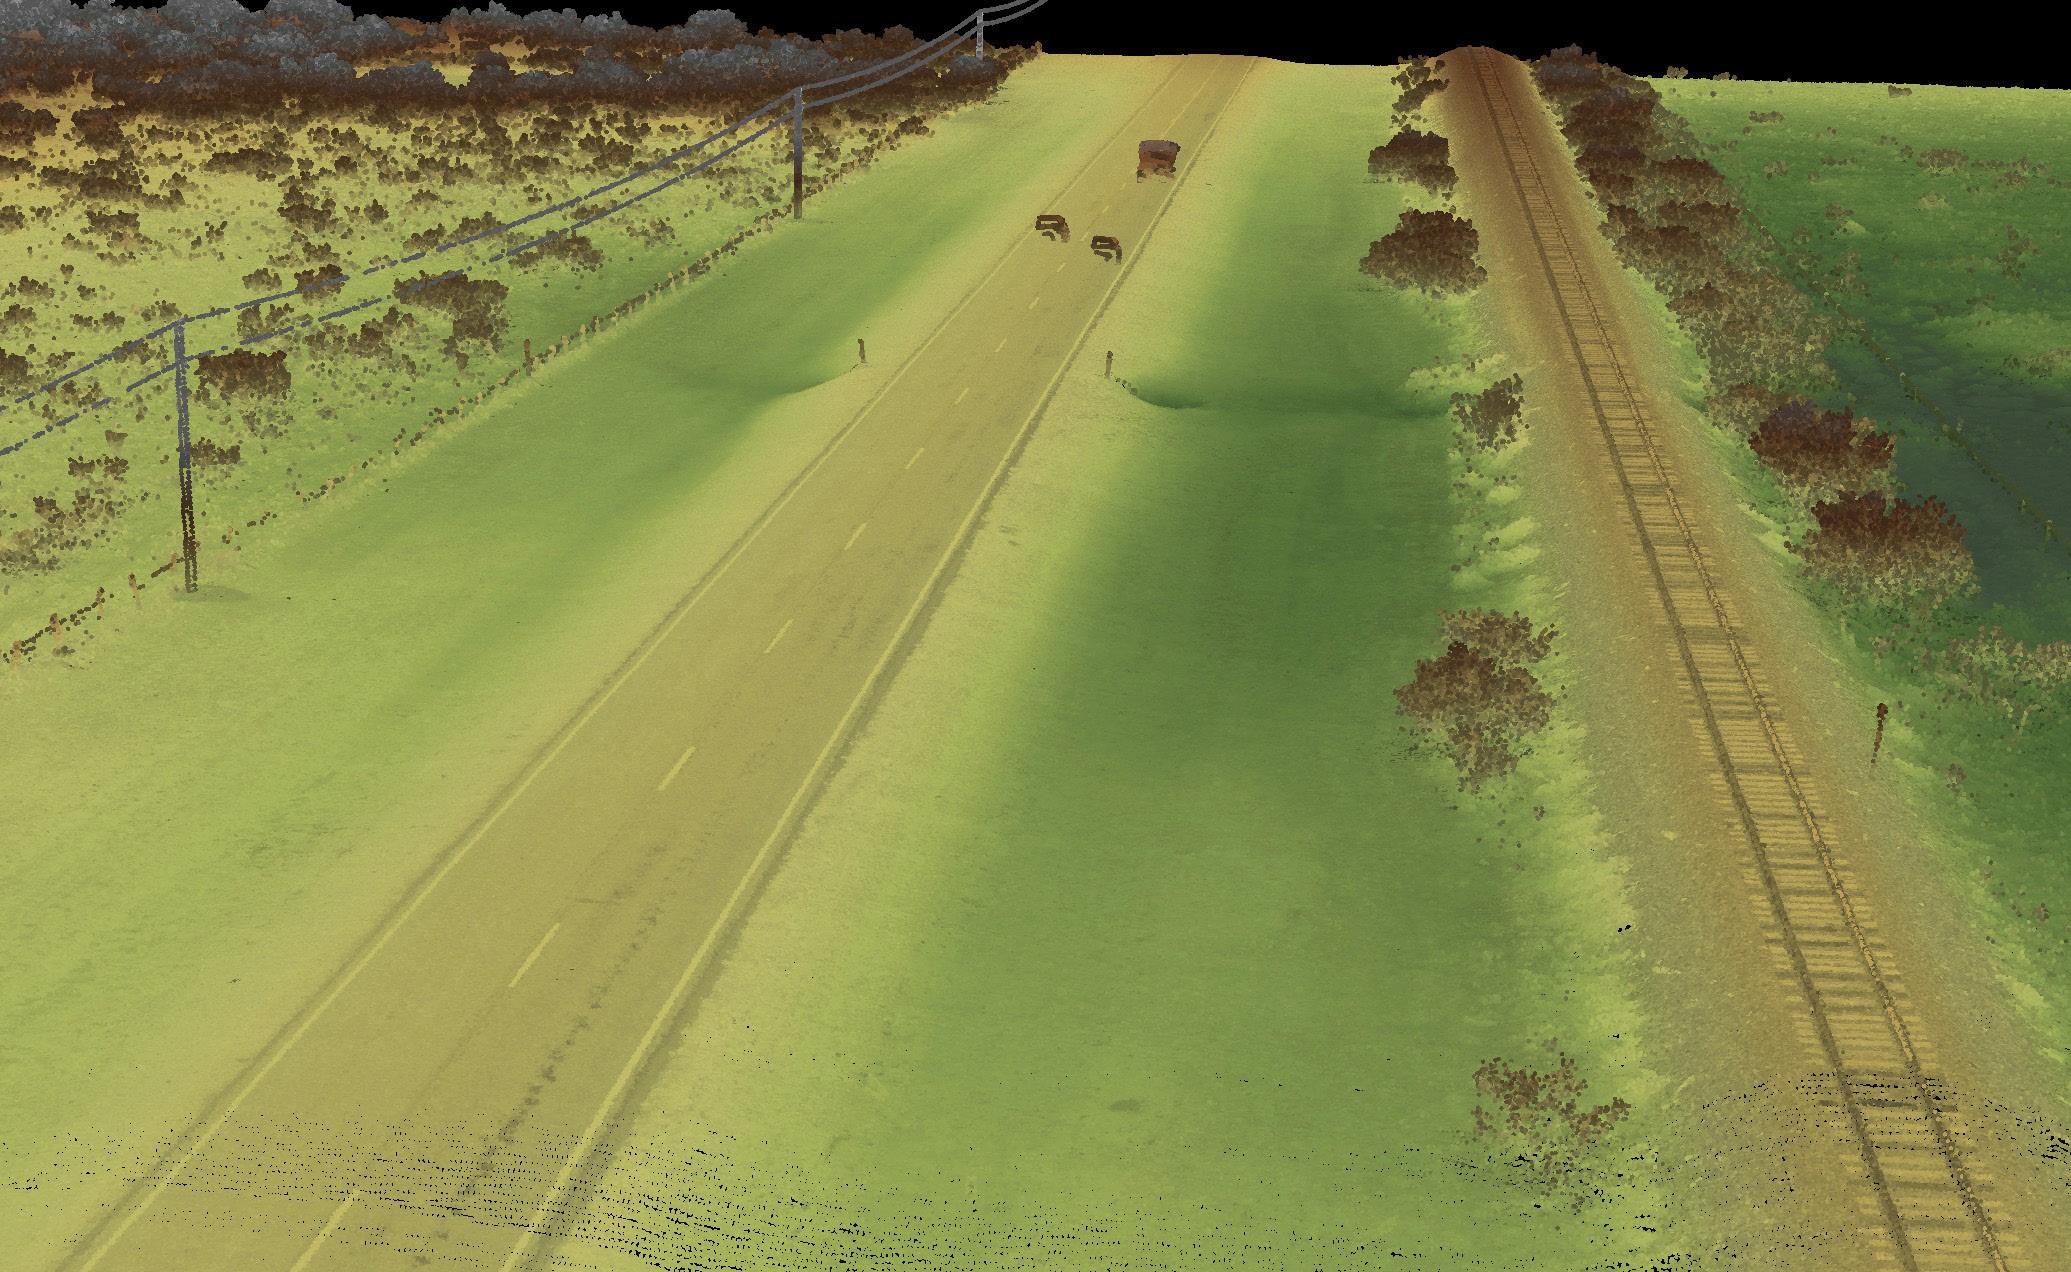
The project area included roadway, above-ground utilities, and a rail corridor, which increased the value of the study.
Technology continues to provide new and improved options for data collection in all areas of geospatial services, leading to better, more complete answers to clients’ needs. These advances can be grouped into three general categories:
- Cost efficiencies, through either reduced acquisition time or the ability to move from a higher to a lower cost platform, for example lidar manufacturers have moved from 1- to 2-MHz lasers and packed impressive performance into smaller, lighter sensors, reducing project cost and impacting the selection of acquisition platforms
- Increased quality, resolution, and accuracy of the data, enabling new and innovative analytics: the performance of key sensor components has improved, as have the laser precision and detection optics, providing accuracy and detail that were unavailable several years ago
- New remote sensing capabilities, such as improvements in hyperspectral and shallow-water topobathymetric sensors that have occasioned a new, comprehensive knowledge of nearshore and riverine environments
Editor’s note: A PDF of this article as it appeared in the magazine is available HERE.
Understanding sensor performance

Project area in southwestern Oklahoma.
An acute understanding of the performance of the new sensors, in both a qualitative and a quantitative manner, is critically important to making recommendations or decisions on how to approach a project. Without sufficient awareness of sensor performance, it is impossible to make authoritative decisions that provide the perfect mix of economy, resolution, and accuracy for varied project requirements.
Discussions began late in 2019, therefore, between NV5 Geospatial1 professionals, NV5 transportation and unmanned teams, and the Oklahoma Department of Transportation (ODOT), leading to groundbreaking research into lidar performance and accuracy over a two-mile stretch of rural roadway in Oklahoma.
The goals were straightforward:
- Understand the horizontal and vertical accuracy of point clouds generated from three types of lidar sensors, flown at three different altitudes
- Develop detailed statistics for lidar accuracy on hard surfaces (asphalt and concrete) and compare the results to those on soft surfaces (bare earth and varying ground cover)
- Evaluate the qualitative aspects of the point clouds in terms of applicability to multiple project types—fine feature determination of signs, rails, above-ground utilities, lane markings, guardrails etc.
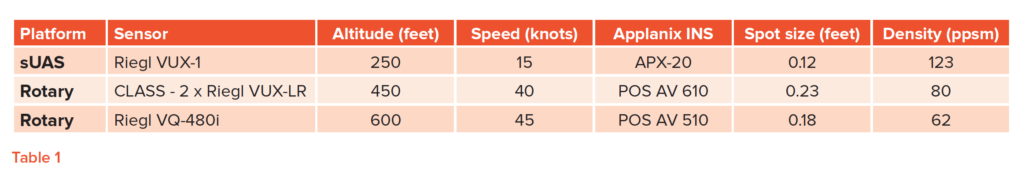
The project used three sensor packages, flown independently at three different altitudes and ground speeds. These were flown on two different rotary wing platforms—a sUAS hexacopter and a helicopter.
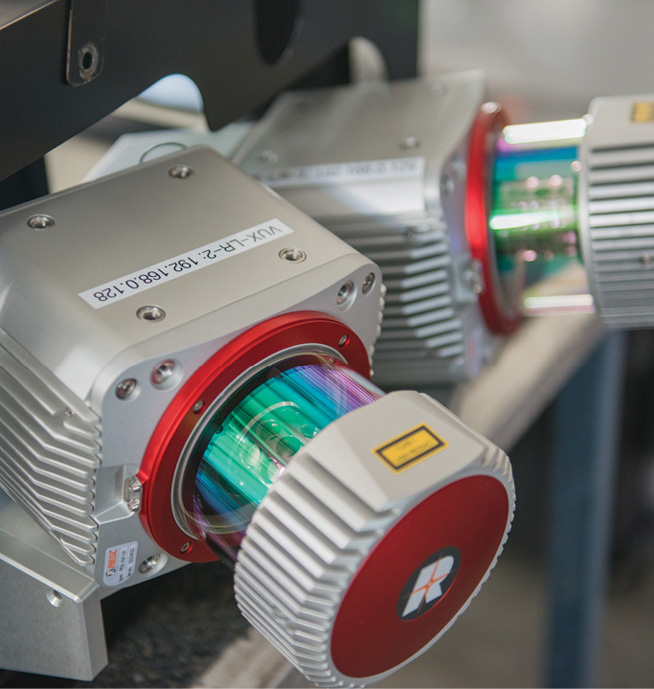
The first package consisted of a single Riegl VUX-1 flown on the sUAS platform. The second was NV5 Geospatial’s comprehensive low-altitude sensor solution (CLASS) that combines two Riegl VUX-LRs (shown right) with nadir and oblique imagery and a real-time weather probe. CLASS was mounted to the belly of a Bell helicopter and flown by the NV5 Geospatial team, as was the third solution, a traditional linear-mode Riegl VQ-480i sensor. Table 1 provides a summary of the packages.
Flight parameters
In developing the flight plans, the overarching goal was to develop point clouds with similar horizontal and vertical accuracies, allowing the point densities to vary between the sensors. These flight planning parameters were based on past experience, but lacked the detailed knowledge gained from this study. The results reported here will inform the planning of future projects.
While each of the three flights was independent of the other two in terms of planning and execution, certain factors were constant among the three, including:
- The same centrally located, high-accuracy GNSS base station was used for all trajectory post-processing, providing an ideal environment given the short baseline lengths
- The same software was used for trajectory processing and creation of the point clouds, given the line-up of all Riegl sensors and Applanix inertial navigation systems (INS)
- The same high-accuracy ground targets were used in the calibration of all point clouds
Ground surveys
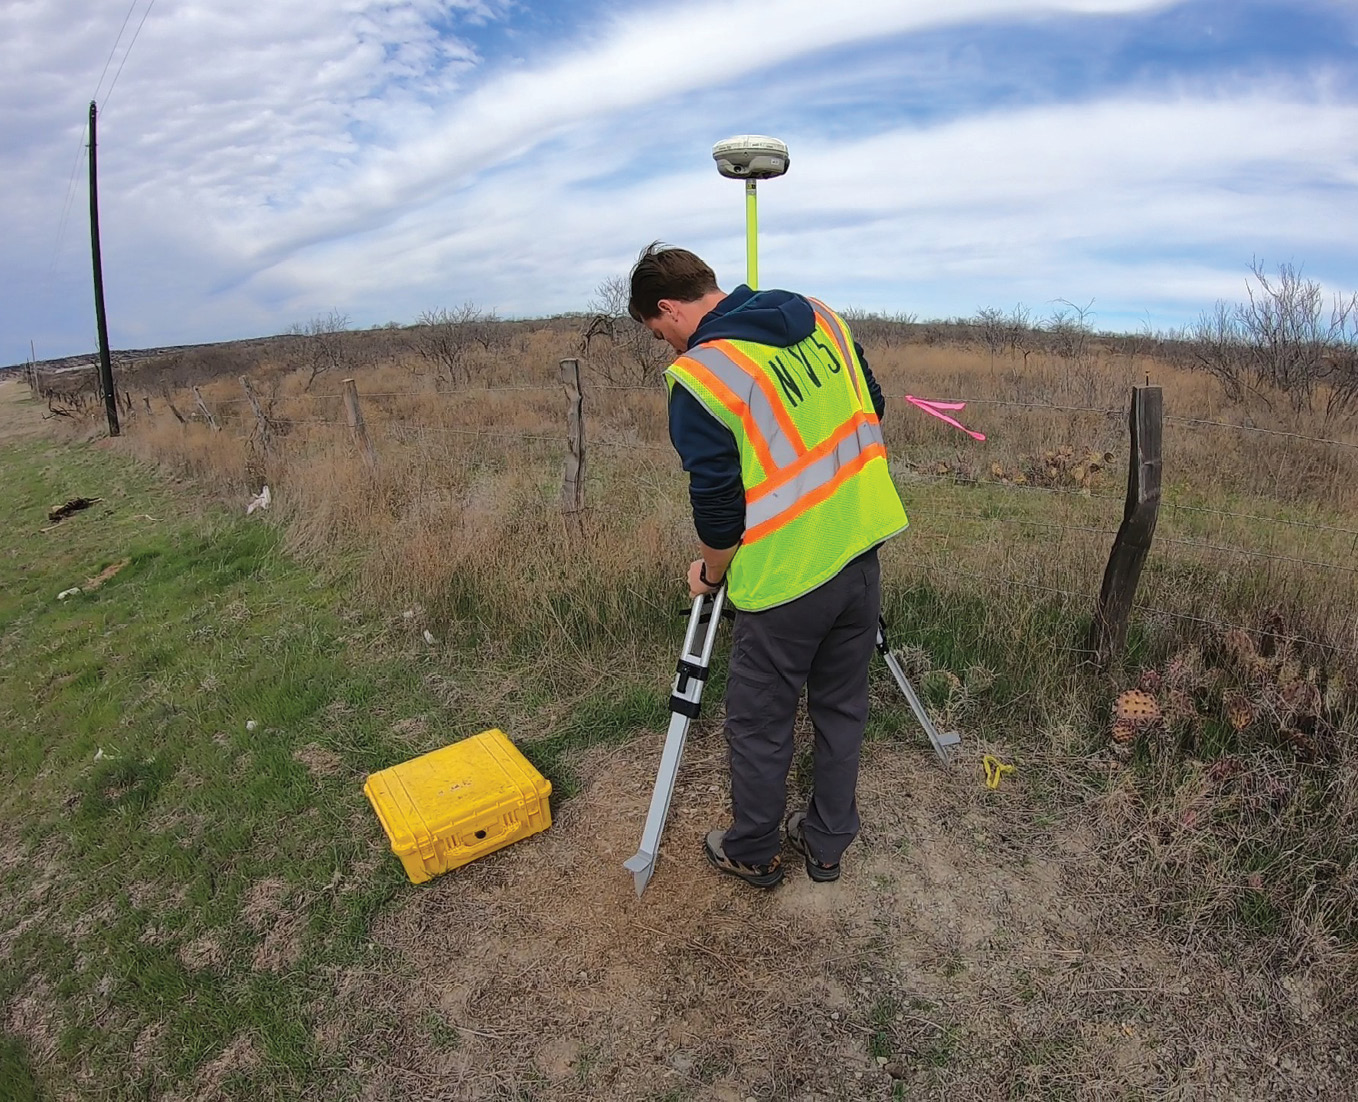
A GNSS occupation was located near the center of the project, providing the perfect base for post-processing the trajectories of all three flights.
The tests depended significantly on the use of high-accuracy 3D calibration and blind check points on the ground, distributed throughout the project area. Quantum Spatial established the calibration points, whereas the ODOT surveying division met the demanding requirements for all the other points, using a mix of GNSS observations and differential leveling techniques to establish 419 3D locations from which to derive the research results. The points were as follows:
- 13 calibration points
- 15 hard-surface (asphalt) blind QA points
- 36 cross-section points on hard surfaces
- 344 cross-section points off pavement in varying land cover
- 24 additional blind QA points on and off hard surfaces
The number of blind points was large in order to provide a deep understanding of the performance of all platforms and sensors. The surveying methodology varied according to the type of point:
- Precision GNSS surveys with dual occupations, two independent base stations, and two very different times of the day, to ensure varying satellite constellations, were conducted for the 13 calibration and 15 hard-surface blind QA points
- Cross-sections set out throughout the project area using GNSS observations for the horizontal (XY) locations and differential leveling to establish the elevation of each of the 380 points
Precision GNSS surveys for the 24 additional blind QA points, following the standard testing procedures performed by ODOT on all aerial projects of this size.
Differential level runs between known control points and loop closures during cross-section surveys closed within 0.02 feet. The GNSS dual-occupation surveys were similarly accurate, with typical elevation differences for the dual occupations measured in the range 0.02-0.05 feet. The two elevations were averaged to give the published values.
Vertical accuracy assessment
In all, 419 blind points were established by ODOT. For the accuracy evaluation, elevations were interpolated at each of the surveyed XY locations in each of the three point clouds and compared to the field elevations. This allowed the tabulation of three differences for each blind QA location. Moreover, the elevations determined from each point cloud were then compared to those from the other two point clouds, allowing us to develop detailed accuracy statistics in six significant ways. The results were fascinating:
- The accuracies on hard surfaces (pavement) were better than expected, and very similar across all platforms
- The accuracy off pavement, in varying land cover, including bare earth, grass and tall weeds, and forested areas, met expectations but exhibited a bias (lidar points consistently higher than ground surveys), included two anomalies, and was lower than on pavement
- The point clouds were extremely consistent with each other, with no anomalies at any of the tested locations
Table 2 provides a summary of the accuracy results from the comparison of the lidar point clouds to ground surveyed check points. The two anomalies outside the paved areas were removed from these statistics.
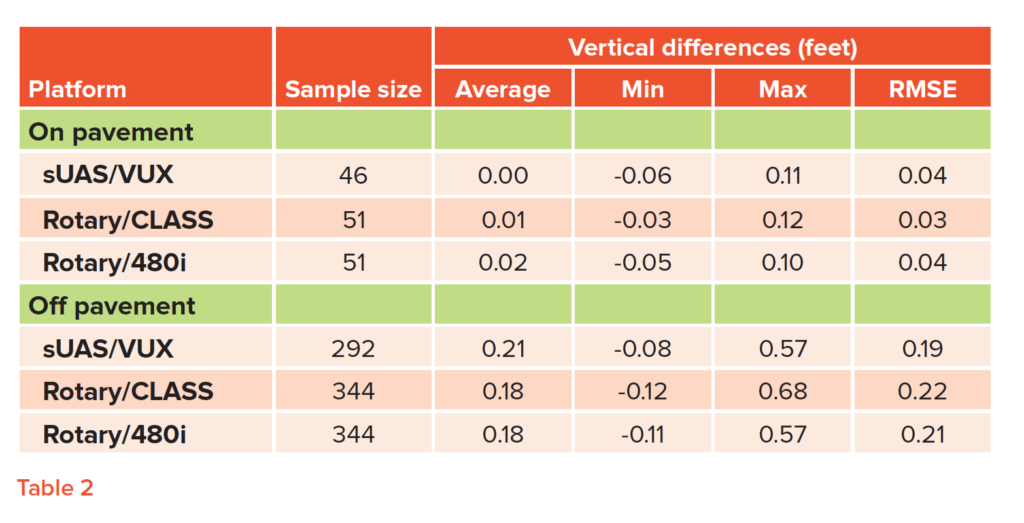
Vertical differences between point cloud and blind QA point
The sample size was slightly smaller for the sUAS platform as the coverage was just less than that collected from the two rotary flights. This decreased coverage excluded a small number of the blind QA points.
The performance of the systems on hard surfaces was extremely impressive with a vertical root mean square error (RMSEΔZ) of 0.04 feet. These results were normally distributed, as is expected on open, hard surfaces, giving a 95% confidence interval of 0.08 feet.
The two anomalies found when comparing the off-pavement points from the cross-section data with the values interpolated in the lidar point clouds were almost certainly a result of changes in the landscape itself. Almost four months passed from the airborne acquisition to the completion of the cross-sections, so there were several possible reasons for the changes. The two points varied by more than a foot in elevation when comparing cross-sections to lidar point clouds, but the lidar point clouds were very consistent with each other at these two locations: the differences ranged from 0.03 to 0.13 feet.
Elevations were determined at each of the 395 XY locations of the blind QA points in each of the independent point clouds determined from the three platforms, i.e. the calibration points and ODOT test points were not used for this evaluation. It was straightforward to compare each of the point clouds to the other two at these locations. A summary is shown in Table 3. The first row of data in the table represents the point cloud created from the CLASS sensor subtracted from the point cloud from the 480i sensor.
Point cloud to point cloud statistics
The data had very little bias, the minimum and maximum vertical differences were quite small, and the RMSEΔZ values of the datasets were extremely strong. There were no anomalies in the data in this large sample.
Finally, ODOT completed additional checks outside the scope of this research project. These tests were in line with what they typically perform for any aerial project before it is used in design engineering. They collected 24 additional points to determine the accuracy of the submitted data. These points covered the entire project area, on and off the paved surfaces. Their tests provided a mean difference of 0.10 feet and an RMSEΔZ of 0.13 feet. When the varying ground cover of these 24 points is taken into account, these results perfectly mirrored the results of the overall research.
Horizontal accuracy assessment
We completed a less rigorous assessment of the horizontal accuracy of the three point clouds in two different ways. The first was simply overlaying the lidar intensity images on the digital orthophotos that were produced for this mapping project. The orthophotos served as another independent source of data, with their own trajectories and calibration used in production. These images were produced at a ground sample distance (GSD) of 0.25 feet. There was perfect alignment at the pixel level, as seen in the image on the next page.
The second assessment was completed by reading the location of each of the targets in the lidar intensity images. The targets were crosses with legs 6 inches wide by 2 feet long. Precisely determining the center of the target was challenging given the resolution of the intensity images. Also note that the sample size was less than ideal for a project of this size. Even so, the results were revealing, as shown in the Table 4.
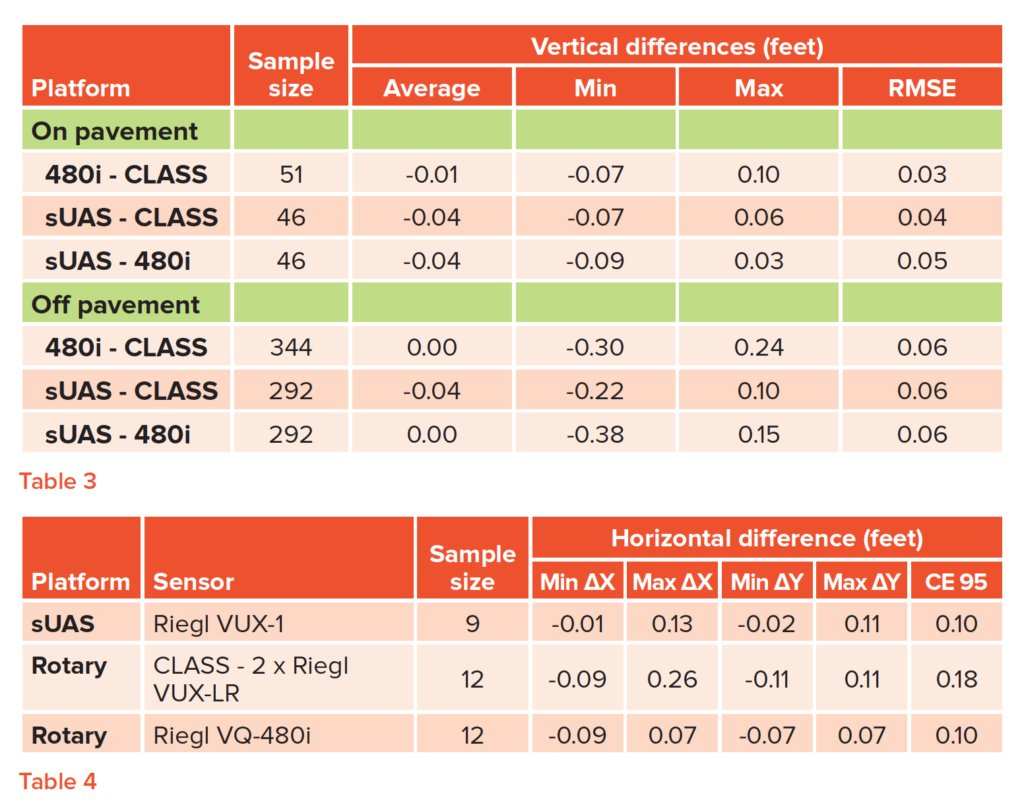
Estimate of horizontal accuracy from intensity images
Much like our evaluation of the vertical accuracy, the results for the horizontal accuracy exceeded expectations. The last column in Table 4 lists the circular errors at 95% confidence, i.e. 95% of well-defined points on the ground should fall within a circle of that radius in the point cloud.
Treat these numbers with care, however, when compared to the vertical accuracy evaluation. They are directionally correct and provide confidence in the data, but are based on much less rigorous analysis. The salient point is that the data exhibits extreme accuracy and there is no statistically significant difference between any of the point clouds.
Value to the professional community
The value of this study to the professional and client community is significant. As far as we know, this is the first large-scale evaluation of multiple current-generation lidar platforms. The results point to the impressive accuracy of the airborne systems flown from altitudes of 250 to 600 feet above ground. Indeed, the horizontal and vertical accuracies achieved in all three point clouds are similar to that expected from a mobile collection on the ground.
Moreover, the testing provides considerable information about the performance of the systems on paved surfaces compared to areas of varying land cover, including bare earth, tall grasses and weeds, and forested areas.
While this investigation was carried out specifically for a roadway project, the results are useful across many project types, including utility, asset inventory, airports, rail, and general engineering design.
Finally, a word of caution is needed. These results represent a single, two-mile-long project area. While the point clouds were highly accurate and perfectly consistent between the three platforms, more work is needed before drawing definitive conclusions. We plan to carry out similar projects over the coming year and share the results with the professional community.
1 Formerly known as Quantum Spatial, an NV5 company.