Mapping activities for the United States are centrally coordinated for a total area of about 3.8 million square miles. The U.S. Geological Survey’s 3D Elevation Program (3DEP) now provides lidar-based elevation data for more than 99 percent of the nation. Across the Atlantic, the picture remains different. Europe’s 3.9 million square miles are divided among some 50 sovereign nations, each with its own mapping mandate, budget reality, and political history.
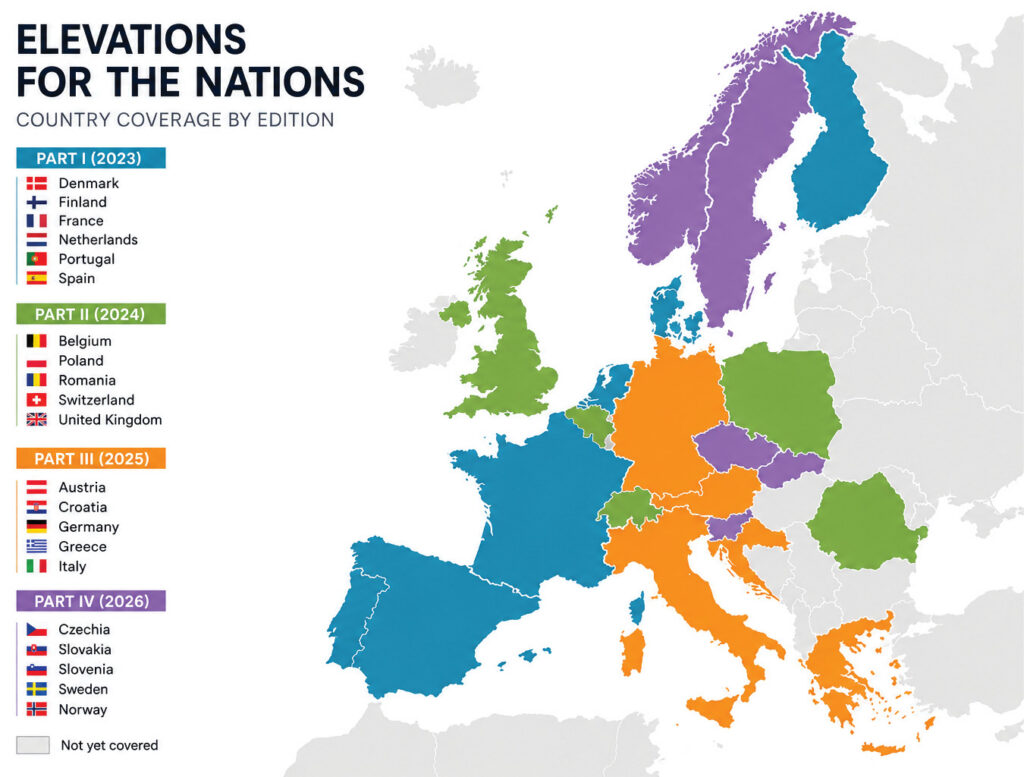
European countries covered in the author’s Elevations for the Nations series.
This is the fourth instalment of Elevations for the Nations, produced in collaboration with the European Association of Aerial Surveying Industries (EAASI)1. Previous editions covered 16 countries: Denmark, Finland, France, the Netherlands, Portugal, and Spain (2023)2; Belgium, Poland, Romania, Switzerland, and the United Kingdom (2024)3; and Austria, Croatia, Germany, Greece, and Italy (2025)4. This edition adds five more: Czechia, Norway, Slovakia, Slovenia, and Sweden.
Each country profile is based on a five-question questionnaire sent to the national mapping and cadastral authority (NMCA). The questions asked about the current status of national lidar coverage; the value-added products derived from the data and how they are used by public authorities and the private sector; the point density selected and the reasoning behind it; innovative or AI-based applications currently in use; and perspectives on the prospects and challenges of a pan-European elevation dataset.
The answers varied considerably. Some agencies run large in-house processing operations with active R&D programs. Others outsource acquisition and classification entirely and focus on procurement design and product delivery. Both approaches are valid, and the contrast itself reveals how lidar capacity is being built across Europe.
A patchwork with common threads
Europe’s lidar programs remain national at the operational level. Of the roughly 50 countries on the continent, 27 are EU member states; Norway, featured in this edition, is not.
Within the EU, two frameworks shape how elevation data is managed without dictating how surveys are flown. The INSPIRE Directive (Infrastructure for Spatial Information in Europe) sets technical specifications for the Elevation data theme, including data models, metadata obligations, and download services, but does not address point density, flight parameters, or update cycles. This is less a deliberate delegation than a reflection of the directive’s timing: when INSPIRE was being defined, airborne lidar was not yet a standard national mapping tool, and the level of detail it now enables was not part of the regulatory conversation. The ongoing revision of INSPIRE may be an opportunity to address this gap.
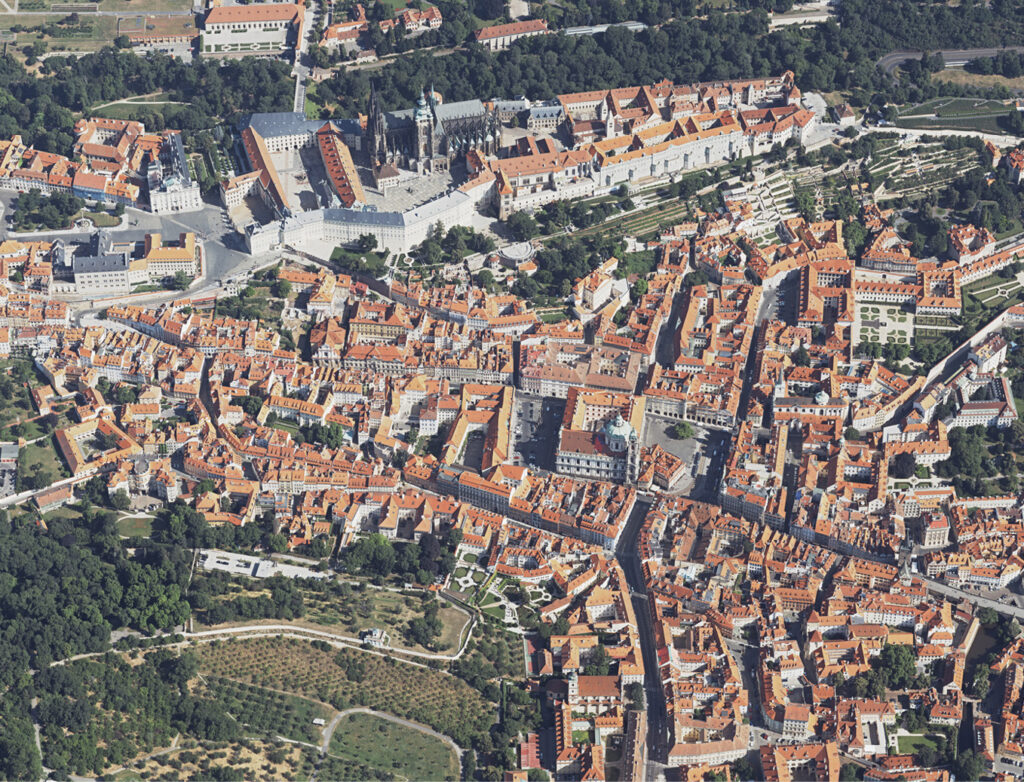
High-resolution oblique aerial image of the Prague Castle complex, Czech Republic. Credit: PRIMIS.
The EU’s Open Data Directive (2019/1024) and its implementing rules classify core reference geodata, including elevation, as “highvalue datasets” that must be made openly available in harmonized, reusable formats, typically via APIs and bulk download.
Two pan-European bodies quietly do much of the alignment work. EuroSDR, the European Spatial Data Research network, has developed widely used practices for documenting point-cloud datasets through workshops and benchmark projects. EuroGeographics, the membership of which includes most European NMCAs, has delivered pan-European reference products in cartography and orthoimagery. Its EuroDEM product, built from member contributions, demonstrates that pan-European elevation data can be assembled from national sources — though its resolution and accuracy are far removed from what national lidar programs now deliver. Several agencies in this series have mentioned EuroSDR as a potential coordination umbrella for a future lidar initiative.
The practical consequences of this fragmentation are already becoming visible in scientific applications. Attempting to build a European Canopy Height Model from existing national ALS datasets, Moudrý et al. (2026)5 found that a decade-old scan from the Giant Mountains National Park in Czechia outperformed all four leading satellite-derived canopy height models tested, with satellite errors ranging from 6.4 to 11.7 meters. The problem is not data quality — it is fragmentation. National datasets were not designed with vegetation structure in mind, and acquisition windows, point densities, and classification schemes diverge enough to make integration genuinely difficult.
Czechia
ČÚZK (Státní správa zeměměřictví a katastru — State Administration of Land Surveying and Cadastre)6 is one of the few agencies in this series that has run its processing pipeline entirely in-house from the beginning. That is worth noting: mission planning, GNSS/IMU processing, strip adjustment, classification, and product generation have all been handled internally since the first national campaign in 2010.
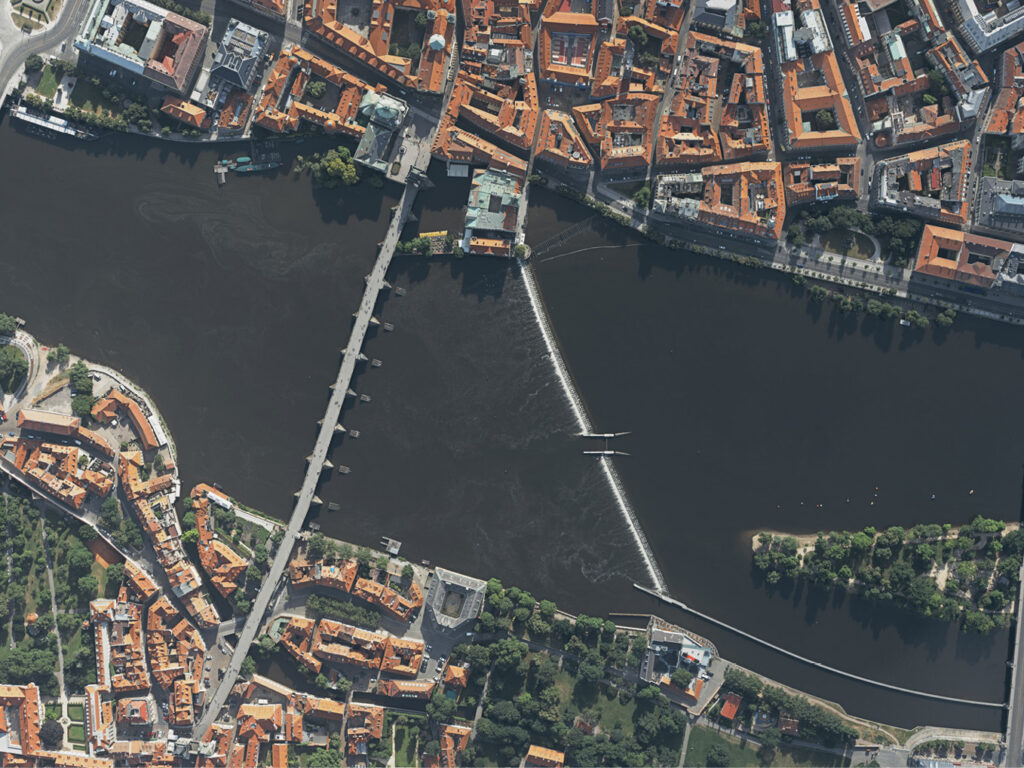
Nadir aerial view of the historic Charles Bridge in Prague, Czech Republic. Credit: PRIMIS.
That campaign, completed in 2013, used a military Aero L-410 FG aircraft equipped with a Riegl LMS VQ-680 scanner integrated into an IGI LiteMapper 6800 system, at densities of roughly 1.2 to 1.5 points/m² (ppsm). The goal was a nationwide digital terrain model — which it delivered, in the form of DMR 5G (a thinned ground-point cloud in LAZ) and the 5-meter raster DMR 4G. Data are distributed in the national S-JTSK/Krovak coordinate system, with delivery in ETRS89 or WGS84 available on request.
Since 2015, a continuous update programme using a Leica ALS80-CM at 5-6 ppsm has kept priority areas current. A gyroplane platform with a Riegl VUX-240, operational since 2024, adds acquisition flexibility for smaller areas. The in-house pipeline has evolved too: SCOP++ gave way to LAStools and TerraScan (with TerraMatch for strip adjustment), now orchestrated through a Python automation framework that integrates PDAL and GDAL, with metadata stored in PostgreSQL.
Processing, AI, and the next campaign
ČÚZK’s approach to AI classification is notably measured. In 2025, the agency evaluated machine-learning classification in both TerraScan and IGN’s Myriad3D, and reports inconclusive results at the time of this writing. The tools exist, but the agency has not yet found a workflow that meets its quality standards reliably enough to integrate into production. For the forthcoming campaign, at least one subcontractor plans to use Flai software for AI-assisted classification, which will offer a practical comparison. This is an honest picture of where automated classification stands in a demanding national context.
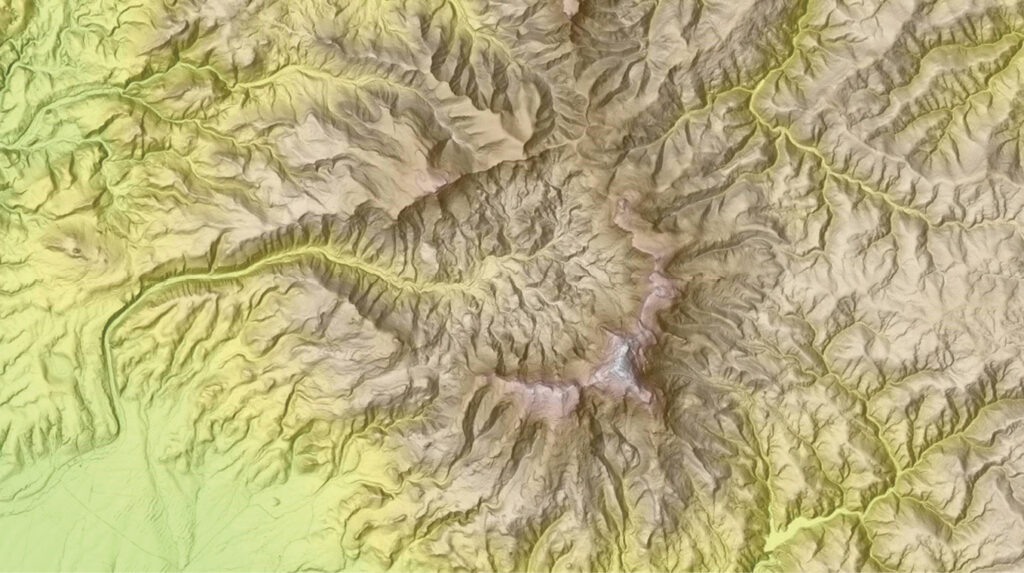
Poľana Extinct volcano in central Slovakia. Credit: Úrad geodézie, kartografie a katastra Slovenskej republiky (ÚGKK).
The new nationwide campaign, running from 2026 to 2029, sets a minimum density of 15 ppsm — a specification driven not by terrain modeling but by a new ambition: a national 3D base model of the built environment, integrating building geometry, transport infrastructure, vegetation, and water bodies. ČÚZK estimates that 12 ppsm is the floor for reliable automated building reconstruction, hence the 15 ppsm specification. For that reconstruction, the agency plans to use Geoflow/Roofer software, with Blender for manual refinement of complex rooftop geometries.
ČÚZK already publishes in ETRS89/EVRS and maintains strict LAS 1.4 compliance. For a pan-European initiative to work, the agency points to what would need to change more broadly: heterogeneous densities and classification schemes, misaligned acquisition epochs, unresolved vertical datum differences, and the need for sustained coordinated funding rather than one-off harmonization efforts.
Norway
Norway completed its National Altitude Model (Nasjonal Detaljert Høydemodell, NDH) between 2016 and 2022. The full terrestrial land area is covered. Kartverket7 now faces the question every agency faces after a nationwide campaign closes: what does a sustainable program look like going forward?
There is no current plan for a centrally funded second nationwide sweep. Instead, approximately 12,000 to 15,000 km² are resurveyed annually through Geovekst, a long-standing collaborative framework that pools funding from municipalities, regional authorities, and national agencies. Kartverket is candid that this rate is not sufficient given the climate risks Norway faces — the country’s terrain is acutely exposed to flooding, landslides, and coastal change.
The NDH was designed at 2 ppsm, which covered the primary use cases at the time: flood and landslide modeling. Areas with higher demonstrated need could be flown at 5 ppsm under Geovekst co-funding arrangements.
Nearly 50,000 areas are downloaded each year from hoydedata.no, with applications ranging from carbon accounting and biomass estimation to solar analysis, 3D city modeling, game development, and archaeology.
Innovation at the margins
Innovation at Kartverket tends to happen at the research edge rather than in production workflows. The agency participates in EuroSDR R&D projects and has involved master’s students in point-cloud classification work, covering both terrestrial and bathymetric lidar data. Image matching has been applied to all aerial image campaigns in Norway since 2021. The agency monitors developments in 3D capture methods, including Gaussian splatting — a neural rendering approach increasingly being explored for geospatial applications — though these remain at the monitoring stage rather than in operational use.
The most substantive forward-looking project is coastal integration: Kartverket is evaluating a seamless terrain model that would combine terrestrial lidar with bathymetric data to produce a continuous elevation surface from mountain to seafloor. The principal obstacle is logistical rather than conceptual. Norway’s coastline is extraordinarily long and intricate, and the steep terrain that runs to the water’s edge makes aerial acquisition expensive in exactly the areas where it matters most.
On pan-European harmonization, Kartverket’s list of obstacles is the most specific of the five countries in this article: update cycle misalignment; divergent vertical and horizontal reference frames with no official transformation between many of them; inconsistent classification standards; data security restrictions; administrative barriers to cross-border sharing; and differences in national priorities and resources. The list is not pessimistic — it is a realistic account of what coordination would actually require.
Slovakia
As recently as 2017, Slovakia had no accurate national DTM or DSM. By 2023, it had completed a full nationwide ALS campaign. It is now well into a second.
The Geodesy, Cartography and Cadastre Authority (ÚGKK SR)8 launched the first campaign in 2017, with scanning completed in 2022 and processing finished the following year. The specified minimum was 5 last-return ppsm. What was actually delivered averaged 30 ppsm — a result ÚGKK attributes directly to how the tender was structured. Rather than awarding on lowest price, the authority used a most-economically-advantageous-tender approach that explicitly scored quality indicators, including point density. Contractors competed on what they could deliver, not just what they were required to. Scanning is carried out during the leaf-off season to maximise ground penetration, since the primary goal of both cycles is a reliable DTM. The result: a specification multiplied sixfold in practice.
For the second cycle, now underway, the minimum has been raised to 15 ppsm — and delivered density is currently averaging 43 ppsm. Priority areas are selected in consultation with the public bodies that use the data, targeting locations where terrain or surface change is likely or has been reported.
ÚGKK outsources acquisition and classification entirely and does not examine the processing methods contractors use — it inspects the delivered products. Point clouds are classified into 10 to 12 ASPRS classes; DTMs and DSMs are generated at 0.5-meter resolution. All products are published as open data under CC-BY.
What the data has revealed
The agency has experimented with LoD 2.0 3D building models but has not moved them into production: automated processing of complex geometries falls short of acceptable quality, and national-scale manual correction is not realistic. That assessment, offered plainly, is itself useful — it reflects where the technology stands for agencies without large in-house processing teams.
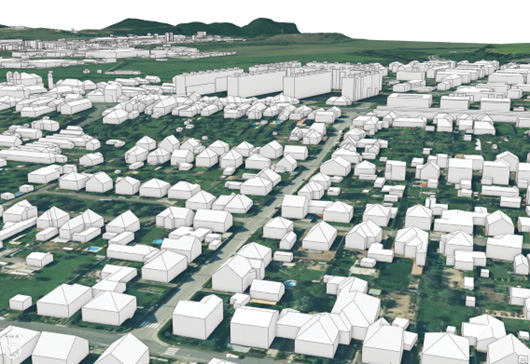
3D vector building model in LoD 2.0 from lidar. Credit: ÚGKK.
Applications include landslide mapping, flood prevention modeling, archaeological prospection, and infrastructure design. Because the data are fully open, ÚGKK has no systematic record of who downloads it. Among the uses it has documented is the identification near Malinová of gold-panning sites dating from the 14th to 18th centuries, found through lidar visualization of forest-covered terrain.
ÚGKK is a member of EuroGeographics. Its view on a pan-European lidar dataset is pragmatic: the existing EuroDEM shows that pan-European elevation data is possible, but quality is uneven. With most European countries either holding or planning high-quality lidar datasets by the end of the decade, the conditions for a more coherent product are gradually taking shape.
Slovenia
Slovenia has run two distinct national lidar programs, which together bring the country to full national coverage at increasingly useful densities.
The first, the Lidar Scanning of Slovenia (LSS), ran from 2011 to 2015 under the Environment Agency (ARSO) and the Ministry of Environment and Spatial Planning. The country was divided into 19 acquisition blocks. Typical point density was 5 ppsm, with 2 ppsm in mountainous and heavily forested terrain and 10 ppsm in high-risk flood zones — a differentiated specification that reflected the program’s primary use case from the outset. Terrain data was available for the whole country by September 2015.
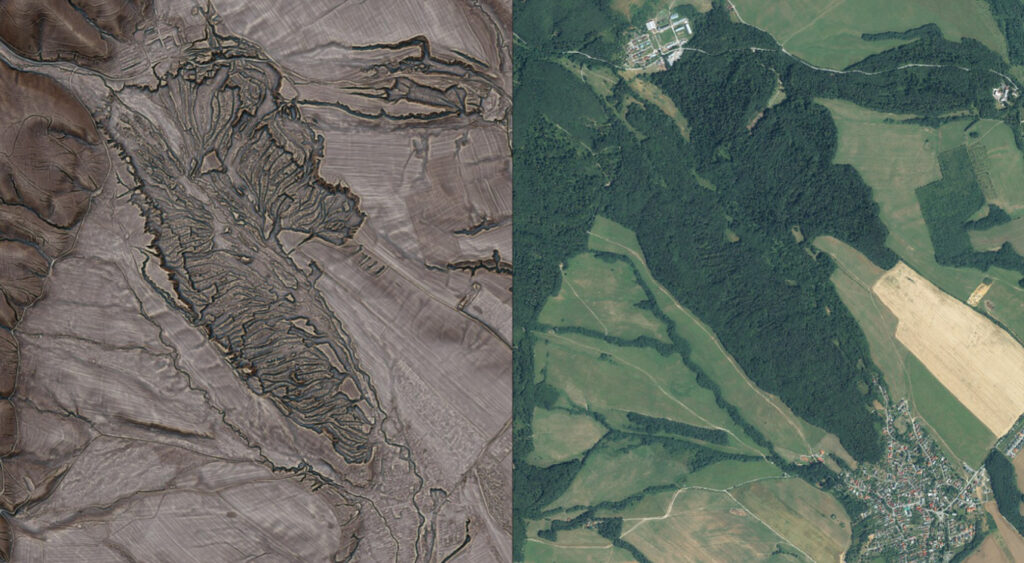
Archaeology of the invisible. Using special visualization techniques, gold panning sites from the 14th to 18th centuries were discovered near the village of Malinová, Slovakia based on lidar data (left). The intense activity of miners left significant traces. The site is currently covered by dense forest (right). Credit: ÚGKK.
The follow-up — the Cyclic Laser Scanning of Slovenia (CLSS) 2023–2025, managed by the Surveying and Mapping Authority (GURS)9, has raised the standard to 10 ppsm nationwide, accompanied by RGBN aerial imagery. Acquisition was carried out in three annual phases, covering one third of the country each year. Distribution is now underway, with data freely accessible through a 3D viewer at clss.si and through the Lidar Slovenia Data Downloader QGIS plugin, in LAZ/LAS and ASC formats. The ARSO portal continues to serve data from the original LSS campaign.
Product outputs include classified point clouds with 13 classes, DTM, DSM, normalised DSM, analytical hillshade, true orthophoto, and infrared orthophoto. A 5-meter Slovenia Elevation Model (DMV 5) is also derived from the lidar data and available for broader use.
Automated extraction and machine learning
GURS is in active production with automated building extraction from the CLSS point cloud — roughly one third of Slovenia has been processed, with the second third in progress. Alongside this, the agency is testing machine learning for updating uncategorized roads from the new data. These are not experimental pilots; they are operational or near-operational workflows, which puts Slovenia in a relatively small group of agencies actively deploying machine learning at the production level.
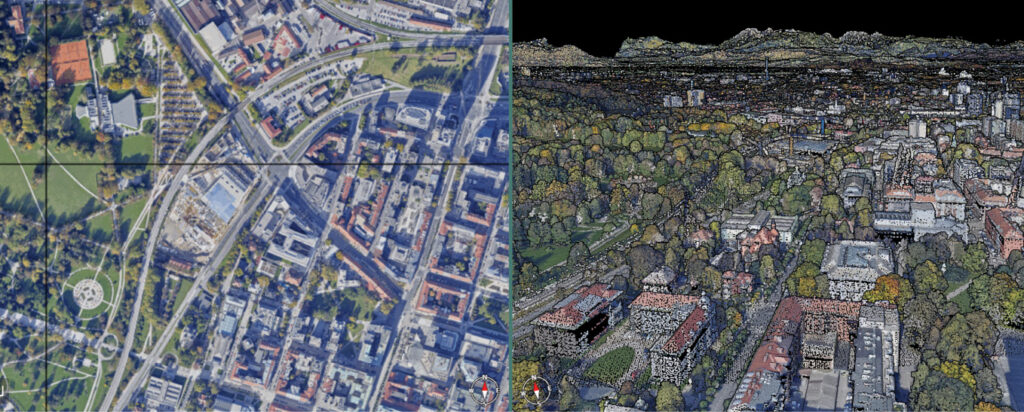
Side-by-side comparison of a nadir orthophoto (left) and the corresponding RGB-colorized 3D lidar point cloud (right) capturing the urban fabric of Ljubljana, Slovenia. Credit: GURS.
Slovenia’s response to the pan-European question carries a particular institutional weight: GURS’s director also serves as president of EuroGeographics, and his answer reflects both roles. The roadmap, in his view, should be federated rather than centralized — built by making national datasets interoperable through harmonized specifications and common reference models, driven by concrete use cases such as climate resilience and risk management. The hurdles span technical, political, and financial domains: differences in acquisition cycles and classification standards, the governance complexity of coordinating many national authorities, and the need for sustained investment not just in acquisition but in ongoing maintenance and service provision.
Sweden
Lantmäteriet10 began replacing Sweden’s 50-meter elevation model with a lidar-based dataset in 2009. By 2019, a near-complete national DTM at approximately 1-meter resolution was in place across roughly 450,000 km², with some mountainous areas along the northern, Norwegian border still being finalized.
The current National Height Model combines legacy acquisitions at around 0.5 ppsm (2009–2019) with newer surveys at 1–2 ppsm, updated on a rolling cycle of approximately seven years. These feed into hydrological analysis and 3D urban modeling workflows. A dedicated forest scanning program, Laserdata Skog, runs separately to keep the national forest database current — an acknowledgement that terrain data and forest structure data have different update dynamics and different institutional users.
Where innovation happens
Innovation in Sweden tends to be distributed. Lantmäteriet has automated the classification of approximately 40,000 bridges and 3,000–4,000 dams from the national point cloud — operational feature extraction at a scale that requires sustained algorithmic development and quality control. Work is also underway to improve the mapping of surface waters from lidar data. On the 3D side, a new national building specification — NS LOD, structured around CityGML 3.0 — has been developed in collaboration with the Swedish National Board of Housing, Building and Planning, and LoD2 building production is being tested through in-house photogrammetry and municipal partnerships combining lidar data with building footprints.
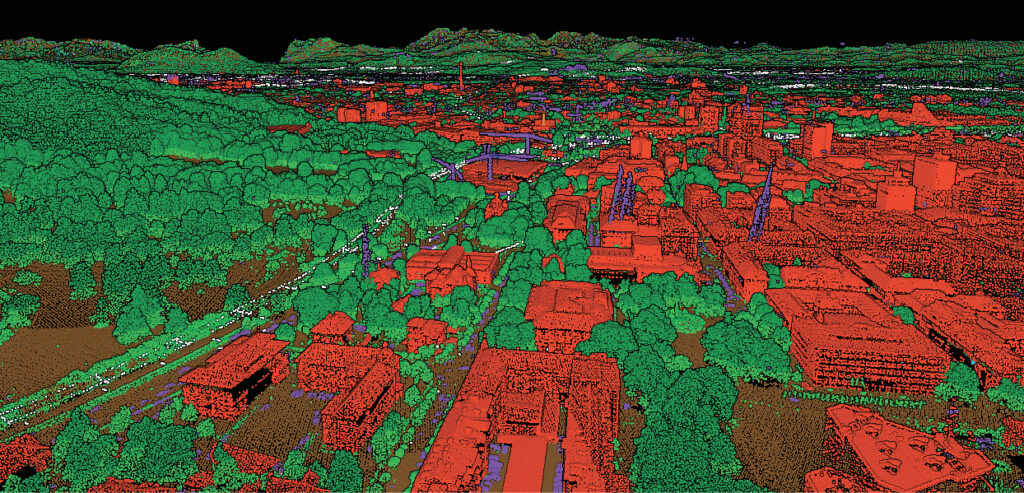
An example of a classified aerial lidar point cloud over an urban area in Slovenia. Standardizing these thematic classification schemes across different national datasets remains a key challenge for pan-European data integration. Credit: GURS.
Beyond the agency’s own workflows, the open national dataset has enabled a wide range of downstream applications: flood hazard mapping, forest density characterization, drainage ditch identification, detection of previously unmapped forest roads, and the location of charcoal pits — remnants of historical iron production that are largely invisible to optical sensors but appear clearly in lidar-derived terrain models.
Lantmäteriet’s view on pan-European harmonization focuses on two things. Data security is one: the question of how openly accessible high-resolution lidar can be across national jurisdictions is not a purely technical one, and it is not settled. Structural harmonization is the other — differences in classification schemes, data formats, and delivery standards across national providers need to be resolved before a truly interoperable continental product is feasible.
Looking across the series
The national elevation activities of twenty-one countries have been described in these four articles. Some patterns are clear.
Point density has risen almost everywhere. Campaigns that flew at 1 to 2 ppsm a decade ago are being replaced — or are planned to be replaced — by surveys at 10, 15, or 20 ppsm, driven by applications that old-generation data simply cannot support: automated building reconstruction, detailed vegetation structure analysis, and infrastructure inventory. The specification is no longer set by terrain modeling alone.
Open data has quietly become the default. Most agencies in this series now distribute lidar products under open licences.
Almost every agency, asked about pan-European harmonization, gave some version of the same answer: technically feasible in principle, genuinely difficult in practice, but worth doing. The specific obstacles — datum misalignments, security restrictions, inconsistent classification, and funding fragmentation — are well understood. What varies is the timeline each agency imagines and how much of the coordination work it sees as belonging to its mandate. 
Acknowledgements
The author wishes to thank ČÚZK (Czech Republic), Kartverket (Norway), ÚGKK SR (Slovakia), GURS (Slovenia), and Lantmäteriet (Sweden) for their detailed responses.
EAASI coordinated agency outreach for this series, and the author is grateful to all EAASI members which have supported the liaison with national authorities across its four parts.
- 1 eaasi.eu
- 2 Perello, A., 2023. Elevations for the nations: Understanding Europe’s varied approach to lidar mapping, LIDAR Magazine, 13(3): 41-45, Fall 2023. https://lidarmag.com/2023/10/07/elevations-for-the-nations/
- 3 Perello, A., 2024. Elevations for the nations: Understanding Europe’s varied approach to lidar mapping, Part II, LIDAR Magazine, 14(3): 40-48, Fall 2024. https://lidarmag.com/2024/09/22/elevations-for-the-nations-part-ii/
- 4 Perello, A., 2025. Elevations for the nations: Understanding Europe’s varied approach to lidar mapping, Part III, LIDAR Magazine, 15(3): 36-43, Summer 2025. https://lidarmag.com/2025/08/30/elevations-for-the-nations-part-iii/
- 5 Moudrý, V. et al. 2026. Spaceborne canopy height products should be complemented with airborne laser scanning data: toward a European canopy height model. Earth and Space Science, 13, e2025EA004544, 20 pp. https://doi.org/10.1029/2025EA004544
- 6 https://cuzk.gov.cz/
- 7 https://www.kartverket.no/en
- 8 https://www.skgeodesy.sk/sk/
- 9 https://www.gov.si/en/state-authorities/bodies-within-ministries/surveying-and-mapping-authority/
- 10 https://www.lantmateriet.se/