 There has been a dramatic growth in the past decade in subsurface utility mapping, but the need for improved utility location continues to be an issue. “Plans alone are not sufficient to identify and locate services before starting work. They provide basic information on which to base a thorough site survey before work begins” as stated by UK Health and Safety 1. The US Common Ground Alliance (CGA) also reported in 2014 some 17% ($136 Billion) of utility related accidents or near misses were attributed to “insufficient locating practices” 2 . The U.S. Occupational Safety & Health Administration (OSHA) also reports that, “The fatality rate for excavation work is 112% higher than the rate for general construction”. “When applied properly during the design phase, Subsurface Utility Engineering (SUE) provides significant cost and damage-avoidance benefits and the opportunity to correct inaccuracies in existing facility records.” 3 The National Transportation Safety Board (NTSB) and other authorities often cite the lack of location data as a factor in pipeline accidents. 4
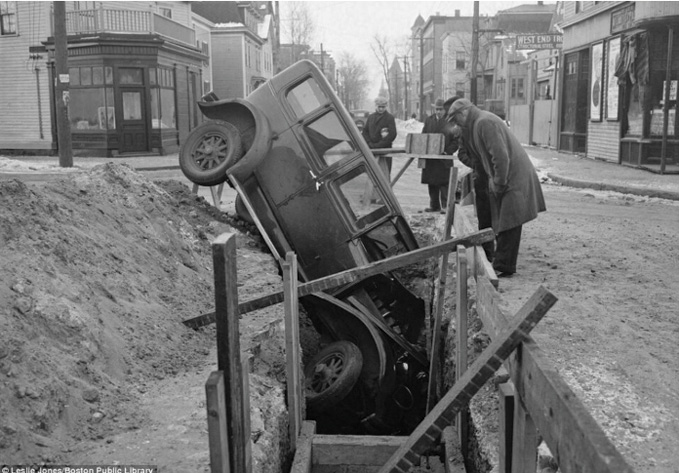
Figure 1: The utility workspace has long been a hazardous place.
Although great improvement has been implemented in the past decade with the rolling out of “Dig Safe”, “One Call”, “811” and other similar services, “65% of all buried utilities in the US are privately owned, Dial 811 will not respond to these facilities,” according to the CGA Dirt Report. There is also a huge liability of having survey crews venturing onto active roadways to identify and mark utility locations, so keeping staff safe while not impeding traffic flow is becoming more and more of an issue to companies and municipalities. To the subsurface utility engineering and mapping (SUE/SUM) business community, this is of great importance relating to insurance and human liability.
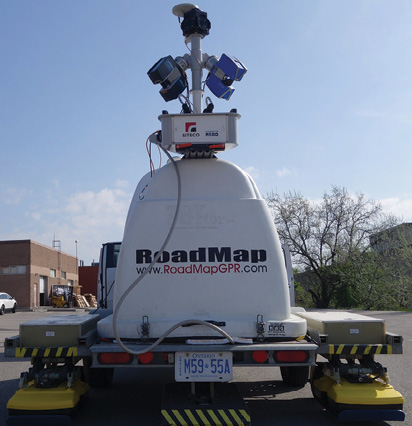
Figure 2: SITECO’s Roadscanner Compact equipped with with dual FARO Focus scanners mounted on SSI’s mobile GPR trailer with three antennae.
Taking A New Approach
The DGT Associates Subsurface Utility Mapping group, Boston, MA, USA, led by Michael Twohig, requested a proof-of-concept project for simultaneous roadway speed data collection of mobile lidar, imagery and ground penetrating radar (GPR) with multiple antennas and different frequencies. DGT has been looking for technology partners that have the existing, reliable technologies that could build a mobile mapping system to reduce the time geospatial staff (surveyors and utility locating technicians) are working in active roadways and travel lanes. The primary purpose of this method is to minimize the need for subsurface utility detection to be carried out in live traffic. Every year there are numerous accidents involving vehicles hitting utility locator crews (Figure 1). This has caused many authorities to be putting much stricter regulations on survey teams working in roadway environments. The target of this project is to prove a viable workflow for mass data collection and virtual data analysis in a safe office environment minimizing the need to place survey crews on the roadway.
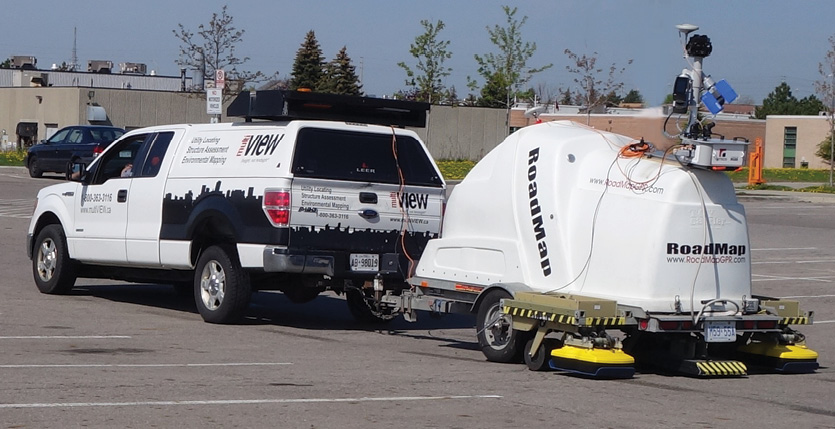
Figure 3
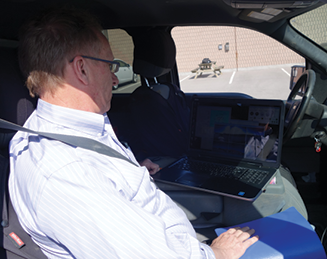
Figure 4
Simultaneous Data Collection
Through a collaboration by SITECO Informatica, Bologna, Italy (SITECO), Sensors & Software Inc, Mississauga, ON, Canada (SSI), and DGT Associates, Boston MA, the project was realized to collect simultaneous lidar data above ground and GPR data below the surface. SITECO manufactures the RoadScanner family of high performance mobile mapping products while SSI is a leader in ground penetrating radar sensors. Additionally, SSI’s sister company, RoadMap Inc. also of Mississauga, Canada, has an existing fully integrated trailer system for roadway speed data collection. All that was required was mounting the SITECO RoadScanner-Compact (RS-C) system, equipped with dual Faro Focus 3Dlaser scanners, an Applanix AP20 Inertial Navigation System and FLIR Ladybug 5 spherical camera, the existing trailer, already outfitted for a 3 GPR antenna configuration with 2x 250MHZ antennas on the outsides and a single 1000MHZ antenna in the centre (Figures 2, 3 & 4). Future plans are to additionally integrate thermal and/or multispectral sensors along with road surface planimetric sensors, such as SITECO has recently delivered their PaveScanner system which includes the LCMS profilers from Pavemetrics, Quebec, Canada 5.

Figure 5
There were 2 phases to this project, the first carried out on 14 May 2018 was the initial test drive, a short data collect of approximately 15 minutes, covering approx. 4 km, followed by a second more comprehensive data collect on 16 May 2018, comprising 19 km over a 1 hour period over a wide variety of different paved roadway environments.
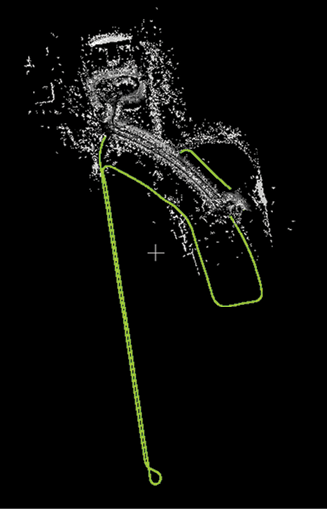
Figure 6
Beneath the trailer cap was the power control unit for the RS-C and the data collection/control unit for the SSI GPR. Power was supplied by a 12V fast cycle marine grade battery, capable of supplying up to 3 hours of continuous power to both systems. A dual GPS antenna system was employed to provide a baseline for the inertial navigation system to correct trajectories from. The front antenna was mounted by suction cup on the front of the trailer cap and calibrated with the standard GAMS procedure. An Ethernet cable was run into the cab of the truck towing the system, where both RS-C and GPR were controlled from (Figure 5). Overall, data was collected at speeds ranging from 10kph up to 85kph, in both cases very successfully. Accuracy of the data is very well in line with the published specifications of both equipment manufacturers.
Data Post Processing
Once data was collected, the RS-C lidar and spherical imagery data was post processed to be co-registered into a single coordinate space (WGS 84) and later converted to a LAS format. This entire process required about 2-4 minutes for every minute of data collection, depending on the final deliverable data product, but is a very simple batch process which is typically done overnight for longer data collects. In this project, within one hour we had the first colour lidar dataset for visualization.

Figure 7
In the case of the GPR data, which is processed through SSI’s Ekko Project software, there are more difficult considerations to be made based on earth type (clay, rock, sand, etc.), surface material (concrete, asphalt, gravel, etc) among others. This requires greater human expert intervention in the post processing phase. In all, within 12 hours we had our first set of co-referenced data. To merge the data into a single view, all data was converted to LAS format and viewed using the open source Cloud Compare software 6.
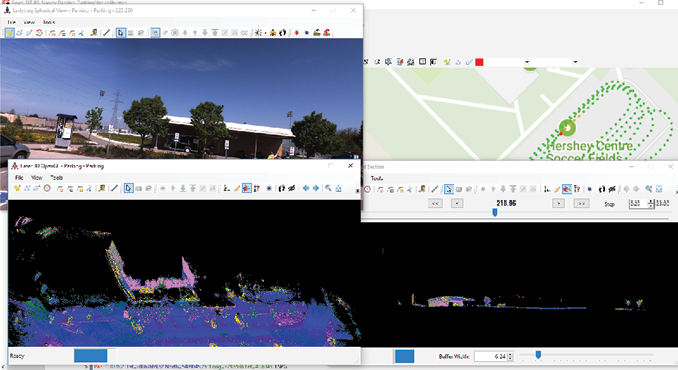
Figure 8
Data Visualization and Analysis
In designing this project, great consideration was placed on the number of GPR antennae to be used. While a larger number of sensors produces a closer to 3D subsurface view, it dramatically increases the need for data post processing time. Since we typically are looking only to identify the actual location of objects in comparison to existing drawings. Once a first evaluation is made if there are conflict between drawing and a “virtual inspection” from the mobile data , a further evaluation may warrant sending a crew onsite.
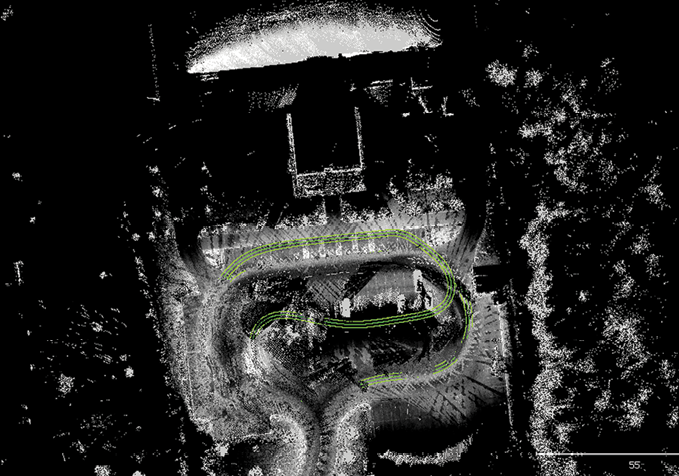
Figure 9
In a top view of the entire first day’s drive (Figure 6), only a small portion of the overall pointcloud is included, as we specifically were looking for some features at the circular parking area in front of the soccer dome. The GPR track and drive trajectory are clearly seen in green. Figure 7 & 8 is the view from within Siteco’s standard Road-SIT Survey inspection software. What was noticed was that on Monday’s first test run the soccer dome was inflated, by Wednesday morning it was gone! This is a prime example of the importance of change detection.
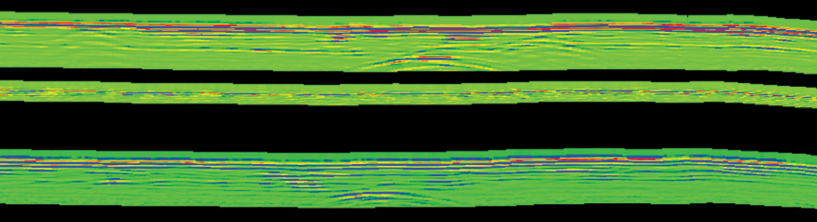
Figure 10
As we zoom in closer (Figure 9), clearly visible are the lidar intensity points, showing the markings on the parking lot area along with the 3 GPR data traces in green. These are very important to note as it allows for safe and very precise location of subsurface items. Zooming even closer to the surface, tilt the dataset, remove the lidar information(Figure 10), the central antenna is shown with it’s much shorter range than the outside antennas on this single pass, due to the much higher frequency giving less depth penetration but higher resolution data.
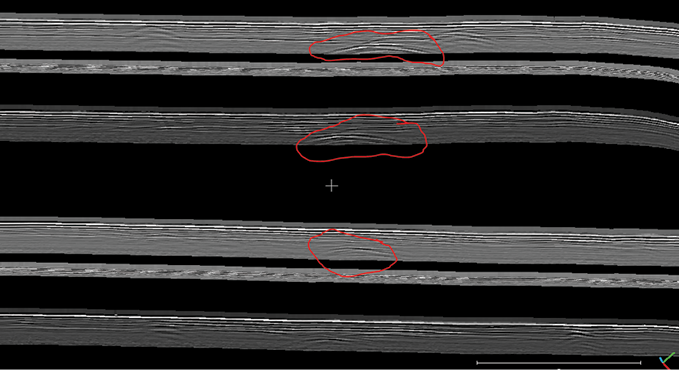
Figure 11
When we widen the viewing area (Figure 11) and remove the colour lookup table, replacing it with the grey amplitude map of the radar (this is the more traditional method for visualization of GPR data in linear strips) across 2 separate data collection passes. Further analysis shows the buried power cable which is known to be in this area (Figure 12).
Our ultimate goal is to build all sensor interfaces directly into SITECO’s Road-SIT Survey software, allowing concurrent and simultaneous data visualization. Figure 13 is an example of an earlier successful experiment approx. 8 years ago, employing a Roadscanner 4 equipped with single FARO LS880 scanner, a surface profile rut bar (for road surface planimetric measurement) and a single GPR antenna mounted on the front of the vehicle, however at much slower speeds. Clockwise from left is the front camera image with laser scan profile overlay and several placemarks on the roadway, next at top right is the radar image with the corresponding locations of the placemarks and lower right is a horizontal section at the road surface looking from above, again showing the placemark locations simultaneously.
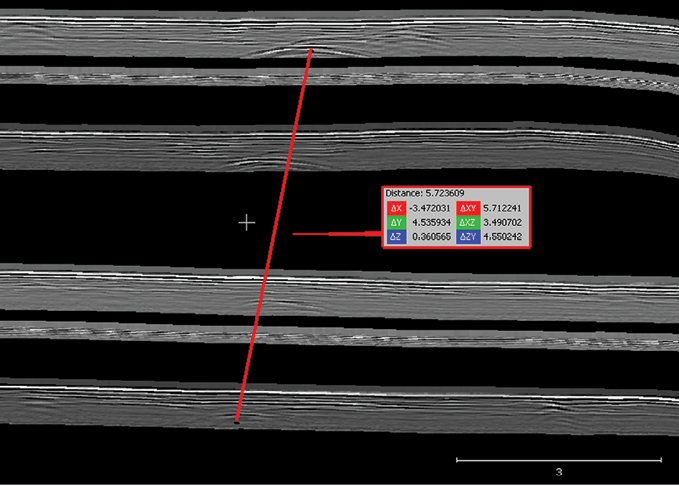
Figure 12
There is considerable discussion of adding many GPR antennae to get a more comprehensive 3D view of the subsurface environment. We chose to employ three antennae as the data processing time is very compatible with the overall project requirements. The point is not to get a comprehensive 3D view, but to capture a “regional snapshot” where the major elements of interest (pipes, utility cables, voids indicating potential sinkholes, etc.) so a very precise location can be determined via the lidar data. This location information can be easily compared to existing and historic drawings, even directly within a GIS or CAD environment via the SITECO Road-SIT Survey software. The corresponding GPR data will help confirm the accuracy of the actual position, resulting in a much safer and better planned deployment of ground crews to investigate further before any actual digging commences.

Figure 13
Making the SUE/SUM Workspace Safer
In summary, this project was a complete success, simulating all of the capabilities as first stipulated. We feel this can be a groundbreaking milestone in improving safety and data collection efficiency in the subsurface utility engineering and mapping (SUE/SUM) business community. The project clearly demonstrated the comparison of data collected by traditional utility surveying methods and the ability to capture high-quality, reliable data from active roadways, at posted speed limits. This is an enormous step forward for utility surveying practitioners. Designers and engineers will have great insight into a project within hours or days of a survey as opposed to weeks or months. The existing software has demonstrated well established workflows that can be scaled up for very large projects.
Initial results were co-presented by Gelhar and Twohig at the SPAR 2018 conference on June 6th 2018 in Anaheim, CA, USA.
Endnotes
1 UK Health and Safety HSG47 (Third edition), originally published in 2014
2 Common Grounds Alliance, refer to the 2014 CGA “DIRT” Report
3 Common Ground Alliance (CGA) 2-14 SUE Best Practices 2016, Version13
4 MAPPS 2013 Government Affairs meeting.