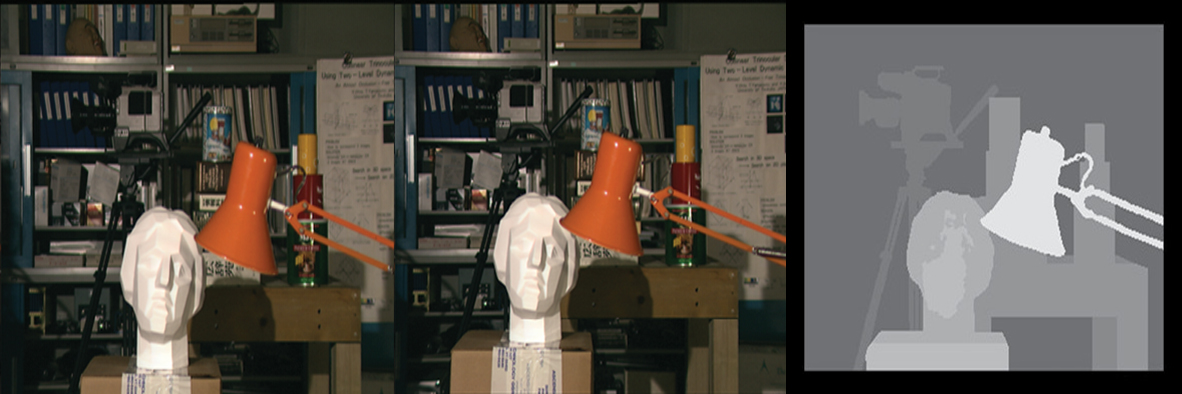
Figure 1: Left and right images of a stereo pair and the “disparity” map (right) showing the differences of each pixel in the right and left image.
Wikipedia has defined a “Point Cloud” as a set of data points in some coordinate system. In a three-dimensional coordinate system, these points are usually defined by X, Y, and Z coordinates, and often are intended to represent the external surface of an object. Historically, point clouds have been created by active remote sensing scanners such as radar and Laser scanners that are used in aerial and terrestrial platforms. Laser scanners measure many points on an object’s surface and often output a 3D point cloud as a data file.
Point cloud geometry is often known, rather mistakenly, as LiDAR. LiDAR is a technology for making point clouds, but not all point clouds are created using LiDAR. With the advent of Semi-Global Matching (SGM) and Structure from Motion methods (SfM), point clouds can be made from images obtained from digital cameras. In this paper, we will describe the concepts behind the point cloud obtained from active scanner and cameras. We will also study the characteristics of the data obtained from different laser scanners and imagery.

Figure 2: SFM Workflow
In general the quality of the point cloud obtained from LiDAR depends on scan frequency, point density, flying height etc.. The quality of point clouds created from the imagery using SGM or SfM are predominately affected by the ground sample distance (GSD), flight altitude and image content.
In traditional photogrammetric methods, a point cloud is created using a manual stereo compilation process. Stereo compilation begins with digitizing 3D surface data at a regular interval from stereo imagery. These “mass points” are then supplemented with break lines at significant terrain changes such as ridges, summits, depressions, road edges and hydrographic features. With the advent of softcopy stereoplotters, some aspects of point cloud generation were augmented using autocorrelation techniques. These were an early form of computer vision that identified pixels within two or more images that were correlated with each other and then photogrammetrically assigned to those pixels horizontal and vertical coordinates. Because these methods require considerable manual labor, the point clouds are typically much sparser (1 ppsm or less) than those created from Lidar (2-100 ppsm), SGM (hundreds of ppsm), or SfM (hundreds of ppsm).
Semi-Global Matching or SGM is a recent technology developed in the field of computer vision to exploit digital camera systems.. The Semi Global Matching (SGM) stereo method is based on the idea of pixel-wise matching cost (disparity) of Mutual Information (MI) for compensating the radiometric differences of input images and uses a smoothness constraint. The core algorithm of SGM aggregates the matching costs under consideration of smoothness constraints (that is, an assumption that pixel values will change gradually as you move in any direction and they will likely be close in value to their neighbors). The minimum aggregated cost leads to the disparity map for a stereo pair (the disparity map shows the distance between two corresponding points in the left and right images of a stereo pair) and subsequently to textured 3D point clouds in object space. The large numbers of matches found in this way allow for the creation of very detailed 3D models. Basically, SGM provides the corresponding location (X,Y, and Z) for each image pixel and returns a point cloud with a point density approaching the GSD of the imagery.
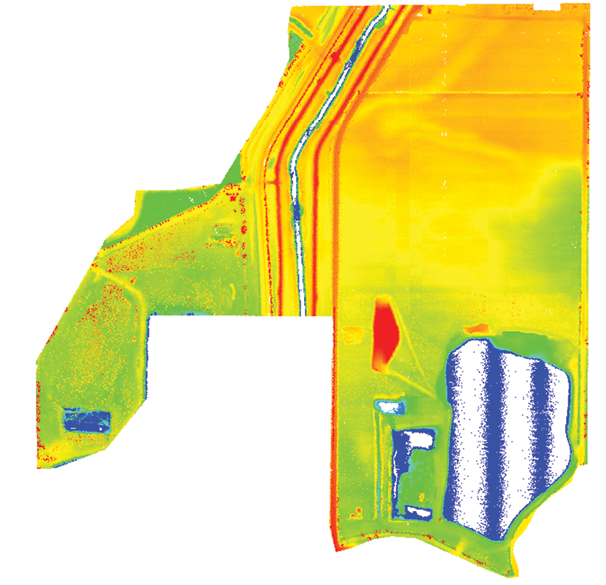
Figure 3: UAS based LiDAR and Elevation grid from UAS based imagery
SGM methods have several advantages over softcopy photogrammetry and autocorrelated point clouds. First, softcopy point clouds are typically computed using intensity values of each pixel. This causes several problems because the intensity of a feature in one image may vary due to sun angle, shadows, or reflections from the same feature in an adjacent image. In fact, many pixels cannot be matched to similar pixels in the adjacent imagery because of these intensity, reflection, and other differences. SGM, therefore, uses “mutual information” (i.e., a statistical measure of mutual dependence between two random variables (like pixel intensity) to correlate similar pixels between multiple images and is much more robust against varying intensities and reflections. Second, SGM is much faster than autocorrelation. This becomes a major advantage when processing thousands of very large images.
SFM, on the other hand, is computer vision technique based on the principles of photogrammetry wherein multiple overlapping, offset images are used to reconstruct a 3D point cloud of large complex scenes from a series of overlapping photos taken from different, overlapping positions. The SfM method uses a highly redundant bundle adjustment to reconstruct a sparse 3D point cloud of large complex scenes. The SfM approach computes simultaneously both this relative projection geometry and a set of sparse 3D points. To do this, it extracts corresponding image features from a series of overlapping photographs captured by a camera moving around the scene. SfM relies on algorithms that detect and describe local features for each image and then match those two-dimensional (2D) points throughout the multiple images. Using this set of matched points as input, SfM computes the position of those interest points in a local coordinate frame and produces a sparse 3D point cloud that represents the geometry or structure of the scene. As mentioned previously, the camera position and internal camera parameters are retrieved as well. Subsequently, the multi-view stereo is applied as the last stage by using the SfM result as an input to generate a dense 3D model. Multi-view stereo is the general term given to a group of techniques that use stereo correspondence as their main cue and use more than two images covering a single point.

Figure 3: UAS based LiDAR and Elevation grid from UAS based imagery
In the SfM process (Figure 2), after the relevant photos are imported, the feature matching and relative photo alignment is performed. Tie points are detected based on a stable viewpoint and consistent lighting variations and generates the descriptor based on its local neighborhood. The descriptors are then used to align the overlapping photos leading to a sparse point cloud. Next, the initial camera locations are improved by using bundle adjustment algorithm based on the photos’ Interior Orientation and Exterior Orientation parameters. Finally, the dense image matching points are constructed based on the multi-view algorithm. The last step is texture mapping by assigning the RGB values to each point.
How Traditional Photogrammetry, SfM and SGM Differ
Traditional photogrammetry relies on straight lines of overlapping imagery to produce point clouds. Surfaces are computed from two overlapping images. SfM allows for random images to be taken from varying angles and distances to create 3D geometry. As with traditional photogrammetry, to properly rectify the three-dimensionality of objects through a SfM approach, the objects must be present in multiple (3 or more) images. As more overlapping images are added, the result improves especially when using controls. Additionally, SfM uses the scale invariant feature transform (SIFT) algorithm that recognizes conjugate features (physical features) in multiple images despite dramatic differences in the image scale and viewpoint.
SfM is a technique to compute 3D surfaces from multi-view images. Additionally, SFM camera positions and orientation are solved automatically without the need to first specify a network of targets with known 3D positions. These are instead solved simultaneously using highly redundant, iterative bundle adjustment procedures that are based on a database of features automatically extracted from the overlapping imagery. Also, the simultaneous self-calibration of the camera’s interior orientation parameters is performed in the process. An important property of SfM-derived point clouds is that they are not initially tied to real world space and orientation but rather to object space coordinates. The point cloud can be transformed to real world space by using a small number of known ground-control points (GCPs) that can be identified on multiple images. The SfM allows high-density point clouds of the first reflective surface (or the surface of features) to be rapidly and automatically extracted from stereo-imagery. In practice, it is not able to produce a point cloud for every pixel in the source imagery but only about every third pixel. SfM is a far more complex procedure that includes feature extraction, image matching, filtering, bundle adjustment (with or without control points),3D surface generation, and texture mapping.
SGM is a pixel-wise matching algorithm that is robust and can preserve edges. The original algorithm performs matching with stereo images (just two) in contrast to multiple-view images in SfM. However, there are variants to SGM that can handle multiple-view images. These variants typically perform matching with all possible stereo images and combine the results to create a final result. Hence, SGM can be used in SfM to generate dense point clouds.
Comparison of LiDAR and Imagery-based point cloud
The LiDAR and Imagery-based (photogrammetric) point clouds are similar because they consist of a point cloud containing 3D data points. The imagery-derived point cloud is typically output in LAS format and is processed much like LiDAR data. This point cloud can be further enriched (or “textured”) by assigning RGB and IR information contained in the imagery to each data point. In fact, if 4-band imagery is processed, it is possible to attach an Normalized Difference Vegetation Index (NDVI) value to each point.
While the photogrammetric-derived point cloud is comparable to one created by LiDAR, there are a few significant differences. A 3D point cannot be derived to a image pixel unless the same pixel is “found” in a second or third or N overlapping images. Imagery that contains scenes with very uniform texture (like fields of grass or corn, dense forest canopies, blacktop parking lots, dark shadows, etc.) cannot be modeled because the algorithms are unable to identify one pixel as distinct from adjacent pixels in one or overlapping images. These areas are often referred to as “texture-less” areas. The net result is that in “texture-less” areas, the point cloud will contain a void of points. However, because LiDAR is an “active” sensor (that is it emits light) and reflects off features (ground or surfaces), the texture of a scene much less frequently inhibits modelling of that area. Another strength of LiDAR is that each reflected point is returned with a precise coordinate location (X, Y, and Z) and does not require a second or third point reflected from the same object in additional overlapping images to determine its precise location.
Another type of limitation of points derived by photogrammetric means (SfM, SGM, traditional photogrammetry) is that they will model only the first returns or “surface features”. Points collected from LiDAR, on the other hand, can provide multiple returns, that is, the first return or surface of features, but also the surfaces under and within vegetation canopies. The authoritative information about the ground captured under canopies by LiDAR enables the creation of additional products like contours. Creation of an accurate ground surface model and contours in thick forested areas from the photogrammetric (SFM, SGM) point cloud is difficult or impossible because only the visible surface is modelled.
Another difference of LiDAR data is that it is directly measured, that is, light is emitted, and its reflection is sampled. LiDAR is not subject to potential issues associated with photo quality and photo processing that can affect the quality and accuracy of the vertical component of vertical points derived using the other methods.
Recently an exercise has been performed in which data was collected using conventional LiDAR, UAS LiDAR, UAS (fixed wing, multi rotor) and the point cloud derived from sensors were analyzed for their characteristics. Figure 3 shows the LAS data obtained from UAS based LiDAR and UAS based imagery. In part 2 of this series, we will discuss important aspects of point clouds acquired from UAS and manned platforms and by photogrammetric and Lidar means.
References
Harwin, S., & Lucieer, A. (2012). Assessing the Accuracy of Georeferenced Point Clouds Produced via Multi-View Stereopsis from Unmanned Aerial Vehicle (UAV) Imagery.
Remote Sensing, 4(6), 1573-1599. doi:10.3390/rs4061573
Schwind, M. (2014). Comparing and characterizing three-dimensional point clouds derived by structure from motion photogrammetry (Unpublished master’s thesis). Texas A&M University Corpus Christi, Corpus Christi, TX.
Tully, M. (2015). Semi global mapping. Retrieved from https://bt.editionsbyfry.com/publication/index.php?i=258887&m=&l=&p=4&pre=&ver=html5#{%22issue_id%22:258887,%22view%22:%22articleBrowser%22,%22article_id%22:%222009269%22}
Widyaningrum, E., & Gorte, B. (2017). Comprehensive comparison of two image-based point clouds from aerial photos with airborne lidar for large-scale mapping: Door detection to envelope reconstruction. In The International Archives of the Photogrammetry, Remote Sensing and Spatial Information Sciences. (Vol. XLII-2/W7, pp. 557-565). [ISPRS ICWG III/IVb] ISPRS. DOI: 10.5194/isprs-archives-XLII-2-W7-557-2017