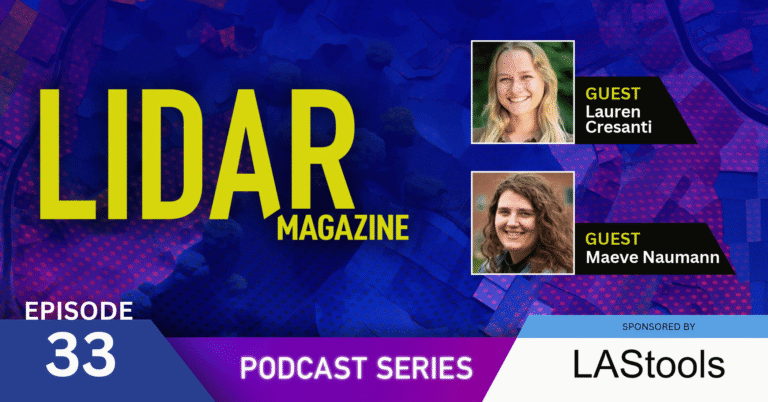
In this episode, we sit down with Lauren Cresanti (UAS Lead) and Maeve Naumann (Data Prep Lead) from the University of Vermont’s Spatial Analysis Lab (SAL). We discuss the wide range of applied geospatial projects the Lab supports—including disaster response, landslide tracking, vegetation encroachment, and urban tree canopy mapping. Plus, we explore SAL’s work within the ASSURE coalition (Alliance for System Safety of UAS through Research Excellence) and how they build drone capacity for first responders.

Episode Transcript
November 9th, 2026
#33 – Lauren Cresanti and Maeve Naumann
{Music}
Austin Madson – Host (00:07.658)
All right, hello everyone, and welcome to the LIDAR Magazine Podcast Series. My name is Austin Madson and I’m an associate editor at LIDAR Magazine. Thanks for joining us today as we continue exploring all of the many different applications of lidar remote sensing. We’re really happy to have the opportunity to sit down today and chat with Lauren Cresanti and Maeve Naumann at the University of Vermont’s Spatial Analysis Lab, or SAL.
Lauren Cresanti is the lead for the Spatial Analysis Lab’s unoccupied aircraft systems team. She joined SAL part-time in 2021 as a UVM student while working on her BS in Environmental Sciences and Geospatial Technologies Minor. After graduating, she moved into the UAS team lead position full-time, where in her current role, she coordinates with partners, clients, plans and executes advanced flight operations across multiple different platforms and sensors, processes and delivers geospatial data and also instructs UAS workshops.
Maeve Naumann is a member of the Spatial Analysis Lab’s mapping team, where she serves as the data prep lead. She began her work with the team in 2021 as a UVM student, similar to Lauren, while pursuing her BA in geography with a minor in geospatial technologies. She stayed on after graduating and joined the mapping team full-time and Maeve focuses on preparing complex and vast geospatial data sets, innovating new techniques for processing data, as well as using publicly available lidar data in support of the larger projects that the lab takes on. She also leads client communication on select projects and mentors technicians in processing data and the troubleshooting that comes along with that. So let’s dive on in. Thanks for joining us today, both Lauren and Maeve.
Lauren Cresanti (01:51.468)
Yeah, really happy to be here.
Austin Madson – Host (01:52.898)
Look, why don’t we start with Maeve? What what is the overarching mission of the spatial analysis lab? You know, how how does how does the lab facilitate geospatial learning on campus and and research on campus as well as external to your campus partners?
Maeve Naumann (02:11.416)
Yeah, so our lab is all about using cutting-edge geospatial technology to help people make better decisions for a better world. as well as we like to train tomorrow’s GIS workforce. And the lab’s been doing this, I think, 45 years as of this year. and so kind of that the story goes is that in late 1980, the University of Vermont’s School of Natural Resources acquired an ArcInfo Esri license. We’re actually one of Esri’s first 100 customers.
And the lab was then started by Gary Smith in 1981 using the ArcInfo license. And he began teaching GIS at UVM in 1983. And as I understand it, one of those big pushes for this work was to create a statewide geographically referenced database for Vermont and to really like speak to that mission statement of using cutting-edge geospatial technology to help people make better decisions for a better world.
And so today we’re honored to be a resource for GIS in the state, from other academic units within UVM to other universities, but also our state’s government agencies. We’re called upon others for our like or others call upon us for our processing power, our expertise, and also our workforce. We have quite a lot of technicians and students who work for us. and we’ll do things from QA/QC and editing lidar for our state agencies to local companies but also to researching how publicly available lidar could benefit others in our state. And so we teach classes and courses of all kinds.
We do guest lectures for university classes at UVM, but for other universities as well in the state. We’ve even done some year-end study programs for the local high school and of course some first responder work using UAS, and so a lot as I understand, a lot of courses for ASSURE, which Lauren will be able to talk more about; but within the lab itself, we kind of think of us in two halves. We have our mapping team that I’m a part of, and then we have our UAS team, which more is a part of.
Austin Madson – Host (04:15.394)
Yeah, that’s really cool, Maeve. Thanks for giving us the background on the spatial analysis lab. I didn’t realize it was such a ingrained institution at the university in the state. It’s really cool. And so I’m really curious how both of you landed at SAL. So why don’t we pop over to Lauren? What is your role there really and what do you enjoy about it?
Lauren Cresanti (04:39.394)
Yeah, yeah. So thinking back to when I got started, I was a second year student at UVM and I came across an internship opportunity to work with the UAS team at the SAL over the summer. And I had no exposure to UAS or drones before then, but knew that it would be really exciting and something different and challenging. And what I liked about it then and what I like about it now still is that I really get to see all ends of the workflow.
So from prepping for the flight operations to going out and collecting the data in the field, getting back to lab and processing it, and then handing it over to our partners and stakeholders and learning about how they use that data for decision making. So I really like having a range of projects to work on, whether it’s stream erosion, snowpack monitoring, invasive species, just so many different applications for this UAS data is really exciting.
And then at my current position, I do get to mentor students and new team members. And that’s a really exciting part of my job is to be able to work with people who are learning and discovering these tools for the first time as well.
Austin Madson – Host (05:54.188)
Yeah, that’s really cool. It’s always fun to work on applied work and to also help kind of guide the next generation of geospatial scientists. It’s really rewarding. What about you, Maeve?
Maeve Naumann (06:06.132)
So kind of similar to Lauren in some ways. I took my first GIS class actually in 2020 and loved it so much I became really quickly obsessed with the technology. so I started as a mapping corrections technician in 2021 for the spatial analysis lab. And I was doing what we call circling trees, so some of that manual editing of our data sets; and after I graduated that spring in 2021, I was offered an opportunity to work for the data prep team and I’ve been there ever since and I now kind of lead the team. And honestly, what I really enjoy about it is the problem solving aspect of my work and thinking creatively of how to deal with different problems and issues.
That and I think lidar point clouds are just beautiful in like an artistic sense, but also in their versatility and utility, even their like temporal aspect. Like in a way I think I’ll be able to show my grandkids the world I live in now through lidar point clouds, and I expect like, you know, the technology is just gonna get better and better. So the point clouds I show them of this time period now are probably gonna be like akin to like grainy, black and white photos, right? But still at the same time it’s just so cool to be able to show that 3D landscape in different time periods. Just a little bit of a light on that, honestly.
Austin Madson – Host (07:21.559)
Yeah, I think that’s great. I think a lot of us are at heart. And so we’re really glad that you found your calling. It’s fantastic. So let’s I want to pop over to Lauren and talk a little bit about what ASSURE is. And so a lot of our listeners may not know what this is and may not know that there are there are different facilities across the country that are kind of assure certified, if I am am understanding everything correctly. So Lauren, what really is ASSURE and, you know, what does the UVM SAL’s membership help facilitate? You know, and how does your work at SAL fall in line with other members in this alliance?
Lauren Cresanti (08:08.182)
Yeah, yeah. So the University of Vermont is one of over thirty members of ASSURE and ASSURE is the FAA’s Center of Excellence for UAS research. So the Federal Aviation Administration Center of Excellence for UAS Research. And this consortium of over 30 institutes, they all provide research and support into helping to safely integrate UAS into our national airspace so it’s the idea of all of these different institutes with a wealth of knowledge coming together to develop best practices and research and protocols for how to operate UAS. And our university so far has been involved in a lot of that work with disaster response. So thinking about how can UAS be safely used and efficiently used during disaster response or other public safety efforts.
And some of the work that we’ve done, kind of going beyond just research and writing reports, is really actual collaboration with other stakeholders in Vermont. We’ve hosted tabletop discussions and mock exercises with other groups to try and work out what can we do better with integrating UAS, what’s working well, and figure out how to kind of move forward in a way that’s not only helpful in Vermont, but kind of all-encompassing and can be integrated by other institutes as well. so that’s kind of a the big picture of Assure, but within Assure is ASSUREd Safe, which we work with as well. And with ASSUREd Safe, we help to develop and then facilitate UAS training courses for first responders. So we’re creating content and teaching hands-on flight operations.
To folks in the public safety and first responder field to learn how they can use UAS, how they can start their own program. So that’s been really exciting to be a part of over the past couple of years. We host courses at UVM, but we also do training courses where we’ll go to different locations that request it and have that need. So I think the really big benefit of UVM being a part of this consortium is that we have a lot of expertise in that geospatial side. So we are kind of really shine with doing automated mapping missions with our drones and producing geospatial data that’s accurate and precise for measurement making. So it’s been really great to be able to integrate that knowledge and expertise into our research and training for ASSURE and ASSUREd Safe.
Austin Madson – Host (10:52.844)
Yeah, that’s really cool. When when’s the next FEMA training that y’all are hosting and where is it?
Lauren Cresanti (10:57.814)
Yeah, the next FEMA training is in Oriskany, New York, actually in a couple of weeks in December. So we’ve been there before and we’re excited to return.
Austin Madson – Host (11:07.726)
Cool. Are they geared at certain things? Like so the one in New York is that is that photogrammetry based? Are you kind of running the same workshops and trainings for all of these females?
Lauren Cresanti (11:20.92)
Yeah, we’re running the FEMA intro to UAS for emergency response level one and then in a UAS for emergency response level two. And those courses have a few different modules, some of them focusing on flight operations, some of them focusing on photogrammetry, mission planning. So kind of that end-to-end workflow of how why are UAS valuable, when and how can you use them, and what to do with the data. So those are courses we’ve developed for FEMA and are offered for free to folks.
Austin Madson – Host (11:55.862)
So cool. So if you’re if you work for FEMA or if you’re a state or local agency, can what can how do they reach out and schedule these things?
Lauren Cresanti (12:04.322)
Yeah, you don’t even have to work for FEMA. You just have to kind of be interested in the content and the material. And when we have upcoming courses, they are posted through ASSUREd Safe. So UVM is just one of the many institutes that trains these courses through ASSUREd Safe. So definitely check out ASSUREd Safe’s website for the upcoming courses across the US.
Austin Madson – Host (12:29.198)
Cool, that’s awesome. Yeah, I had really no idea about ASSURE and I’ve been in this space for a little bit now. So hopefully our listeners will now know what this is and where to go to learn more about it. Yeah. Thanks, Lauren. Let’s talk about some of the interesting projects that y’all are working on at the spatial analysis lab up in Vermont. Let’s pop over to Maeve. Maeve, can you tell us a little bit about what this SOLVER project is and you know what is it? What data does it use and and who’s it for and what are the end goals?
Maeve Naumann (13:06.166)
Yeah, so SOLVER is an acronym stands for System Optimization and Lidar for Vermont Energy Resilience. So kind of the outcome output product is really trying to better understand Vermont’s electrical infrastructure and the energy infrastructure that Vermont has. It was a two part project. So it was us and another lab on campus. Our task was to research using a public good; so in this case, the 2023 statewide 3DEP lidar that was collected for the state of Vermont; we were trying to use that lidar data and to extract the power line infrastructure from it. Our local utility companies spend quite a lot of money on getting lidar scans of their electrical infrastructure every year, especially to monitor the vegetation encroachment.
It seems like vegetation encroachment is one of the bigger things that they have to manage and so what we were or yes, so our task was to kind of research and try to take the lidar and see if we can make it usable for them. unfortunately though, in our research, we discovered that the lidar collect didn’t have consistent capture of the electrical lines in the state. Like it was really good at getting some of those transmission lines, but some of the distribution lines in neighborhoods not so much.
And so we pivoted. So we asked the local utility companies to send us their GIS line data sets. And then we buffered those and we mapped every tree within that buffer. And we were able to give useful attributes to those trees, such as tree health. So we looked at NDVI and looked to see if that tree was healthy or not based on some past imagery. But also we were did like a height calculation to see if that tree fell toward the line, would it hit the line? And so using those attributes, we were able to create a risk matrix for the risky trees that are near power lines. And so the part two of the project, we handed over that like list of risky trees to another lab on campus. It was from the College of Engineering Mathematical Sciences, the Create lab. And what they were doing was they were modeling and creating simulations of Vermont’s electrical grid.
Maeve Naumann (15:21.654)
And so they were able to simulate what would happen if one of those risky trees fell on the line and see how just how many people would be out of power, really able to like with that work, they’re able to simulate what would happen in storm events and that sort of thing. And one of the more cool I don’t want to say cool, but findings that they had was that if there a tree fell, like it was close to a substation on South Hero, like half the island would be out of power.
So they’re really able to kinda like figure out, okay, we actually really need to manage the trees around this area because those would make the most amount of people out of power if a storm on that were to happen.
Austin Madson – Host (16:02.796)
Yeah, that makes a lot of sense, Maeve. What about so if you’re you had to pivot to kind of monitor vegetation health and flag trees that way. What remotely sensed data d that did you use and what spatial resolution was it?
Maeve Naumann (16:18.744)
We used the lidar data. We just used the tree data instead of the line data that was partially there. so yeah, we and we used I think I made like 0.35 meter surface models for this work, as well as just using the actual point clouds themselves. before we pivoted, we did try to like use the Esri deep-learning tools for like getting those partial electrical features. I even had some technicians like manually classify the whatever fragments they could find and then tried to train the model further on that, but we didn’t get a huge amount of success.
But yeah, it was I think pretty, really fine scale lidar surface models that we used. I think especially I used the lidar surface models for evaluating how well the AI tool was doing. So as creating these surface models and showing, okay, after this many training sessions, did it do better as compared to the manually classed? It never really got that good. So we did pivot eventually to it to using the lidar for mapping the trees.
Austin Madson – Host (17:27.776)
I see, yeah. So y’all I guess I’m still a little confused. So when you’re getting at the vegetation health of the tree, you didn’t use kind of normal vegetation indices or anything. What approach did you use?
Maeve Naumann (17:42.2)
So for vegetation health we use imagery, just the like four band aerial imagery, but in terms of the tree height we use lidar data.
Austin Madson – Host (17:51.436)
Okay, so you use the nape, which is pretty high, high resolution.
Maeve Naumann (17:55.094)
Yeah, and I think we were able to use some orthos in some areas, but I’m not I think the nape was the more consistent across the state data set.
Austin Madson – Host (18:01.934)
Totally. Okay, cool. So you hit some snags on the way, but ultimately the project worked out well. I think it was it’s really interesting to have that bi-fold approach, right? Where you’re you’re marking these these trees as suspect and then the secondary lab went out and and modeled the effects of if that tree fell in the line and and how many people would be affected, I think is really novel.
Maeve Naumann (18:25.974)
Yeah, I think it was quite the taking up part ’cause I think every electrical company in the state used different systems for their own engine you know, so they had to like could mm create like a cohesive simulation from a bunch of different formats. they did some really great work with it too. So it was really an honor to be able to work with them and also the local electric utilities, you know, in some ways I was kinda like, hey, does this mean I could get like a little bit off my power bill for doing this work for you guys? You know, but it all it all works out.
Austin Madson – Host (18:56.588)
Okay, cool. So why don’t we pop over to Lauren? I know your team is working on some really interesting landslide and mudslide projects for the state’s geological survey. Can you talk a little bit about that?
Lauren Cresanti (19:07.01)
Yeah, definitely. So over the past few years, we’ve actually been involved in surveying quite a few different landslides. So back in 2020, I believe it was, there was a rock slide at Smuggler’s Notch, where some pretty large boulders and debris came down and damaged a vehicle. And in the years following, our lab and our UAS team went to the site and collected data.
This was primarily true color imagery and lidar data. And again, now we’re talking about drones. So this much smaller scale, very high resolution in real-time collection to be able to better understand the conditions. And so we collected data during leaf off conditions when we could get that better penetration through the canopy and the leaves to the rock face and pass that data along to our state geologist.
And since we were able to collect data multiple years in a row, they could do actual kind of temporal comparisons and see where there any shifts, changes, anything risky about that site, was there going to be potentially another rock slide? So that was a very exciting project to work on because if anyone’s ever been to Smuggler’s Notch in Vermont, it’s quite an impressive landscape. And so being able to fly a drone there and collect high resolution data was great.
More recently, we’ve been visiting Cottonbrook landslide. I was actually there last week and will be returning tomorrow. Cool. And the data collection was pretty similar. So true color imagery and lidar with our UAS. And again, we have collected there a couple years ago and are now doing another collection. So the geologist will be able to use those data sets to compare and find any, you know, shifts or concerns in those areas.
Austin Madson – Host (21:04.62)
Yeah, that’s cool. What do you know what post processing they do on the data to look for displacements?
Lauren Cresanti (21:11.33)
Yeah, that is a great question. I know that there are some papers out there about what they’re doing, but we have the we provide a point cloud as well as a digital elevation model and digital surface model. And we do some manual edits to make sure that those elevation models are reflecting kind of the bare surface, no vegetation. So I know that they use a combination of the point cloud in the models.
I don’t want to guess too much about what that entails, but I’d assume probably some differencing to see if there has been anything, you know, that’s moved since then. but hopefully maybe I can track down where those papers are and and share those as well.
Austin Madson – Host (21:56.044)
Yeah, that’s cool. I did some landslide work years ago in southwest Colorado and one method we used was to actually generate multi temporal hill shades and then run those hill shades through pixel tracking algorithms to to get the distance and direction of displacement of those pixels from from their shadows that were cast from from the light source. But lots of different methods to do it. But yeah, landslide work is really neat. So I’m glad y’all are.
Glad y’all are you know, helping facilitate some of that important work. Thanks, Lauren.
—
The LIDAR Magazine Podcast is brought to you by rapidlasso. Our LAStools software suite offers the fastest and most memory efficient solution for batch-scripted multi-core lidar processing. Watch as we turn billions of lidar points into useful products at blazing speeds with impossibly low memory requirements. For seamless processing of the largest datasets, we also offer our BLAST extension. Visit rapidlasso.de for details.
—
So what let’s pop back over to Maeve if I if my understanding is right, I think the spatial analysis lab undertakes a lot of different what y’all call urban tree canopy assessments. What you know, what are these and you know h how do people approach you to get them done and how are they unique from from one another?
Maeve Naumann (23:22.776)
So yes, urban tree canopy assessments, we do a lot of those. we kind of call it the mapping team’s bread and butter, so to speak. I believe we actually helped the Forest Service kind of write the book on how to do these. and I think I think it’s like probably a couple hundred of them over the past like couple decades of that we’ve done. And we’ve mapped a lot of communities several times, including Boston and New York City. And one of those more important inputs for this work is the lidar data that we need. so typically the urban tree canopy assessments are commissioned by city, county, or statewide government agencies, although we’ve also had some conservation agencies work with us. And what we provide is data about the area’s trees by making highly detailed land cover and tree canopy change data sets. And when I mean highly detailed, I mean zero like half foot to one meter resolution like pixel level data sets.
And what these data sets tell us is how much tree canopy is grown, what areas have the most or the least, where you could potentially plant more trees in that there’s not a hard and pervious surface there and there’s a different kind of vegetation type. And kind of remember what Jarlath used to say is that data is power when it comes to this sort of things. Folks are able to advocate for, you know, tree planting initiatives and urban forestry plans once they have statistical data in their hands.
You know, just similar if you want to make changes to your pol local police department or fire department, you want to have the data to bring to those council meetings to then say, hey, let’s do this work. and so trees are more and more being seen as like a public good. they’re known for lowering temperatures, cleaning the air, and provide mental health benefits to municipality citizens. So it’s really important information for a lot of governments to have.
And yeah, lidar is one of those really, really important inputs for us because it gives us that more accurate tree height information more than imagery ever could. and so we’ll use like we’ll make our own custom lidar service models and we’ll classify and normalize point clouds from publicly available sources, often USGS 3DEP data, but sometimes lidar will be provided to us from a client…
Maeve Naumann (25:44.546)
…and I think kind of what really allows us to do this work is our lidar processing infrastructure. It’s instrumental in some of our like statewide projects, or in the case of we had a Chesapeake Bay watershed project, which was a lot of tree canopy change and land covered data sets that we did for them. but so we use our own little lidar processing code base. It’s called lidar data prep, and it was developed by a team member, Terry Barrett and it’s actually open to the public on our lab’s GitLab. But what this code base does is it let you link it lets you link together individual tools from LAStools, ArcGIS, and some customized FMU workbenches as individual steps. And then you’re able to have this like really big workflow with all of these individual little steps.
I think on average it’s around 35 to 45 individual steps for processing all the data products we need for urban tree canopy assessments. and yeah, and we’ll do some other work in terms of analyzing the tree data. So we’ll be able to be like, hey, this neighborhood has this amount of tree canopy, and this neighborhood has this amount, or council districts, or we’ll analyze it by census blocks, census tracts, whatever kind of questions the client has.
We’ll use what we call geography data to then try to figure out those answers based on those data sets. So I think in particular, Boston has an urban forestry plan that they’re really curious to see if the area that is delineated in is part of their plan is working. So one of the data sets they had us analyzed was like a little polygon around the area that they’re focusing and planting their trees.
Austin Madson – Host (27:27.372)
Yeah, that’s really neat. And so do you have a favorite one of these that you’ve worked on? ‘Cause I assume you’ve worked on, you know, well over a dozen.
Maeve Naumann (27:36.734)
Yeah, I think I’ve worked on over like 70 projects the past few years here at the lab and I think at least half of them were definitely urban tree canopy assessments. I think honestly it’s kind of cool being able to see the world through my job in a way. And so it’s cool to like go to other locations. So we’ve been doing some work for Honolulu and Guam, and so it’s been really cool to see try to measure tree canopy in terms of palm trees versus your typical tree you might find on the east coast or anywhere in the US.
But yeah, I mean, other than that, I think some of the other international urban tree can be tests we’ve done are also cool. We did one for the Ottawa Capital region. So like a bunch of the area around there. And I think that was one the more higher resolution data sets we’ve done so far. It took my analysis processing software like a week to process. It was a lot.
Austin Madson – Host (28:32.322)
Yeah, that that’s really that’s really neat. And it’s fun to know that the projects that you work on, you know, can affect policy or at least in theory in in some small way.
Maeve Naumann (28:41.932)
Yeah, it’s you know, it’s more about putting the data out there and letting people do what they need to do with that data, make better decisions with that data.
Austin Madson – Host (28:49.614)
Totally. Yeah. Thanks, Maeve. Let’s pop back over to Lauren and talk a little bit more about some of the other disaster response work your team has undertaken. How do these come about? You know, how fast does your team mobilize and what are some example projects?
Lauren Cresanti (29:07.948)
Yeah, yeah. So as of now, although the university doesn’t have an official standing in the emergency operating center or EOC, we have been requested and tasked with deployment for some different types of disasters that Vermont has faced over the past couple of years. So most notably in twenty twenty three and twenty twenty four, there was major flooding in the states because of rainfall and heavy storms. So we were asked by the Vermont Agency of Transportation and eventually other geologists and natural resource groups to go out and collect UAS data that could help see the current conditions as well as work on recovery and resiliency efforts. So for the flooding, I think it was the morning of kind of those peak flood levels that
It was really starting to become obvious that this was a a big deal. And we were mobilized within just a few hours. Really, it just takes charging some of the drone batteries, getting together a team, and then understanding where we are most needed to be able to get out and deploy. So we split up into different teams, each took a couple of drones and headed out. And we used different resources to figure out the best access.
To those sites, sometimes had to go around, you know, the long ways due to bridges being down. And then once on site, it was really a combination of collecting imagery for high watermarks and then collecting lidar for things like infrastructure damage, erosion, and even rock slides, landslides, and mudslides. So there was a lot of imagery collection at first, but really lidar was crucial when it came down to understanding how to recover from fixed infrastructure and monitor different landslides and erosion, things like that.
So that happened in the summer of 2023 as well as 2024. So that was a really big effort from the UAS team and the rest of the members of the SAL who are able to deploy with us and help out, even maybe with limited experience but being on site and being able to support those efforts was was really valuable.
Austin Madson – Host (31:29.078)
Yeah, that’s cool. Go ahead, yeah.
Lauren Cresanti (31:31.984)
Besides flooding, there’s also been a few other types of disasters, such as wildfire response that we’ve been a part of. So there is a task force, urban search and rescue, and state hazmat, who all kind of work together and have some overlap. They have a drone program, but it’s a bit newer and up and running. So they’ve requested our support for wildfire response, and we’ve been able to collect imagery and data to help with that as well.
Austin Madson – Host (32:02.894)
Cool. For the for the wildfire response, Lauren, is that is that thermal data? Are you going out during active fire events or these is this kind of post fire analysis?
Lauren Cresanti (32:12.972)
Yeah, it’s been thermal so far going out during the fire events, just true color for a visual as well as thermal to detect hot spots. so so far we haven’t gotten into kind of that post-recovery with lidar, but I definitely see how that could be a potential in the future as well. Some of these burns cause trees to fall down. There’s definitely a change to the environment. So that would be something I’d be interested in seeing how lidar could help support that in the future as well.
Austin Madson – Host (32:43.554)
Yeah, cool. Really, really cool response work, yes. So starting to learn that the SAL is really quite varied and not, you know, a typical academic research centric lab, which is which is really unique and fun. Let’s why don’t we pop over to Maeve again. Maeve, can you talk a little bit about some of the labs work that y’all are doing and have done in collaboration with Tukman Geospatial out out in California?
Lauren Cresanti (32:58.392)
Mm-hmm.
Maeve Naumann (33:11.808)
Yeah. So in a few the so yeah in in the more recent years we’ve been taking more and more impervious surface work. We’ve been taking that on. we have a couple of like statewide projects in the works, but I think one of the I think the more coolest impervious work that we’ve done is the work we that we’ve done with Tukman Geospatial, who are out in California. We’ve done quite a few counties with them, but we are currently working on another five which was quite a lot of lidar to wrangle. I think it was upwards of like 30,000 point clouds we had to process for that project. But yeah, we used the lidar data to update and edit the road data that they have or what’s publicly available, as well as make impervious surface data sets that they then use in their vegetation, fuels, and forest structure work.
So their data sets are used for land management and using and understanding and handling wildfires and their risk to communities. They also make what they call pre-attack maps for cow fire that give firefighters that important information on where they can drive, where they can get water, where dozer lines have been previously cut. and our impervious data that we provide to them is one of those important inputs for that work. And so it’s really cool that like through them we’re able to also do some wildfire help out in California, but we’re specializing more in just the important service aspect of it.
Austin Madson – Host (34:38.7)
Yeah, that’s cool. The county sizes in California are pretty different than the county sizes in Vermont, huh?
Maeve Naumann (34:46.71)
No, definitely. I think I think what I think some counties are probably similar to the size of the whole state of Vermont. It’s quite a lot for my data processing infrastructure. we’ve actually started to use the university’s Linux cluster in order to start processing the lidar because the lidar just keeps getting bigger and bigger in size.
Austin Madson – Host (35:07.192)
Yeah, more density, you know, uses up all of your RAM.
Maeve Naumann (35:12.62)
So quite a lot of RAM. Some of the jobs I request, I think, have like two hundred fifty gigabytes worth of RAM. I don’t have a actual physical computer that has that amount of RAM. I have one that’s like half of that.
Austin Madson – Host (35:23.926)
Right. Yeah. And RAM is hard to come by these days too, don’t forget.
Maeve Naumann (35:27.979)
Yes, it is. Our university’s Linux cluster is quite lucky to get some upgrades when they did.
Austin Madson – Host (35:33.004)
Nice. Okay, cool. Yeah. Thanks for filling us in there, Maeve. Let’s pop back over to Lauren and talk about some of the aquatic invasive species work and and forestry work that that your team has done.
Lauren Cresanti (35:47.904)
Yeah, I’ve been heavily involved with those type of projects over the past couple of years. my first introduction to forest train invasive work was actually a project for my undergraduate thesis. So we were looking at the defoliation caused by spongy moth in a community forest in Monkton, Vermont. And this was kind of a pet project where one of our colleagues lived in that area and noticed
in their backyard, basically that in the middle of the summer the trees were bare. So we thought we’d investigate what that was and how drones could help provide insight. So we collected true color imagery, multi-spectral imagery, and lidar of the forest during June, July, and again in August of that year when the spongy moth was causing that defoliation of the vegetation. And it was really powerful to see not only defoliation, but then recovery from it using high resolution drone data. So we used the different spectral bands to look at the health of the trees remaining.
And then the lidar data was really useful for looking at the canopy structure and how that changed and recovered over time. So that was kind of my first introduction, but since then we’ve worked on a lot more forestry projects, some in the kind of leaf-off time period so that we could see down to the forest floor. But then also interestingly collecting during leaf-on conditions. So one project with Tony D’Amato, a UVM professor, is going and collecting leaf-on lidar in the summer at some different research plots in Vermont and New Hampshire. And that lidar will be used to investigate the canopy structure and bird habitat actually.
So that was really exciting to be able to do lidar collection during the summertime. We’ve also been tasked with collecting lidar and imagery of forest stands that are impacted by beach disease. So that was in collaboration with another university. And similarly, we collected imagery and multi-spectral imagery and then lidar and produced those same kind of different point clouds and elevation models and NDSMs to get the height of the trees, the health of the trees and pass that along for their further analysis. And another type of forestry project we’ve done a lot of work with is maple sugar bush mapping. And that’s been in collaboration with UVM Extensions Forest Business. So we’ll go out to these different either active forestry kind of sugaring locations or those that are trying to get up and running.
And collecting this data helps provide insight into where they could place saplines or where there might be stands of water or which trees are healthier than others. So kind of all of this insight to help decision making around successful maple sugaring businesses. And then to talk a bit about the aquatic invasive species. That’s something that we’ve worked on for the past couple of years for what’s called NIAPS or non-Indigenous Aquatic Plant Species Project.
And we would collect at a couple of different sites around the Lake Champlain Basin in Vermont and New York and do repeat visits where we could monitor the invasive plant species over a couple of different periods throughout the growing season. And then all of that imagery was input into building a model to be able to detect that species and quantify it. So this was actually a really cool cross collaboration between the UAS team and the mapping team at the SAW, where the US team collected the drone data and the mapping team used their expertise to build that model. So that was a very exciting project for us.
Austin Madson – Host (39:52.782)
Yeah, that’s cool. And I wanted to talk briefly too about because y’all’s work is so diverse in in on both of the teams that you’re on and I’m curious how how, you know, compliant some of your systems are, right? So if you’re working with the FEMA teams, are you not taking are you not taking DJI products, for example? You know, do you do you have a whole suite of of platforms and payloads that will allow you to work on these different projects under these different rules and regulations.
Lauren Cresanti (40:23.852)
Yeah, that’s a great question becoming very relevant these days. so what you described is pretty true. We do have a fleet of different platforms and sensors, some of which are compliant with NDAA, sometimes called on this blue list or NDAA compliant. And that essentially means they are able to be used for federally funded projects. So we have a couple of different multi-rotors and fixed wing drones that are NDAA compliant and we use those for the Forestry Project and our FEMA trainings and other opportunities to for other cases where the federal funding requires that. Otherwise when there aren’t any restrictions, we do have DJI drones as well as others that aren’t necessarily NDAA compliant, but still really reliable and trustworthy and helps get the data we need.
Austin Madson – Host (41:23.032)
Cool, yeah. Yeah, thanks Lauren. Before we wrap up, is there anything else that we didn’t hit on? You know, something that you want to revisit? I mean, we talked about tons of different projects and lots of the really cool work you all have done. So wanted to open this space up in case we missed something that that you wanted to talk about.
Lauren Cresanti (41:44.36)
Maybe one thing that comes to mind is you mentioned this before that you said you didn’t really realize kind of how unique of a a research lab we were. And I think that’s something that comes up a lot is that, you know, being at an institute, even though we are our research lab, our focus isn’t always on, you know, popping out papers and and journal articles that might, you know, sit on a shelf sometimes.
We do a lot of hands-on work with our students, real world training, getting experience for students and our project partners to collaborate. And I think it’s just really exciting that we focus on kind of experience for students, skill building for staff, and then really providing high-quality work to our community partners and stakeholders and feel like the work we do is making a very notable kind of difference with those people we work with and helping them to improve their decision making. So it’s really fun to work in academia but feel like we are having a r a real world impact at the same time.
Austin Madson – Host (42:52.662)
Yeah, that’s great. Yeah, thanks Lauren. Maeve, do you have any closing thoughts?
Maeve Naumann (42:57.164)
I might just add on to what Lauren was saying in that I think as I understand it, some of the lab stability has come from the fact that we do use grants, we do some grant work, but we also do a lot of income and expense. Like we have projects and contracts and that sort of thing. So we do both. And I think being able to lean one side to the other during different time periods really kind of helps and kept our lab stable where a lot of other labs might not have been as stable.
Austin Madson – Host (43:23.0)
Totally. Yeah it’s a it’s a really good point. Yeah. Well this has been really refreshing. That’s all the time we have for this episode. I wanna thank both Maeve and Lauren again for chatting with us today. As always, I hope listeners here were were able to learn something new. if you haven’t already, make sure to subscribe to receive our episodes automatically, you know, via Spotify or Apple Podcasts or, you know, whatever your poison may be.
Stay tuned for other exciting podcast episodes in the coming weeks and take care out there. Thanks for tuning in. Be sure to visit lidarmag.com to arrange automated notification of new podcast episodes, subscribe to newsletters, our print publication, and more. If you have a suggestion for a future episode, drop us a line. Thanks again for listening.
—
This edition of the LIDAR magazine podcast is brought to you by rapidlasso. Our flagship product, the LAStools software suite, is a collection of highly efficient, multi-core command line tools to classify, tile, convert, filter, restore, triangulate, contour, clip and polygonize lidar data. Visit rapidlasso.de for details.
{Music}
THE END