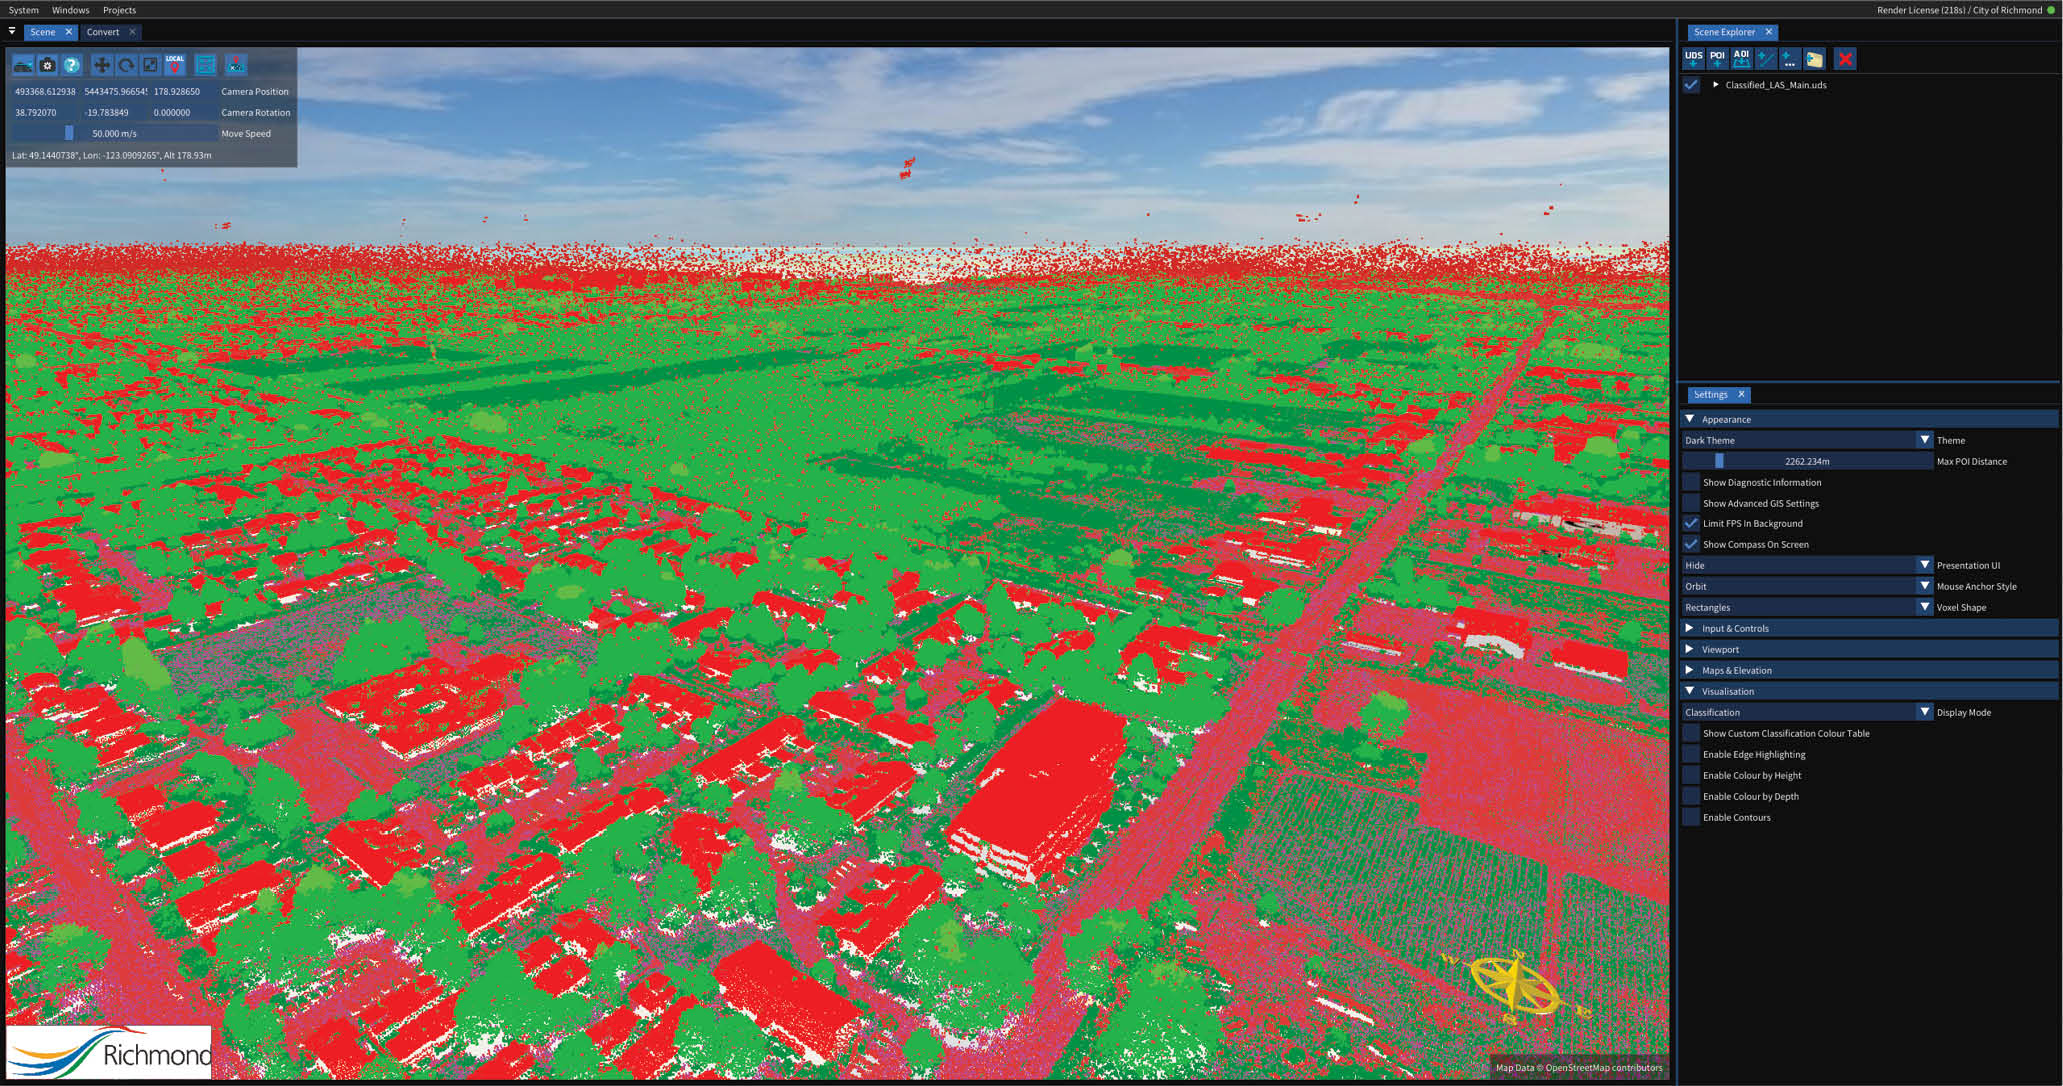
The City of Richmond, Vancouver as a 3D dataset in Euclideon Vault software, colored by classification.
While hailed as one of the great achievements in modern survey and measurement technology, lidar has long been hampered by the very product it creates. Huge data sets, representing information gathered, have resulted in extremely long periods of post-processing and an end-product which, while impressive to view and manipulate in small sections, has often been too large to be viewed in its entirety without expensive workstations. This was the issue facing the City of Richmond, British Columbia, Canada, as it worked to move its GIS effort—which included monitoring of the city’s 47 km long series of dikes—forward. Faced with a staggering amount of data and only a limited capability for viewing it, the city turned to an Australian software development firm whose claims for handling massive data sets seemed improbable at best—but ultimately proved even undersold. Today, thanks to that solution, Richmond is able to view photorealistic 3D point cloud renderings of the entire city; can “fly” its way through those images from a standard, off-the-shelf laptop; and sees applicability in a range of areas. The developer calls its solution “VAULT,” the city calls it a game changer.

Classification Color Table
Bayou Nord
Like New Orleans, Louisiana, to the south, Richmond is a river delta city located on a flood plain. Situated just 1 m above sea level, it is encircled by dikes to keep the waters of the Fraser River at bay during times of flooding and as the effects of climate change become more prevalent. According to Michael Bleidistel, the City’s systems analyst (GIS), their GIS effort has been in place for some time now but has taken some serious turns of late.
“For decades now, we have maintained a solid GIS effort, primarily for asset management,” he said. “Like any city, we are constantly renewing and upgrading our infrastructure to ensure that the quality of life for Richmond residents is made better. To that end, the engineering department gets 2D drawings from our survey people and turns those into actual features on the ground. Areas such as sewer and water, drainage and so on benefit from that.”
The importance of Richmond’s GIS effort is made even clearer when one considers its geographic situation. The island on which the city sits, Lulu Island, is surrounded by a series of dikes which must be regularly monitored for condition and wear. Unfortunately, doing so had previously consisted of dealing with mostly 2D data—photographs taken from boats, for example.
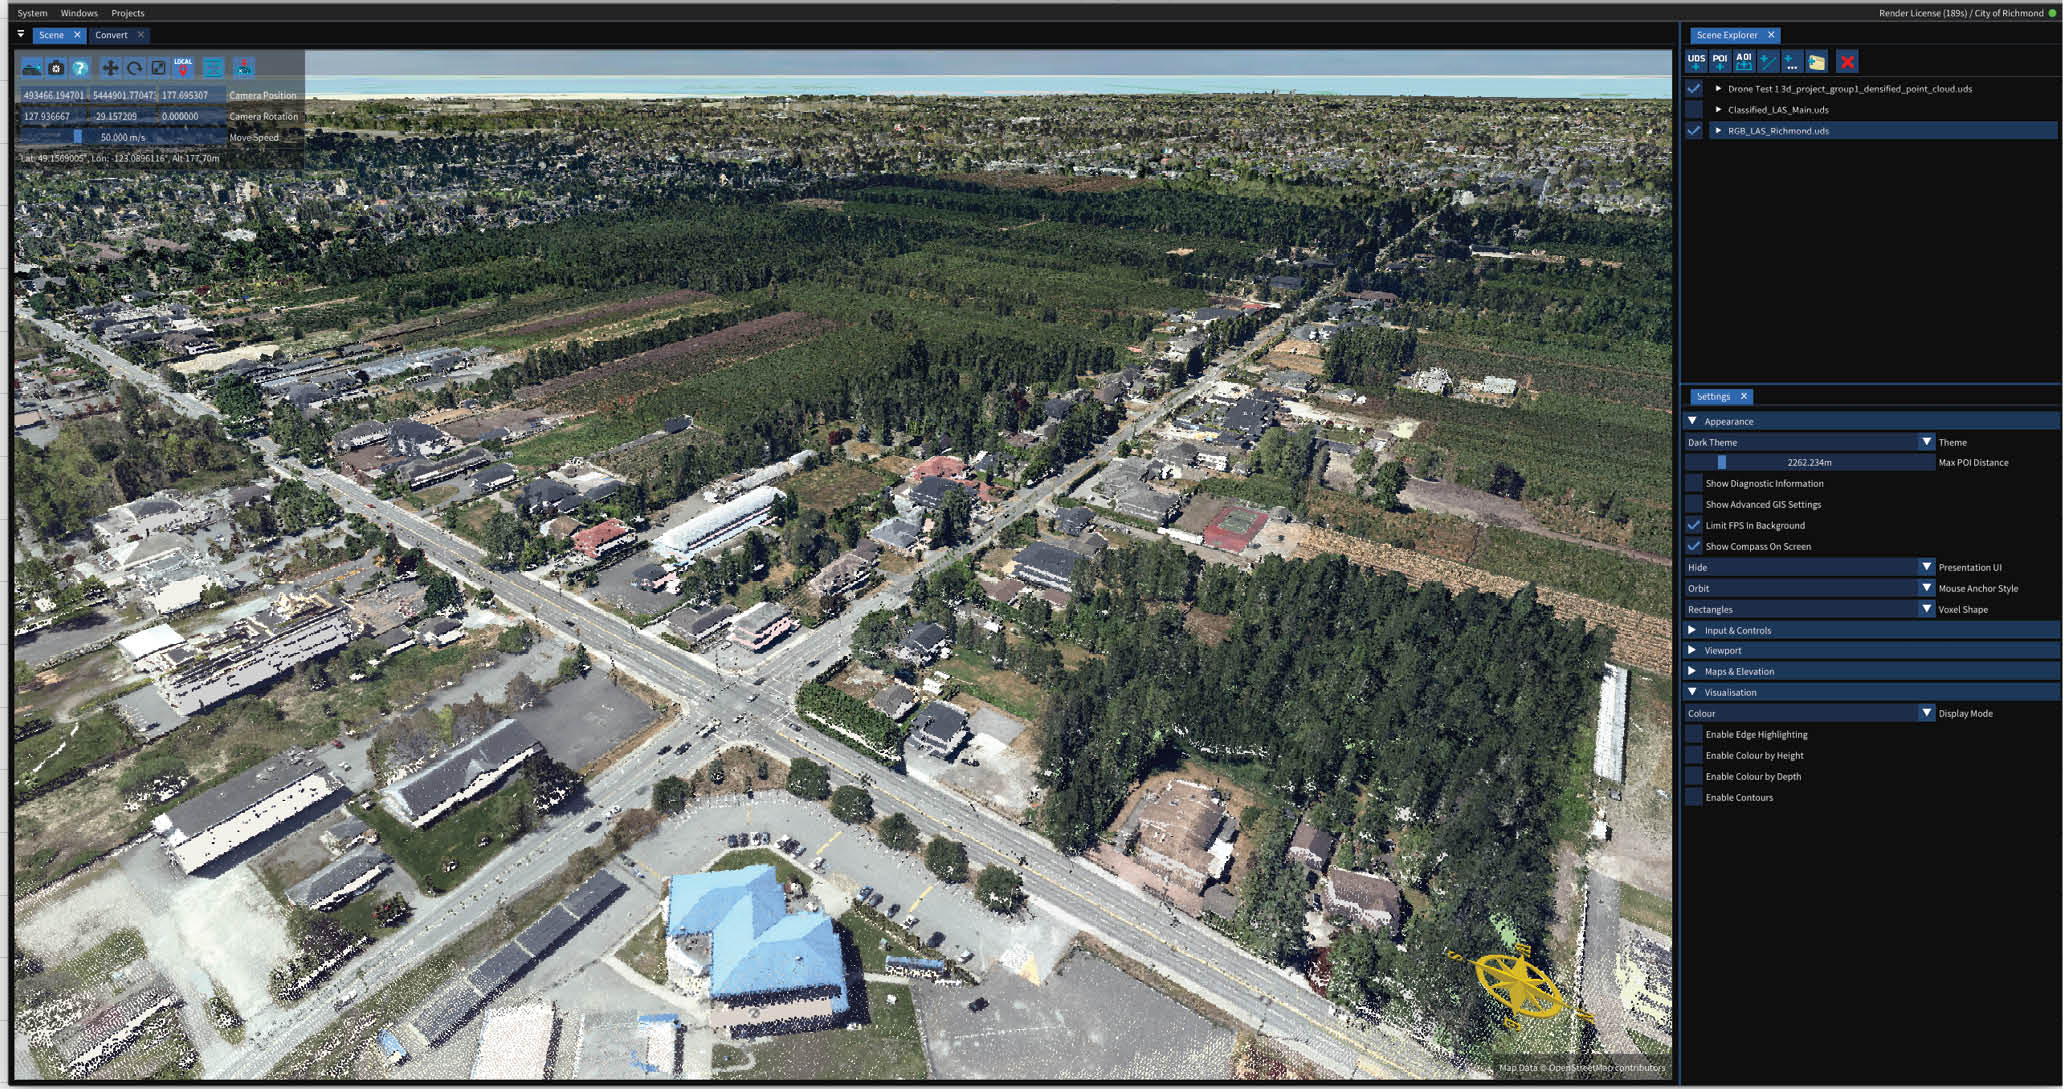
A high resolution color lidar scan of the City exceeding 1TB in file size, which can be viewed in under one second using Euclideon Vault.”
“For the last few years, however, geospatial providers such as McElhanney and EagleEye have been flying the metro Vancouver area and providing us with aerial photos or lidar data of our region,” said Bleidistel. “While the photogrammetric data was great to have, it was barely useable because the data sets they created were so large. And while we could cut the lidar data into smaller sections to allow conventional software such as ArcScene or ArcGIS Pro to load it, doing so meant we were missing the ‘big’ picture. We needed to change that.”
A Different Approach
Bleidistel said that, for a couple of years, he had been following the projects on which Euclideon had been working. While some of it was not immediately applicable to the needs of GIS people like himself, he saw where things were heading and was definitely intrigued.
“Much of Euclideon’s efforts were related to improving the look of video gaming backgrounds and environments through the use of what the company calls Unlimited Detail Technology,” he said. “However, about a year ago, they announced that they’d applied the benefits of that technology to GIS-related 3D modeling. Since we were getting all these large-volume data sets from the geospatial providers and were largely unable to work with them, that definitely got my attention. So, I reached out to them and arranged to get a license.”
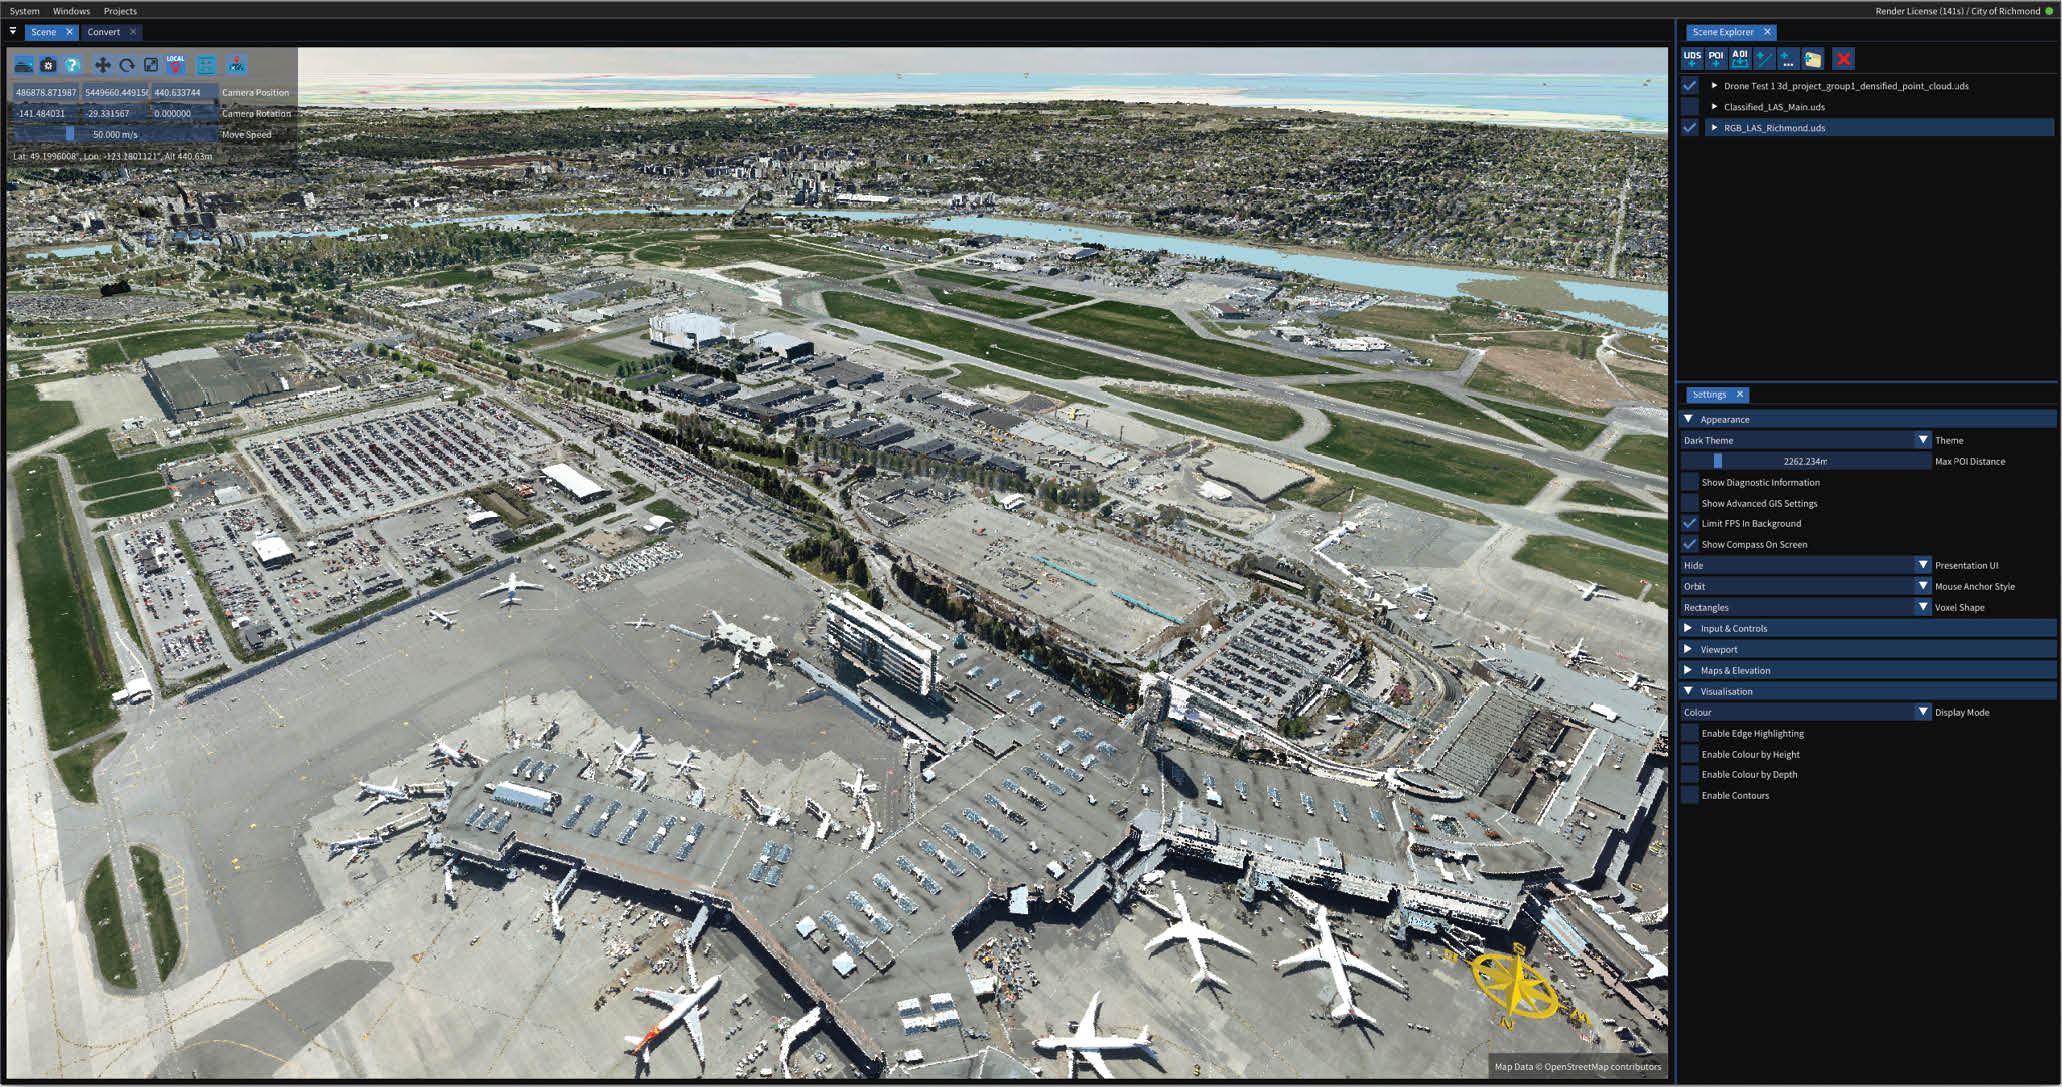
Euclideon Vault allows live IoT data feeds of the Richmond airport to be projected onto their geo-located 3D model.
At the heart of Euclideon’s VAULT solution is a 3D search algorithm that can render unlimited quantities of point-cloud data in real-time. Because this algorithm efficiently grabs only one point for every screen pixel, it can display models of previously unimaginable sizes—at interactive frame-rates—without the need for a powerful CPU or graphics card. A spokesman for Euclideon explains it :
“Consider Google which, basically speaking, is an extremely powerful 1D search algorithm used to look for words on the internet,” he said. “When someone enters a phrase, it looks as though Google has read the entire conglomeration of all human knowledge in less than a second, and then offers a list of where to find such things. That is the power of search algorithms. Our technology employs a 3D search algorithm that looks for little atoms, and only wants one of them for each pixel on the screen.”
Decidedly Denser Data
The approach being taken by Euclideon appealed to Bleidistel not simply because it was able to efficiently tackle mega-files, but also because he knew that, with the processing bottleneck removed, the quality of data they could handle would be vastly improved.
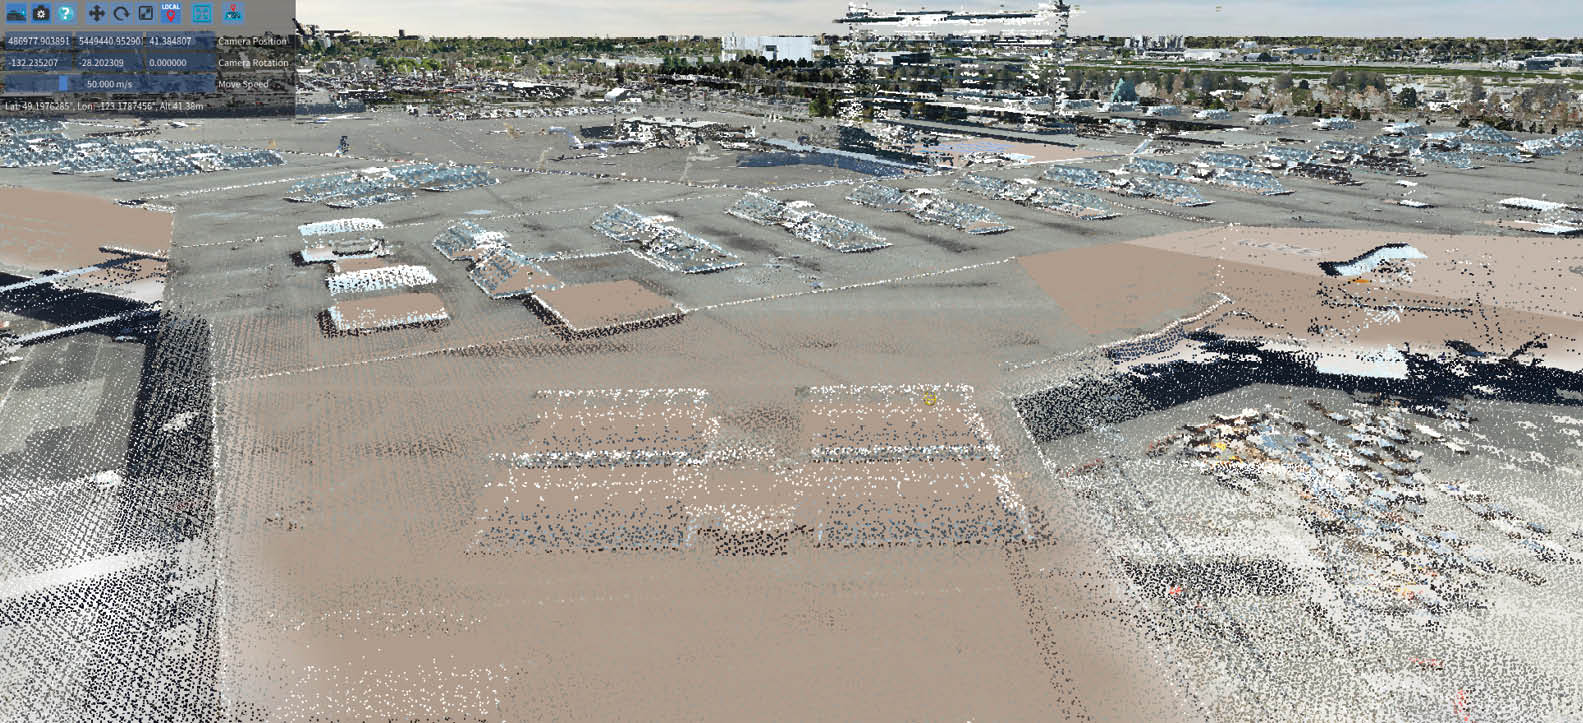
A small, lower resolution point cloud, typical of what the City of Richmond previously accepted, before they adopted Euclideon Vault.
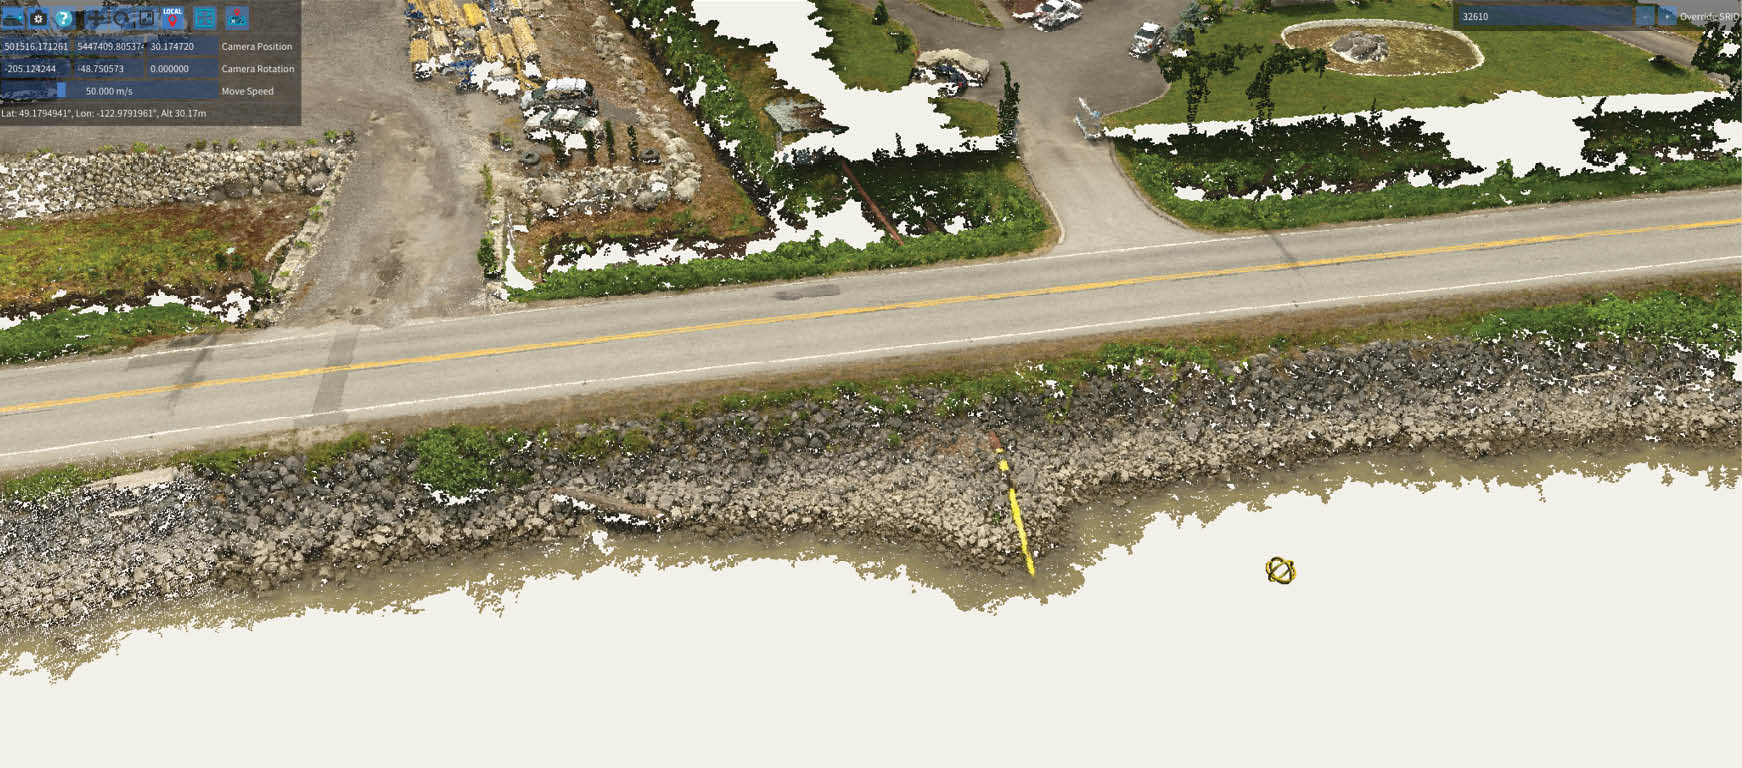
“The photogrammetric data we were getting from the aerial crews was collected from an aircraft flying at 250-300 mph,” he said. “Given that, the closest distance between points it could gather was about 0.75 m and it still created a 48 GB file. Knowing what was possible using VAULT, we employed a drone to fly the dikes and reduced that point distance to a much denser rate—about 1.2 cm between pixels. The detail we were able to get on that project by overlaying the tight data on to the course info was so great that the City is considering either initiating a drone program of its own or, at the least, contracting out to someone to do it.”
It is worth reiterating that being able to monitor the dike system in this manner and to this degree is a huge asset for the City of Richmond. Just as the City relies upon the structures’ integrity and performance, so too does Vancouver International Airport, the second busiest in all of Canada, which is located on Sea Island adjacent to Richmond.
Regular monitoring by laser scanning from drones creates accurate—but massive—3D models.
“Overlaying data collected by drones or third-party providers allows us to do visual inspections ‘on the fly’ and at regular intervals,” said Bleidistel. “This, in turn, will allow us to better anticipate upcoming repairs by foreseeing issues from those visual inspections. Compare that to examining thousands of photos taken from boats and it’s easy to see why we are so excited.”
Break Out Success
An additional benefit VAULT has provided Bleidistel’s GIS function is somewhat ironic: the ability to break large files down into smaller, separate components when it’s called for. Although being able to easily handle a 1 TB file is a nice luxury to have—and as recently as a year ago seemed like only a pipe dream—not everyone wants or needs that volume of data.
“VAULT makes it easy to pull out an individual section of a large file,” he said. “I often have consultants contacting me for the lidar data from a specific area and, rather than just handing them a huge data set, I use the Euclideon’s Massive Data Manager (MDM) to pull out the area they need and export it as a lidar set. They prefer that, and this solution makes it fast and easy to do so.”
As He Sees It
If Bleidistel seems to be something of a cheerleader for the new solution (he confesses to having repeatedly touted it to his peers at conferences and meetings), perhaps that’s because he’s had to both rely on the cumbersome approach (manually-shot 2D photographs) and deal with the massive data sets mentioned above. Though his initial involvement was just a pilot program for the City, he is confident that they will not be moving forward without the VAULT solution
“Having a digital, geospatially accurate representation of an object or area in front of you, rather than seeing it in 2D is a huge paradigm change,” he said. “Without VAULT, and before that, MDM, no-one ever believed that you could view that amount of data in one app, let alone have it streaming from a server!”
He added that City officials had previously used one of the well-known VR headsets, viewed a three- or four-block section of the city and discovered that it not only taxed the system, but it was very easy to get lost.
“By comparison, with VAULT, the fact that we were able to ‘fly’ the entire island, look around and see landmarks and other reference points, made them gasp. I always believe in spreading the word when I find something that is truly game-changing—this is definitely such a case.”