InSAR: an old technology with new applications
Interferometric synthetic aperture radar (InSAR), once limited to specialized research and military reconnaissance, has emerged as a pivotal technology in modern geospatial intelligence, offering highly precise and temporally rich measurements of ground deformation over time. While the core technique has been around for decades, recent advancements in satellite technology, data availability, and processing power have unlocked new applications that are transforming how we monitor and understand changes in the Earth’s surface.
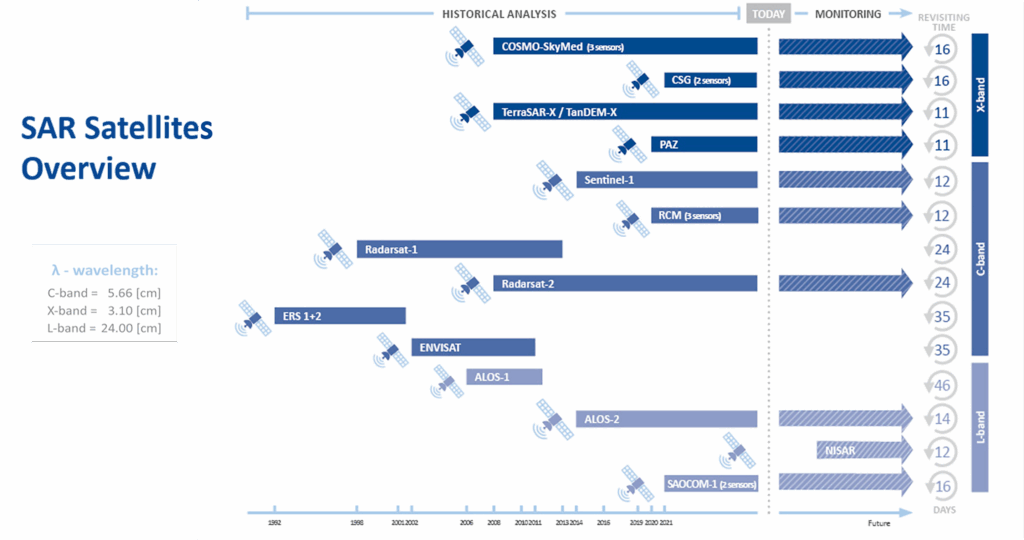
Figure 1: SAR satellites overview.
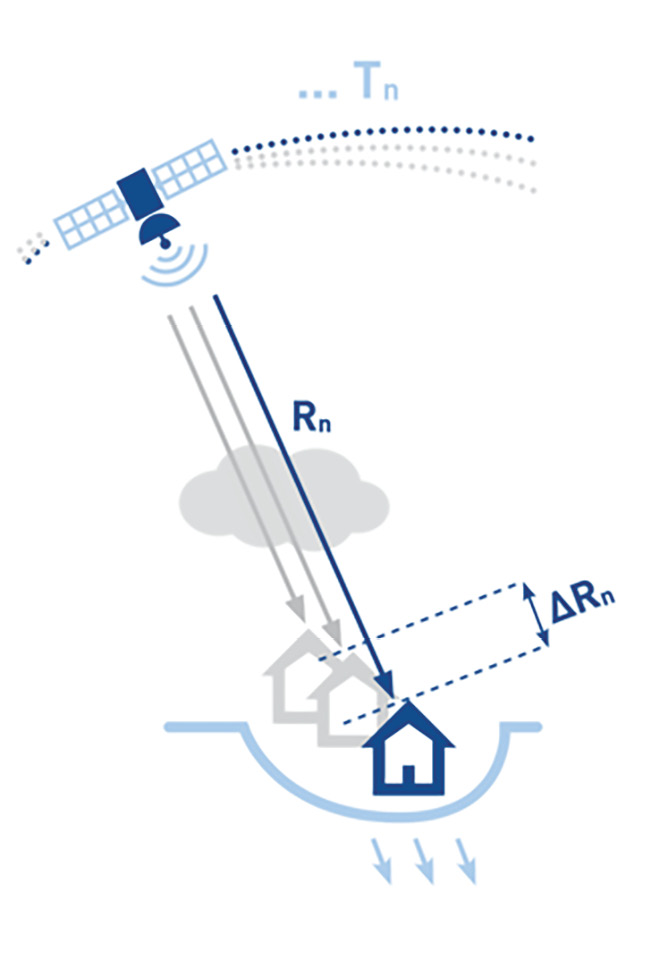
At its foundation, InSAR leverages the phase difference between radar signals acquired from orbiting satellites on multiple passes over the same area. These signals, reflected off the Earth’s surface, are processed to generate images called interferograms, which can reveal minute changes, of the order of millimeters, in ground elevation over time.
Historically, InSAR was limited by the availability of suitable satellite data and the complexity of the processing workflow. However, with the advent of missions like the European Space Agency’s (ESA) Sentinel-1, which provides free and open-access synthetic aperture radar (SAR) data, and of commercial constellations, high-resolution, high-frequency radar imagery has become more readily available.
Moreover, advances in time-series analysis techniques, such as Persistent Scatter InSAR (PS-InSAR) and Small Baseline Subset (SBAS), have enhanced the accuracy and reliability of measurements when tracking long-term surface movements over hundreds of SAR images. Combined with modern cloud-based processing platforms and powerful open-source tools, InSAR has entered a new era defined by routine, operational monitoring rather than episodic analysis.
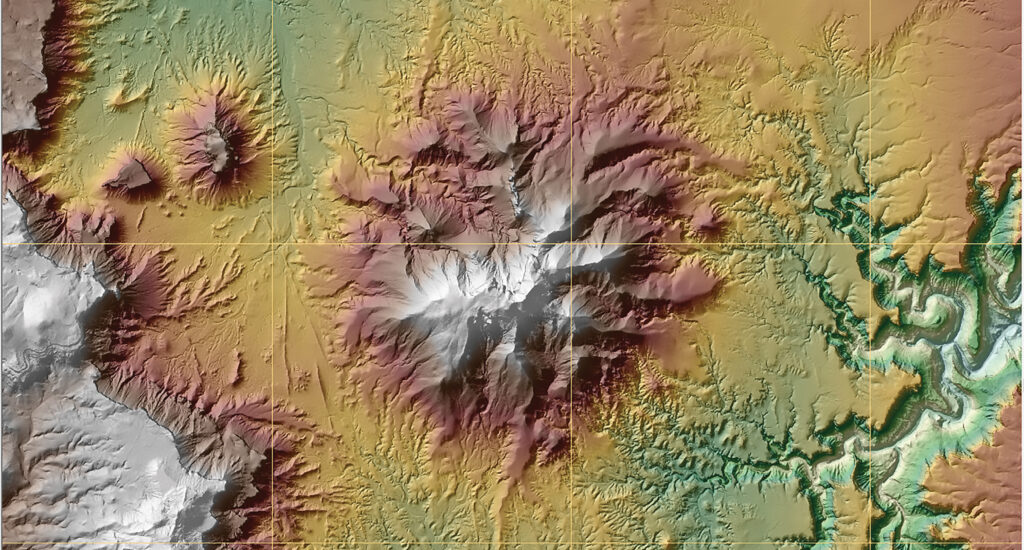
Figure 2: Lidar-derived DEM over the state of Utah.
This unprecedented accessibility has fueled a wave of innovative applications across the public and private sectors in environmental monitoring, disaster response, and infrastructure management. For instance, in the aftermath of an earthquake, volcanic eruption, or landslide, InSAR data can be used to map ground displacement over large areas within days, even in regions that are otherwise inaccessible. Similarly, long-term monitoring of urban subsidence caused by groundwater extraction or mining operations can be conducted using historical InSAR data archives, providing decision-makers with a non-invasive, low-cost method to assess and mitigate geohazards.
As the demand for resilience and proactive risk management continues to grow, InSAR stands out as a cost-effective, scalable, and evolving solution that complements and enhances other remote sensing tools, such as lidar. While lidar excels at generating highly accurate 3D terrain models and structural detail, it represents a snapshot in time. In contrast, InSAR adds the temporal dimension, revealing how terrain or infrastructure is changing. Together, these technologies offer a comprehensive perspective on both form and function, enabling smarter decisions in urban planning, environmental management, and infrastructure resilience. While InSAR may be considered an old technology, its rebirth in the age of big data and remote sensing democratization makes it one of the most exciting tools in today’s geospatial toolbox.
A brief history of InSAR
InSAR may be enjoying a resurgence in popularity today, but its conceptual roots date back over half a century. First developed as a military reconnaissance tool in the 1940s, modern InSAR emerged from the idea that repeated radar observations from orbiting satellites could detect changes in the Earth’s surface through analysis of phase differences in the radar returns. Practical applications, however, were limited by data scarcity and computational constraints.
For most of the 20th century, satellite-based remote sensing was focused on optical systems. SAR missions were very rare, and typically limited in spatial resolution, temporal coverage, and data accessibility. Radar imaging, especially the coherent processing required for interferometry, remained within the purview of government research laboratories and defense agencies, far from the reach of commercial use.
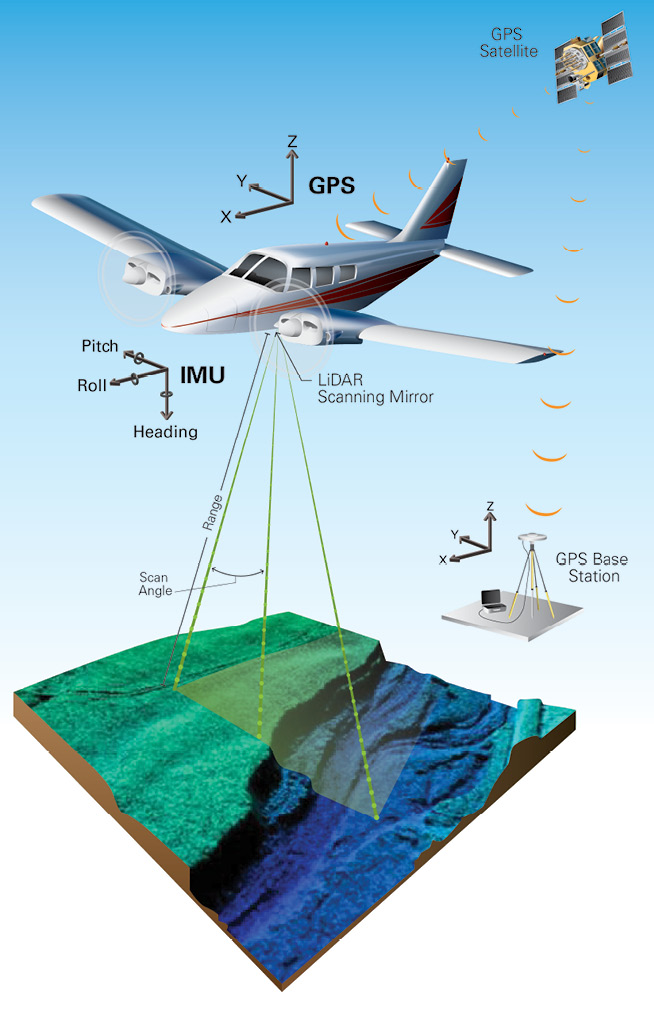
Figure 3: Comparison of lidar and SAR satellite data collection techniques. © 2025 Dewberry and © 2025 TRE ALTAMIRA
That changed dramatically in the 1990s. A defining moment came with the 1992 Landers Earthquake in Southern California. French researchers working with data from the ESA European Remote Sensing Satelllite-1 (ERS-1) applied InSAR techniques to generate interferograms that visually represented ground deformation caused by the quake. These results were groundbreaking, as they not only revealed surface changes with unprecedented clarity, but also demonstrated that InSAR could offer a cost-effective, space-based alternative to traditional geodetic field surveys.
This event marked a turning point in the history of InSAR. The scientific community soon paid attention, and InSAR research proliferated. Throughout the late 20th century and early in the 21st, a series of new missions, including ERS-2, RADARSAT-1, and ENVISAT, expanded the availability of SAR imagery. With improved orbital repeat cycles and broader coverage, these missions allowed researchers to apply interferometric techniques to a growing number of use cases: glacier motion, volcanic activity, subsidence from groundwater extraction, and infrastructure monitoring.
Still, challenges persisted. Processing SAR data into reliable interferograms remained resource-intensive, requiring specialized expertise and powerful computing systems. Moreover, SAR data was not always easy to obtain, as many missions continued to operate under restrictive data policies or were cost-prohibitive for routine monitoring.
The past decade, however, has seen an explosion of innovation and accessibility that has fundamentally reshaped the InSAR landscape. High-resolution SAR sensors are now common, and constellations from multiple national space agencies and commercial providers have put routine interferometric monitoring within reach for a wide range of users.
One of the most significant enablers has been the Sentinel-1 mission, launched in 2014 as part of the Copernicus program. With its open data policy, twin-satellite configuration, and C-band radar payload, Sentinal-1 has made continuous, global SAR coverage a reality. It dramatically lowered the barriers to entry for researchers and practitioners, spurring the development of open-source processing software and cloud-based analysis platforms capable of handling large volumes of data.
SAR imagery today typically utilizes three primary wavelengths and various ground resolutions, each suited to different geophysical characteristics. X-band (3.1 cm wavelength) generally provides finer spatial resolution ideal for urban and infrastructure applications. C-band (5.6 cm wavelength), used by Sentinel-1, strikes a balance between resolution and coherence, performing well in moderate vegetation. L-band (23.6 cm wavelength), the newest of the three, offers superior penetration through vegetation, snow, and loose soil, making it useful to detect motion in certain land cover situations. The satellites housing these intricate systems move in a near-polar ascending, south to north, or descending, north to south, orbit.
As of 2025, nine active and four retired satellites, or constellations of satellites, are currently, or have been, in orbit around the Earth contributing to SAR data collection for InSAR applications. These include government-sponsored missions such as Sentinel-1 (ESA), ALOS-2 (JAXA), and the RADARSAT constellation (Canada), as well as newer commercial platforms such as COSMO-SkyMed Second Generation (Italy), which provide tasking and high-resolution imaging for commercial clients (Figure 1).
The most anticipated newcomer to the SAR assemblage is the joint U.S. National Aeronautics and Space Administration (NASA) and Indian Space Research Organisation (ISRO) Synthetic Aperture Radar (NISAR) mission, successfully launched on July 30, 2025. NISAR is the first radar mission specifically designed to observe and monitor the Earth’s dynamic processes on a global scale. Uniquely equipped with both L-band and S-band (9.4 cm wavelength) radar sensors, NISAR will deliver a powerful combination of surface penetration and temporal consistency. Its dual-frequency approach will enhance monitoring of ice sheets, coastal subsidence, forest biomass, and tectonic movement with unparallel fidelity. Moreover, in line with NASA’s commitment to open science, NISAR’s data will be available to the public.
Enhancing lidar data with InSAR
Light detection and ranging (lidar) technology is considered the current gold standard for acquiring high-resolution elevation data. Whether deployed via aircraft, drone, or ground-based systems, lidar provides unparalleled detail for mapping terrain, vegetation, infrastructure, and coastal bathymetry. It is the backbone of topographic and bathymetric datasets used in everything from floodplain management to transportation planning. Despite its precision and versatility, however, lidar has limitations, particularly in cost, logistics, and its ability to monitor change over time.
Figure 4: InSAR analysis of Houston, Texas. The data shows vertical ground displacement rates in the range of 20 mm/year. Contains modified Sentinel-1 data 2017-2023. © 2025 TRE ALTAMIRA.
Lidar systems emit laser pulses towards the ground and measure the time taken for those pulses to reflect back to the sensor. By doing so, scientists can calculate precise distances and generate dense point clouds that can be processed into three-dimensional digital elevation models (DEMs), canopy height models, and countless other derivative products (Figure 2). These outputs are typically accurate to within a few centimeters and can resolve fine-scale surface features that radar systems cannot detect. Nevertheless, lidar collection missions require favorable weather and ground conditions, and the use of specialized equipment. The logistics of acquiring lidar data over large or remote areas can be resource-intensive. Thus such collections are usually infrequent, often spaced several years apart owing to cost and operational complexity.
In contrast, InSAR offers a complementary and increasingly indispensable tool for tracking surface deformation over time. While both sensors are able to function any time of day, InSAR uses radar signals from satellites that can penetrate cloud cover and operates regardless of weather conditions. This allows for the delivery of regular, repeatable observations over the same area (Figure 3). With the global SAR satellite constellations now offering revisit times of up to a few days in some regions, InSAR enables frequent monitoring of surface elevation changes.
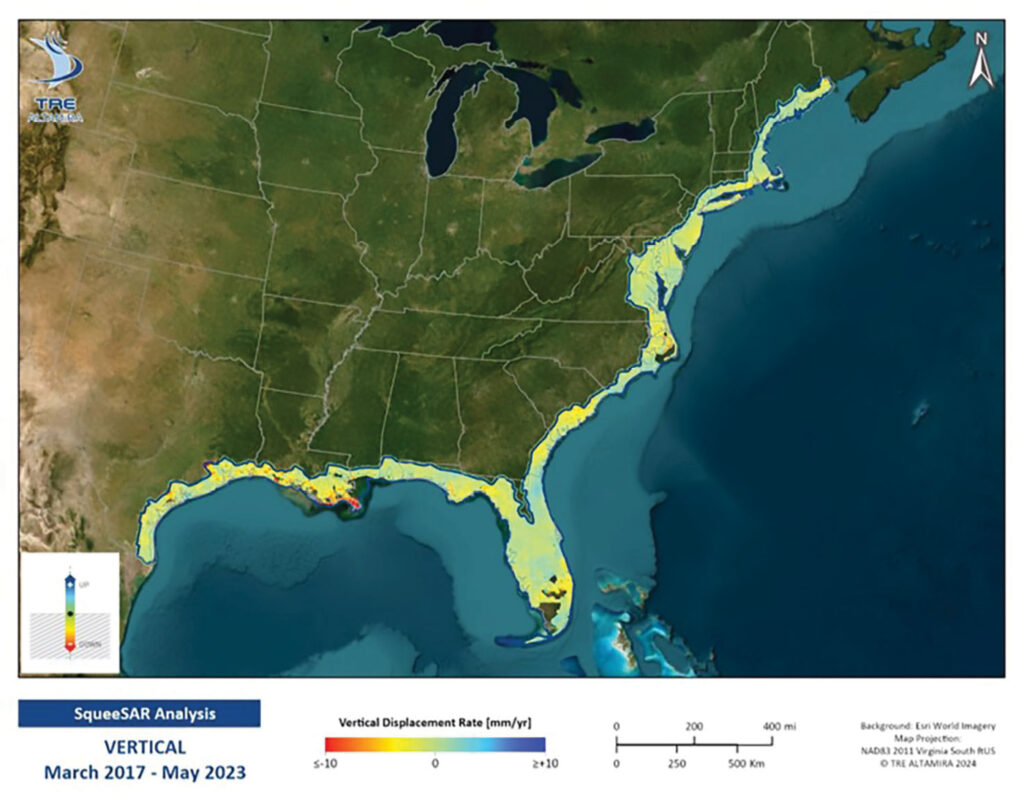
Figure 5: InSAR analysis for the NOAA U.S. East and Gulf Coast Historical InSAR Analysis Task Order. Contains modified Sentinel-1 data 2017-2023. © ٢٠٢٤ TRE ALTAMIRA.
The synergy between lidar and InSAR is where the real value emerges. Lidar provides the “what” in exquisite detail, a snapshot of the current surface, while InSAR provides the “when”, revealing how that surface has changed over time. If used together, these technologies produce a more comprehensive picture of the state and behavior of the Earth’s surface. For example, a high-resolution lidar survey may detect a depression or bulge in the landscape, but without repeated measurements the timing and cause of that feature may remain unclear. InSAR, on the other hand, can reveal whether that feature is actively changing, whether deformation or subsidence is accelerating, and whether it correlates with anthropogenic activities such as groundwater withdrawal or naturogenic events like tectonic shifts (Figure 4).
InSAR can also help guide and optimize lidar deployments. Given its low cost and frequent coverage, InSAR is well-suited for wide-area recognizance to identify regions experiencing significant vertical movement, whether subsidence or uplift, that merit more detailed investigation. Once identified, these hotspots can be prioritized for high-resolution lidar acquisition to quantify change, validate deformation models, or assess risk to critical infrastructure. This targeted approach confirms that lidar is deployed where it can provide the greatest value, making the most of limited resources.
Conversely, lidar-derived elevation data is increasingly being used to enhance the accuracy of InSAR processing. High-resolution DEMs generated from lidar can be used to correct for topographic phase contributions in InSAR interferograms, especially in areas with steep terrain or complex urban environments. This fusion of datasets improves the overall accuracy of deformation measurements and facilitates more reliable interpretations.
A recent demonstration of an integrated data approach is the U.S. East and Gulf Coast Historical InSAR Analysis project completed by Dewberry and TRE ALTAMIRA for the National Oceanic and Atmospheric Administration’s (NOAA) National Geodetic Survey (NGS). This involved NOAA’s collaboration with Dewberry and TRE ALTAMIRA to conduct a large-scale analysis of around 3500 Sentinel-1 SAR images acquired along 17 different, ascending orbit tracks and covering more than 500,000 km2 of the eastern seaboard of the U.S., from the Gulf Coast of Texas to the rugged coastline of Maine (Figure 5). The study spans six years (2017–2023) and delivered 150 million measurement points at full resolution, which were calibrated with NOAA’s Continuously Operating Reference Stations (CORS) GNSS network. The quality of the vertical land motion data was confirmed by the submillimeter differences between InSAR and GNSS displacement rates, averaging a rate difference of 0.1 mm per year and a standard deviation of ±0.3 mm per year. Using historical SAR data and advanced time-series InSAR techniques, the project provided a detailed picture of where and how the coastline is shifting due to subsidence, tectonic lift, and other geological processes.
These findings are already influencing how NOAA is approaching coastal resilience planning. InSAR results from this study are being used to verify vertical datums, inform sea level change projections, and prioritize regions for lidar and geodetic surveys. In places where InSAR detected persistent subsistence, such as parts of the Mid-Atlantic and Gulf Coast, NOAA can now deploy lidar and ground survey more strategically, validating deformation trends with high-resolution data and integrating the results into predictive models for flood risk and infrastructure stability.
The Dewberry and TRE ALTAMIRA project exemplifies the growing recognition that no technology alone can fully address the challenges of a changing Earth. But when combined, they can produce a more complete, multidimensional view of the terrain – spatially, vertically, and temporally.
A harmony of solutions
As the geospatial industry continues to embrace integrated, multi-sensor solutions, the role of InSAR in augmenting lidar is expected to expand. With commercial SAR constellations now offering affordable, high-cadence data streams and lidar technologies advancing in portability and automation, the opportunities for constructive collaboration will only grow. Cloud-based platforms are already facilitating the fusion of InSAR and lidar datasets, enabling seamless workflows that leverage the strengths of each system in unified analysis.
In summary, InSAR does not replace lidar. It enhances it. By identifying where the surface is moving, how fast, and in what direction, InSAR promotes smarter, more focused use of lidar and other remote sensing resources.
Together, lidar and InSAR form a powerful framework for environmental monitoring, disaster response, land-use planning, and infrastructure assessment. They support proactive decision making by not only identifying existing conditions but also predicting future trends. This dual perspective is increasingly critical in an era of geographic discovery, urban expansion, and aging infrastructure.