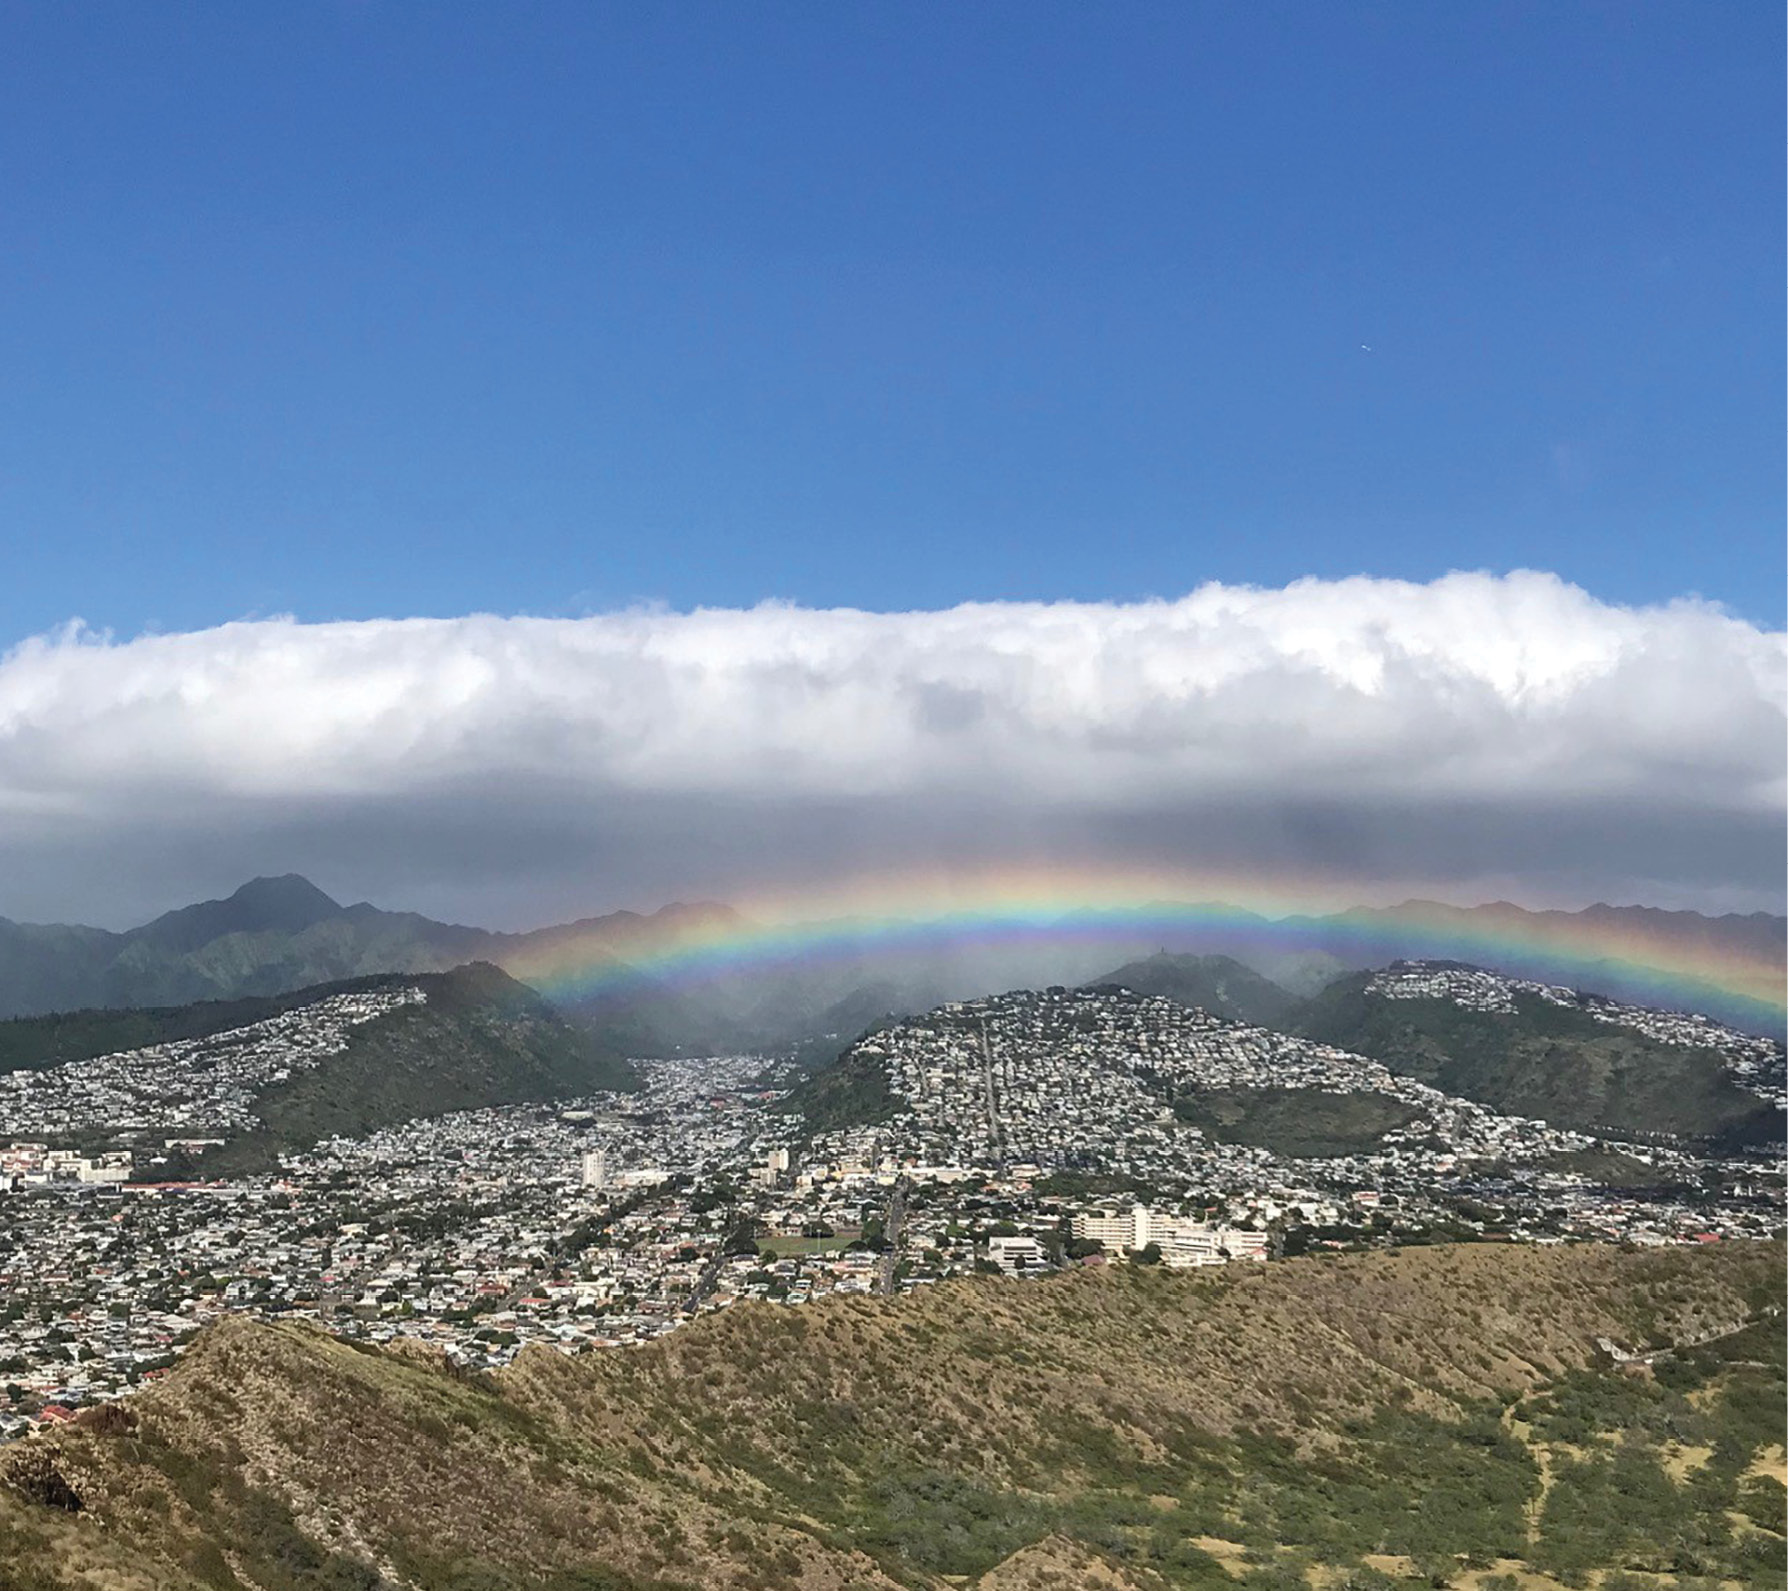
This picture was taken at the summit of Diamond Head State Monument, which is located just east of Waikiki on the island of Oahu. This angle is looking windward over the crater toward Waialae-Kahala. The site is known to Hawaiian people as Le’ahi. British sailors gave it its name by mistaking the quartz crystal in the rock for diamonds. Photo courtesy of Woolpert.
After three years of planning and execution by multiple partners, most of the Big Island of Hawaii—from its steep, craggy oceanside cliffs and mountainous peaks to its lush valleys and sandy shorelines—has now been mapped using a single-photon lidar sensor. This data and imagery will be available for use by the public and to assist with everything from managing coastal issues to removing invasive species.
In 2016, the National Oceanic and Atmospheric Administration (NOAA) Office for Coastal Management (OCM) coordinated with the U.S. Geological Survey (USGS) to procure high-resolution, single-photon lidar data of the Big Island of Hawaii. NOAA OCM utilized its Coastal Geospatial Services Contract 2 and USGS utilized its Geospatial Product Services Contract 3 in a joint contract with Woolpert to acquire Quality Level 1 lidar data of the entire island. Hexagon’s Geosystems division and Dynamic Aviation, which provided the lidar equipment and aircraft services respectively, supported Woolpert on these contracts.
Editor’s note: A PDF of this article as it appeared in the magazine is available HERE.
NOAA initially was interested in collecting lidar data for a roughly 500-square-mile area in the northwestern portion of the island to perform a sediment study, but was able to leverage resources from USGS and its 3D Elevation Program (3DEP) partners to map the entire 4028 square miles of the Big Island in support of 3DEP and coastal zone management.
Ross Winans, a Pacific geospatial coordinator/senior remote sensing analyst with Lynker Technologies and on contract to NOAA OCM, said this work represents the most comprehensive lidar acquisition to date on the Big Island.
“Lidar data collection has never been done at scale in Hawaii, in terms of looking at the entire geography and comparing the data with government standards for quality control then making the information publicly available,” Winans said.
13-hour flights and extreme weather
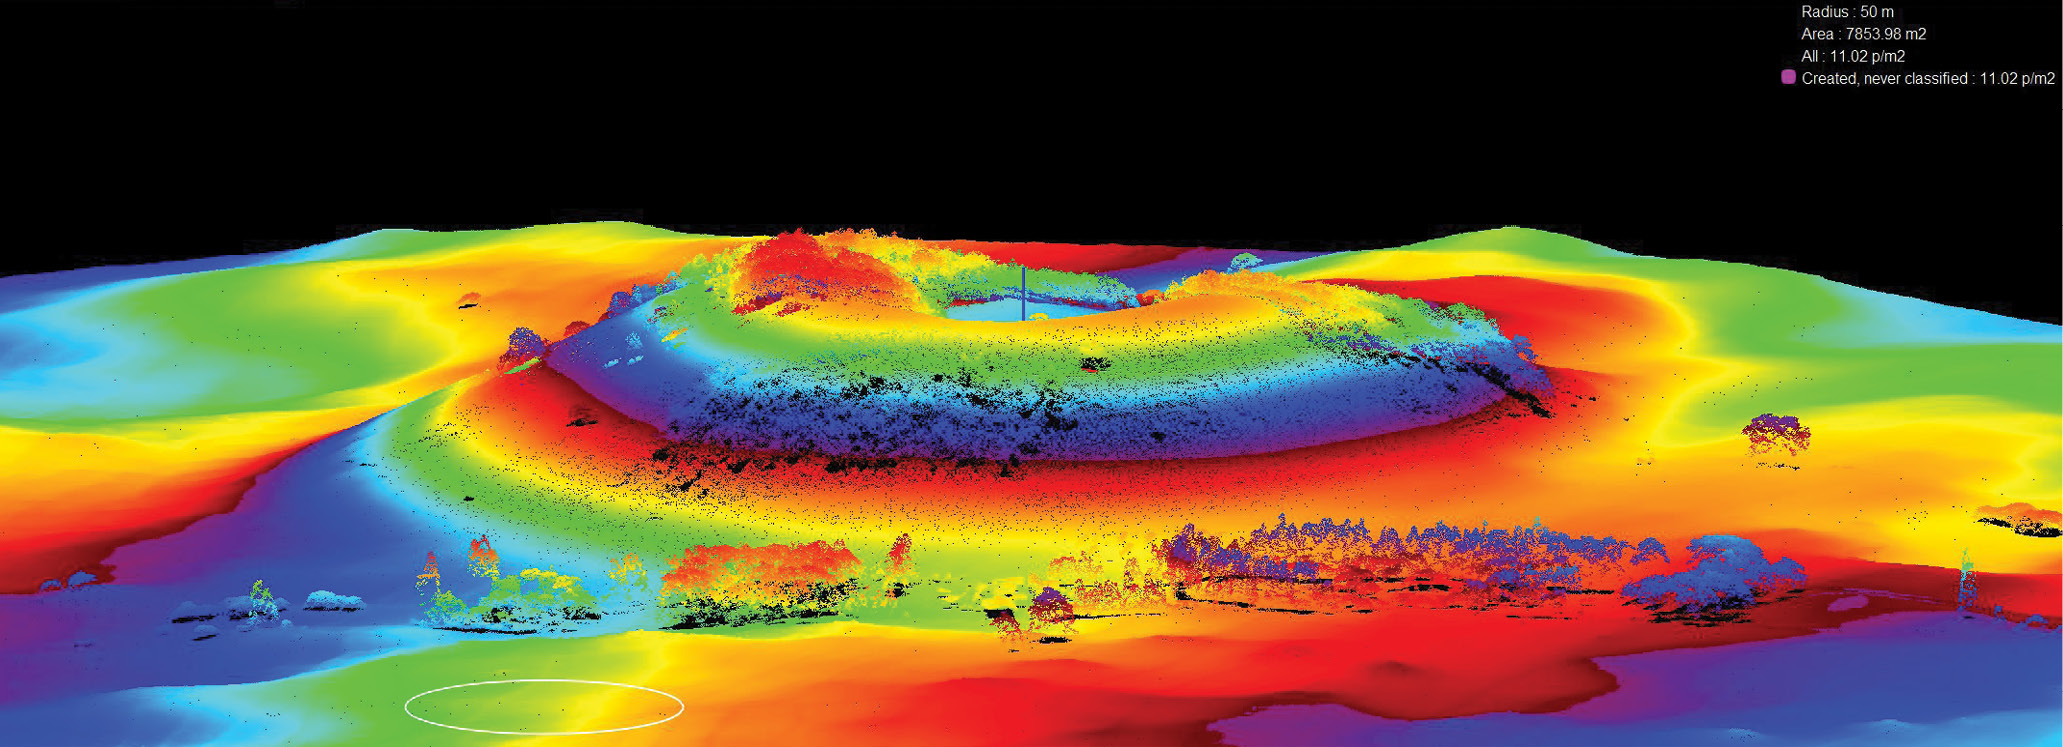
Single-photon lidar data was used to create this point cloud colored by elevation of a crater on the Big Island. Image courtesy of USGS and NOAA.
With dramatic elevation changes, dense forest canopies and disparate climatic conditions, Hawaii is one of the most geographically diverse and dynamic locations in the world. Simply getting the aircraft and equipment to the island is a costly, complicated process that requires considerable coordination and planning. Consequently, the Pacific destination is one of the most challenging locations to collect lidar data.
Extensive planning for the project began in early 2017. While a commercial airliner can fly from California to Hawaii in less than six hours, making the trip in a Beechcraft King Air twin turboprop airplane can take up to 13 hours. The aircraft must be modified with temporary, large fuel bladders to carry it across the Pacific Ocean. When the aircraft reaches the Big Island, the extra fuel bladders are removed so that the lidar equipment can be installed.
Each time the fuel bladders are added or removed, the aircraft must pass inspection by the Federal Aviation Administration (FAA). Woolpert completed the contracted work in two trips over a three-year period, which equated to four inspections by FAA.

This surface model illustrates volcanoes on the Big Island in this image derived from lidar data acquisition. Image courtesy of USGS and NOAA.
From a project management and planning standpoint, the team had to account for 10 of the world’s 14 climate zones. Hawaii is the only place on Earth with so many different climates in such a small area. Consider that the northwestern portion of the state can receive 10 to 30 inches of precipitation a year, while the eastern side can be drenched by 200 inches or more. It can be snowing at the top of the dormant volcano Mauna Kea, which sits 13,796 feet above sea level, while it’s sunny and pleasant along its rocky coastline base.
Hawaii also lives the effects of El Niño and La Niña cycles, which produce cloud cover that impacts when flights can be scheduled. To plan flight-time windows one to two years in advance, Winans said he consulted with Hawaii’s climatologist, who was able to advise on the natural oscillation of the Earth’s climate specific to this region.
“The general rule of thumb is that, during an El Niño year, there are good opportunities to collect lidar,” Winans said. “During the 2018-2019 season, we experienced La Niña conditions. However, 2019’s early climate indicators signaled that we could transition directly from La Niña conditions to El Niño conditions. Those would be unusual circumstances, as typically neutral conditions occur between the two patterns. We delayed lidar collection in 2019 as we waited for an El Niño that never came, and as a result we were unable to fly any missions in 2019. Eventually, we were forced to cut losses and fly during neutral conditions, which can present a major challenge on the Big Island.”
The weather prevented some of the planned missions from being executed, but about 70% of the island was covered before funding on the contract was exhausted, according to Woolpert vice president and geospatial program director John Gerhard.
“The window of time to fly missions is small, from mid-December to mid-February. Our crew was only able to fly 10 to 15 days during that time frame. The rainy, cloudy conditions prevailed, and flights occurred about once every five days,” Gerhard said.
Covering rugged terrain and dense vegetation
The first collections took place as scheduled between January and February 2018. The flight plan divided the island into 19 areas, based on the ground elevations above sea level. The plan enabled the crew to fly at a consistent elevation for each area. To remain within the operational limits of the Leica SPL100 sensor, altitudes were maintained between 10,500 to 14,500 feet above the terrain, depending on the flight area.
Of the 336 total flight lines that were planned, approximately 235 were executed, resulting in lidar data collections for 2819 square miles of the island. Approximately 80 ground control points were collected by Woolpert for data calibration. Ninety-one non-vegetated vertical accuracy (NVA) points and 69 vegetated vertical accuracy (VVA) points were collected by NOAA and uniformly distributed, surveyed and later used for data accuracy verification.
The Leica SPL100, a single-photon airborne lidar sensor, was chosen for this project instead of a linear-mode lidar sensor because of the dense vegetation on the Big Island. The system is accompanied by an 80-megapixel RGBN camera, which captures aerial imagery simultaneously with the lidar data. The sensor emits 100 output laser beams in a 10- to 30-degree swath, capturing 6 million measurements per second and collecting 12 to 30 points per square meter. While the dense canopy reduces the probability of a single laser pulse reaching the forest floor, SPL100 technology responds with a very high, first-surface point density from the 10 by 10 array of laser outputs, allowing the contract’s 8 points per square meter requirement to be met.
The Leica SPL100 is up to 10 times more efficient in wide-area coverage scenarios than a linear-mode sensor, said Matt Johnson, HxGN Content Program elevation team lead and project manager.
“The SPL100 is best suited for high-density, large-area projects. It has been utilized in a variety of environments—high-relief mountainous areas, dense tropical jungles and leaf-on forest inventory projects,” Johnson said. “For a project the size of the Big Island of Hawaii—which presents challenging terrain, difficult weather and limited collection opportunities—capitalizing on every opportunity to maximize the area captured is critical to the project success.”
Coastal management and invasive trees
Woolpert continues to process the raw lidar data and imagery into geodatabase sets and other deliverables, which will aid NOAA and USGS in coastal management decision-making, including applications such as support for local hydrologists and watershed managers, for formulating a sediment budget and identifying soil erosion hotspots.
One major application, by the state of Hawaii, is support for the removal of the invasive albizia tree, which grows across the Big Island and is found on Hawaii’s satellite islands. Not only do the albizias inhibit Hawaii’s native species from thriving, but the tall, brittle trees are the leading cause of property and infrastructure damage during storms. Winans said the state has a program to remove this invasive species as much as possible to prepare for and mitigate damage from tropical cyclones and other severe weather activity.
“Albizia trees grow tall above the native Hawaiian canopy, but they don’t have a broad footprint when looking from above,” Winans said. “With lidar, they are noticeable because they poke out of the top of the canopy. The point clouds derived from the lidar data will assist the state in identifying areas to prioritize in the program.”
Processing data, ongoing collections
The final flights to collect lidar data for the Big Island occurred in January 2020, and the data are being processed and delivered as various derivative products, such as contour maps, digital elevation models and colorized point clouds.
Woolpert is also acquiring lidar and bathymetry data over other islands in the south and central Pacific Ocean. Numerous flights have been completed or are being scheduled, including over the island of Kauai and those in the Commonwealth of the Northern Mariana Islands.
“We have been deployed in the Pacific for more than a year,” Gerhard said. “We have acquired data for numerous projects at several island locations across the Pacific. We are continuing our work there while we navigate the multiple travel restrictions that are in place with various governments.”
NOAA OCM geographer Dave Stein commented that these collections, like the one performed in Hawaii, will continue to prove invaluable to all involved.
“This was a multi-partner, collaborative effort that made good use of federal funding for high-quality data that will provide a baseline of information about Hawaii to be used by public and private entities for years to come,” Stein said.