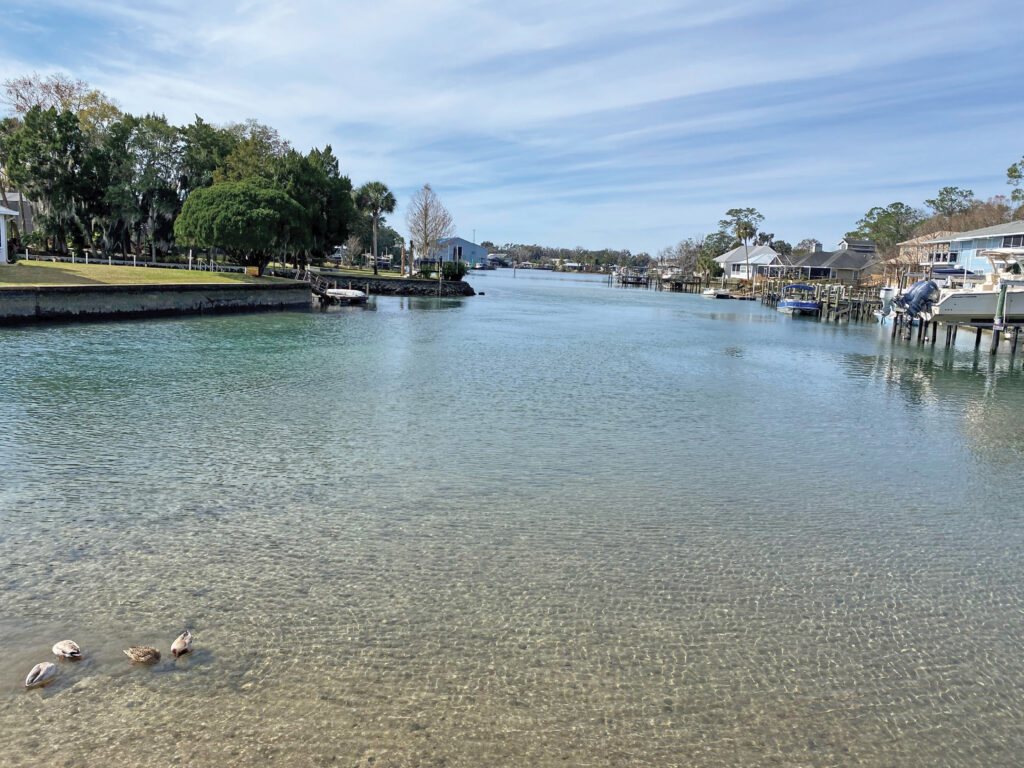
Kings Bay in Crystal River, Florida (Figure 1) was designated as an Outstanding Florida Water and an Outstanding Florida Spring by the state. This 600-acre bay is the headwaters for Crystal River and is a first magnitude spring system, comprising over 70 springs. The spring water is 72°F (22°C) year-round, attracting wildlife and outdoor enthusiasts alike, which adds an economic driver to the bay’s environmental importance. Designated as a national wildlife refuge in 1983, this system harbors over 1,000 West Indian manatees (Trichechus manatus) during the winter and draws nearly 400,000 visitors annually to swim with the manatees. Numerous government agencies, non-profit organizations, and businesses are listed as stakeholders in the Crystal River/Kings Bay Basin Management Action Plan by the Florida Department of Environmental Protection (FDEP), all having a vested interest in Kings Bay, along with local residents. Considering the substantial attention on Kings Bay, periodic acquisitions of its bathymetry are well warranted.
Bathymetric lidar projects (Table 1) have been conducted in Kings Bay over the past decade by the Joint Airborne Lidar Bathymetric Technical Center of Expertise (JALBTCX; now the Interagency Airborne Technologies for Lidar Analysis and Surveying (I-ATLAS)), the National Oceanic and Atmospheric Administration (NOAA), and the Southwest Florida Water Management District (SWFWMD). Each of these surveys acquired topobathymetric lidar and produced derived digital elevation model (DEM) raster products. As with any comparison of DEM products over time, product variations and temporal differences must be taken into consideration when evaluating change detection results.
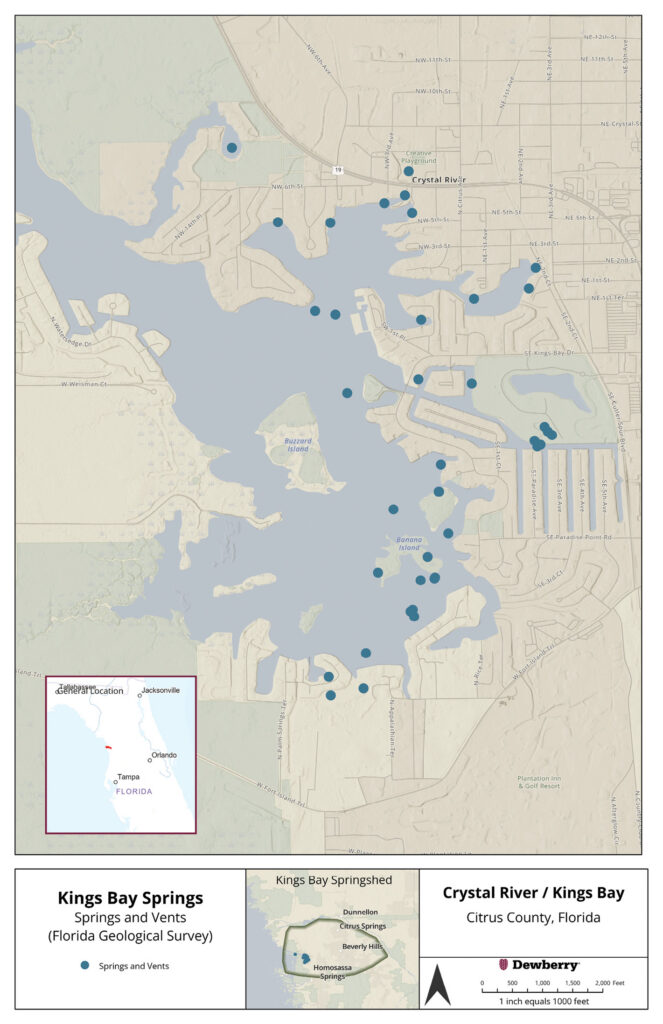
Figure 1: Kings Bay, Citrus County, Florida location map, showing the distribution of springs and vents.
The first topobathymetric lidar acquisition occurred in spring 2015, when SWFWMD conducted a cooperative pilot project with JALBTCX and Dewberry. JALBTCX deployed a Teledyne Optech Coastal Zone Mapping and Imaging Lidar (CZMIL) sensor to collect topobathymetric lidar data for a portion of the Kings Bay springs system (Figure 2). This project was conducted to determine the feasibility of using topobathymetric lidar to map the inland spring system. During that same time period, SWFWMD engaged a local hydrographic survey firm to employ “traditional” survey instruments, a single-beam fathometer (Teledyne Marine Odom Echotrac MK III, operating at 200 kHz) and a low-frequency sub-bottom profiler (Ross 8510, operating at 3.5 kHz), to survey the Kings Bay bathymetry. Thus, this acquisition project provided an opportunity to compare the CZMIL lidar-derived measurements of top and bottom of unconsolidated materials (i.e., derived volume) with comparable volumes derived from conventional hydrographic surveys.
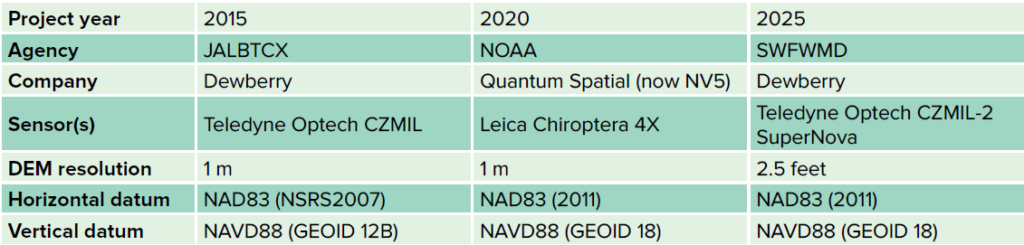
Table 1: Topobathymetric lidar surveys of Kings Bay (2015, 2020 and 2025; see Figure 3 for survey distribution).
Pilot project area and the 2015 results
The area selected for the Kings Bay pilot project is commonly called the “Phoenix” because the general shape of the area resembles a flying phoenix (Figure 2). This area, of approximately one square mile, contains numerous springs (Figure 1), over 250 residences, tourist businesses, restaurants, and a commercial fishery. A commercial shipping channel leads from the fishery out through Kings Bay proper and into the Crystal River for approximately seven miles, where the Crystal River empties into the Gulf (Figure 3).
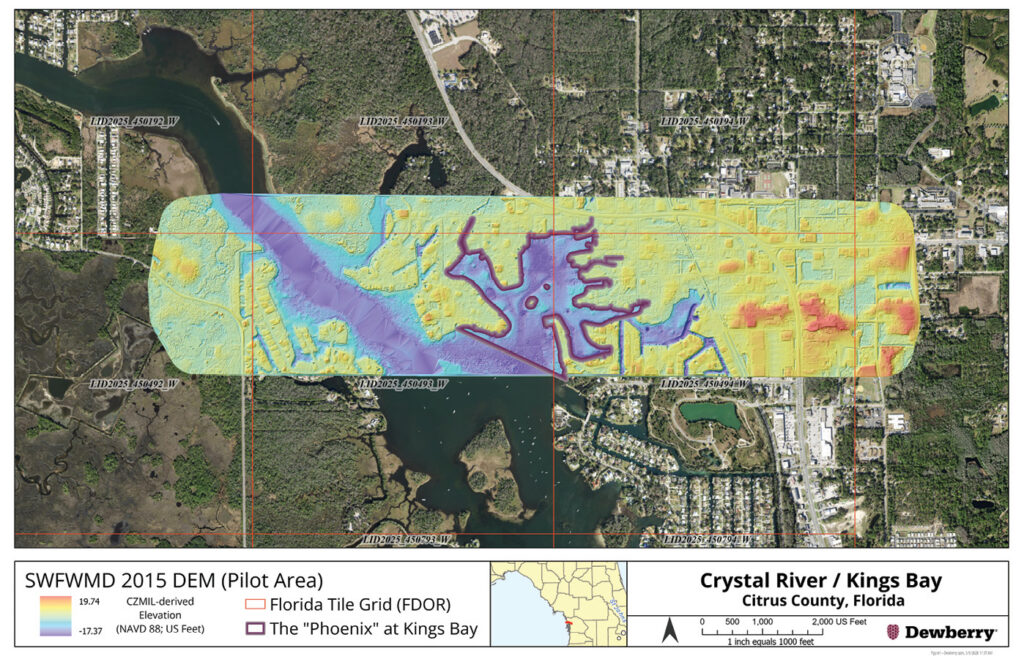
Figure 2: DEM constructed from 2015 topobathymetric lidar survey highlighting the “Phoenix” area of Kings Bay.
The results were reported in detail in LIDAR Magazine (Karlin et al., 2017).
The close agreement between the CZMIL lidar ranges and the conventional sonar survey provided SWFWMD with a high level of confidence in the accuracy of the lidar-derived surfaces used for volumetric calculations.
SWFWMD instructed its consultants to proceed to use the CZMIL lidar data, in lieu of the sonar survey data, for all unconsolidated sediment thickness analyses, design drawings and conceptual options of probable cost for sediment removal.
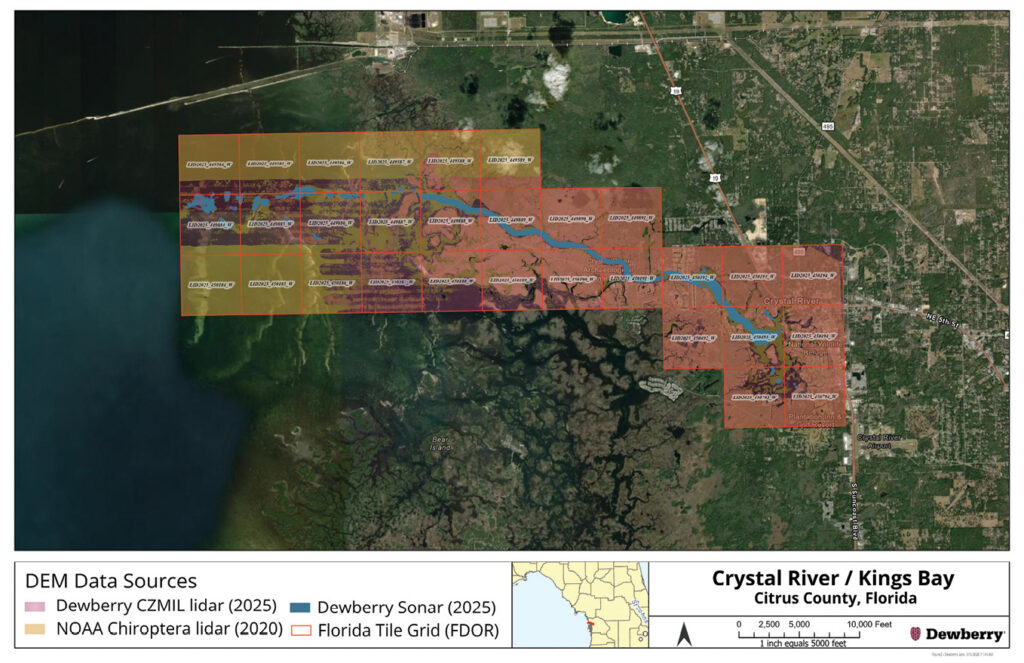
Figure 3: Crystal River/Kings Bay, Citrus County, Florida, showing the distribution of the 2020 NOAA (lidar) and 2025 SWFWMD (lidar and sonar) surveys.
SWFWMD found that surface interpolations using the sonar data may introduce greater error than the lidar data, likely resulting from the karst geology and large survey transect interval (100 feet). Indeed, the sonar survey completely missed a large, first-order spring vent simply as a result of the transect interval.
Based, in part, on these results in the Kings Bay system, and reinforced by similar satisfactory results from the Rainbow River (Karlin et al., 2020), and Gum Slough (Karlin et al., 2023), both inland tributaries of the Withlacoochee River, Dewberry proposed a hybrid topobathymetric lidar/multibeam sonar approach to remapping the full extent of Kings Bay, including the entire length of the Crystal River, for SWFWMD’s Minimum Flows and Levels (MFL) modeling. The details of this study and change detection analysis between 2015 and 2025 are reported below.

Figure 4: Timeline of tropical storms that influenced sediment deposition in Kings Bay.
Topobathymetric lidar data sets for change detection — some considerations
With the 10-year separation between lidar missions, variations in sensors, resolution, and datum inevitably influence the lidar data quality and thus the resultant products. Table 1 lists sensors, DEM resolution, and geodetic datums for the different acquisition times. Quadros (2013) provides a detailed sensor comparison.
NOAA’s National Geodetic Survey (NGS) provides the framework for all positioning activities in the nation. For the horizontal datum, the increasing accuracy and availability of GNSS led to the two adjustments of the NAD83 datum (2007 and 2011) as adopted by SWFWMD for the 2015 and 2025 missions, respectively. For the vertical datum, GEOID18 (adopted by SWFWMD in 2020) is a significant improvement over GEOID12B (adopted by SWFWMD in 2012), including improvements to the underlying gravimetric geoid model, with consequent increases in the accuracy and distribution of data used to constrain the bathymetric ground model to established benchmarks. As expected, significant new data analysis and advances in modeling techniques also were developed.
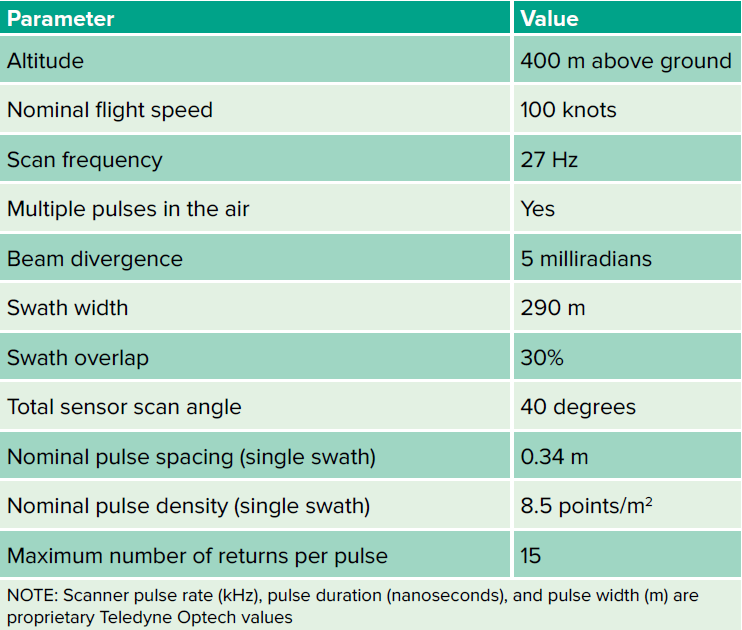
Table 2: CZMIL-2 acquisition parameters for the Crystal River/Kings Bay survey.
Custom lidar bathymetric ground algorithms may also produce variations between projects in coverage of points classified as bathymetric bottom (ASPRS Class 40), which, in turn, may affect the DEM comparisons. Areas with insufficient point density may be enforced in the DEM as data voids, as was common in the 2020 NOAA project, or the DEM may be allowed to interpolate across low density areas, as in the 2015 JALBTCX project. The locations of the voids or areas of interpolation are sometimes but not always the same between projects. Elevation differences occurring in these void areas are not valid results. It is best practice to exclude these areas from DEM comparisons.
Temporal differences between the data sets
In addition to product variations, temporal differences must be taken into consideration when evaluating DEM change detection results. The temporal difference of natural sediment accumulation over time is expected in Kings Bay. Additionally, several severe weather events over the intervening decade (Figure 4) potentially affected the benthic bottom elevations. The storm surge heights in the Crystal River area are displayed in the timeline, according to National Hurricane Center Tropical Cyclone Reports. Although Kings Bay is six miles inland from the Gulf of America and generally sheltered from the worst wave action during hurricanes that typically causes erosion, the bay is nonetheless subject to rapid sediment deposit from storm surge.
Finally, construction/dredging projects in the area during the interim between lidar collections were reviewed and only one United States Army Corps of Engineers (USACE) permit application SAJ-2016-00169 (SP-EWG) was found to be a potential influence on bathymetry. The purpose of the project by Save Crystal River, Inc. in 2022 was to suction-dredge a total of 29,400 cubic yards of muck containing Lyngbya spp. algae and other dead and decaying detrital material from the eastern and northern extent of Kings Bay, to expose a mineral substrate that is suitable for planting native aquatic vegetation. As this dredging occurred three years prior to the topobathymetric survey, was limited to a small area, and there were several natural events during the intervening time, most likely this project had little effect on the “Phoenix” sediments.
2025 CZMIL-2 topobathymetric lidar data set
The primary data set used to construct the final “hybrid” digital elevation models (DEMs) was the CZMIL-2 topobathymetric lidar data. Data collection was planned for 52 parallel flight lines, 33 east-west lines to map the extents, and an additional 19 northwest–southeast lines tailored to the bay, with 3 cross flightlines over the area of approximately 27 square miles. Because this area serves as a warm-water refuge for more than 1,000 West Indian manatees during the winter months, aerial acquisition was delayed until 23 April 2025, after the manatees left the bay. Aerial data acquisition was completed on 5 May 2025. All lidar data were collected with the parameters in Table 2 and delivered with the parameters in Table 3.
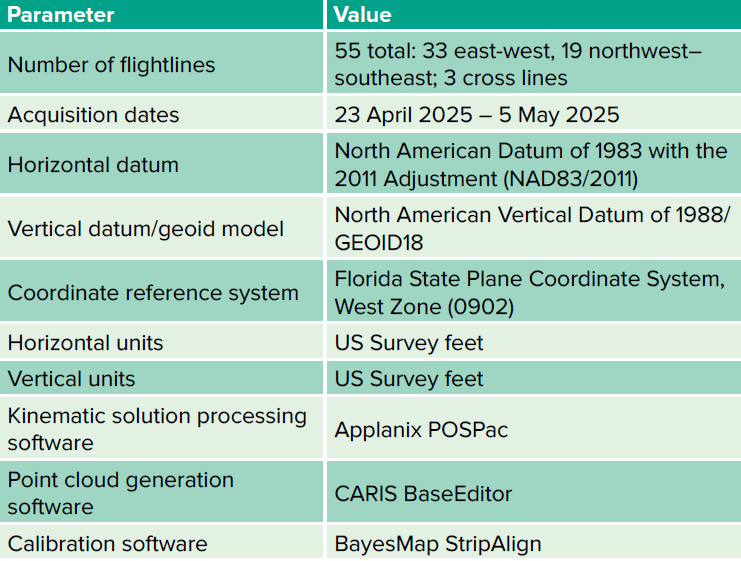
Table 3: Topobathymetric lidar delivery parameters for the Crystal River/Kings Bay survey.
Multi-beam sonar data set and ground truth survey
Sonar data: To fill-in CZMIL-2 voids, as a secondary data source, and to ground truth the CZMIL-2 data, Dewberry contracted with SurvTech Solutions, Inc. (Tampa, Florida) to acquire conventional multibeam sonar (MBES) data along the reach of the Crystal River, through selected areas within Kings Bay (Figure 5), acquire six (6) single-beam sonar cross-sections at pre-selected locations along the Crystal River, and perform lidar control and ground truth surveys (Figure 5). Vessel-based survey was performed with either a 22-foot cabin boat or a 10-foot pontoon boat as constrained by the river. Sonar surveys were conducted with a CEESCOPE Echosounder (single-beam) and either a Norbit iWMBS + Applanix AP20 or PingDSP multibeam sonar system. Single-beam sonar was collected on 13 June 2025; multibeam, on 19–25 June 2025.
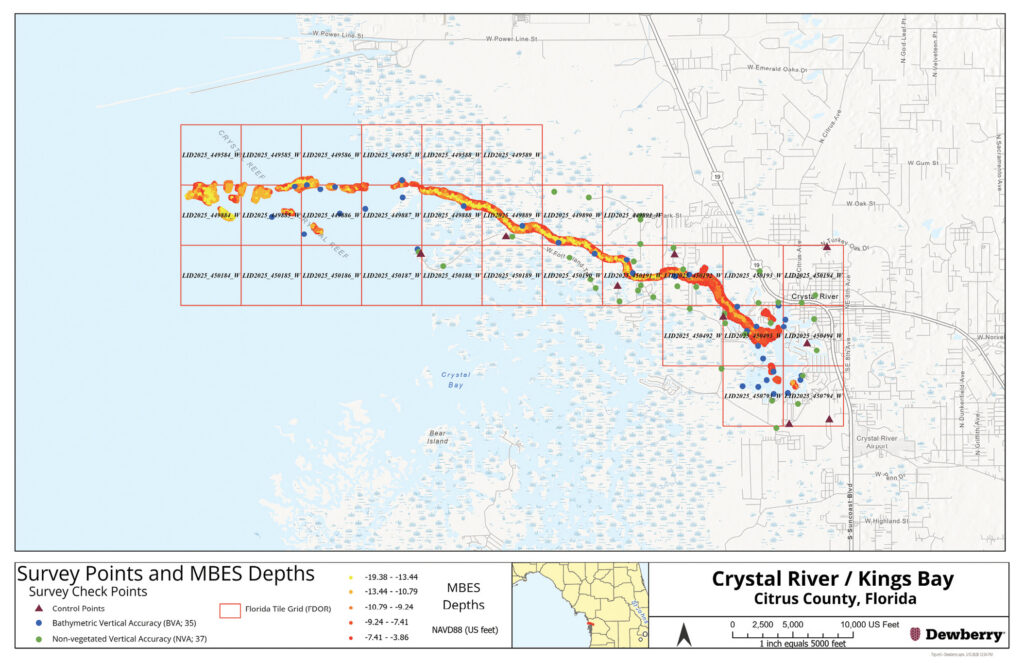
Figure 5: Distribution of multibeam echosound (MBES), single-beam echosound (SBES) and acoustic checkpoint surveys.
Survey Control and Ground Truth Data: All ground positions were measured with Trimble R10 (base), Trimble R8 (rover) and Trimble TSC5 (controller). The primary control for the survey was NGS control point CR52, which was verified and referenced to three other NGS control points using the Florida Department of Transportation’s Florida Permanent Reference Network. Ten ground control points (GCPs) were collected relative to CR52. To conform to ASPRS Positional Accuracy Standards for Digital Geospatial Data (2023)1,37 Non-Vegetated Accuracy (NVA) check points and 35 Bathymetric Vertical Accuracy (BVA) checkpoints were surveyed (Figure 5). NVA check points were surveyed on 11–24 September 2025; BVA checkpoints, on 3–4 June 2025. All check points were reported to the same horizontal and vertical datums, and coordinate reference system as the lidar, as indicated in Table 3.
2019-2020 NOAA NGS topobathymetric lidar: Hurricane Michael (NW Florida) data set
An additional supplemental data source was the NOAA Michael topobathymetric lidar project area acquired between November 2019 and July 2020 by Quantum Spatial using a Leica Chiroptera 4X topobathymetric lidar system (Figure 3). Details for this dataset can be found in the metadata on the NOAA Digital Coast (https://www.fisheries.noaa.gov/inport/item/69189).
2015–2025 comparison in the “Phoenix”
The pilot (2015) project dataset was focused on the volumetric measurements in the “Phoenix” portion of Kings Bay, so the bathymetric surface comparison to the 2025 CZMIL-2 dataset was limited to that area. The bathymetric DEMs for the “Phoenix” contained 536,354 2.5′ x 2.5′ cells. The horizontal and vertical datums were adjusted using VDatum (https://vdatum.noaa.gov/) to match the 2025 data set, and a difference DEM was constructed by subtracting the elevation values of the 2015 surface from the 2025 surface (Figure 6).
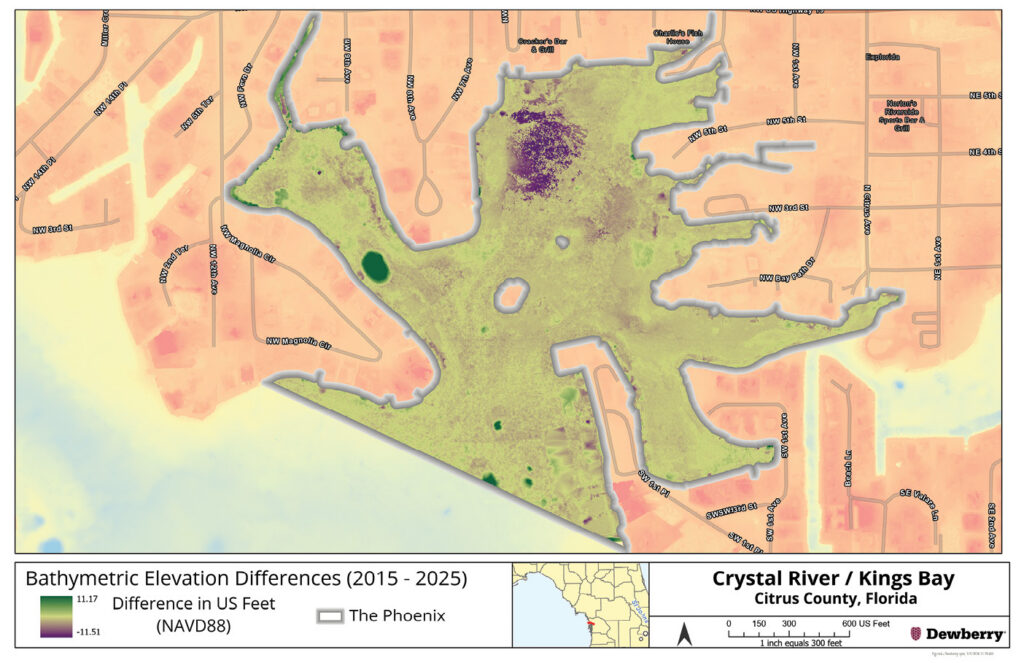
Figure 6: Difference DEM for the “Phoenix” area of Kings Bay constructed by subtracting the 2015 DEM from the 2025 DEM.
The difference DEM (Figure 6) revealed elevation differences ranging from -11.5 to +11.1 feet, with an average difference indicating that the 2025 DEM was 0.50′ lower than the 2015 DEM. The standard deviation around the mean (±1.12 feet) and the skewness (1.56) suggests a normal distribution of the error (Table 4; Figure 7).
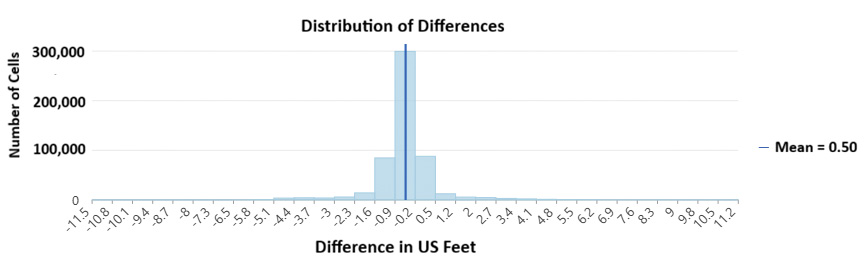
Figure 7: Distribution of differences in the difference DEM (entire dataset).
The largest differences were primarily localized to two areas (Figure 6). The -11 foot difference corresponds to a deep pit that was either missed or not present in the 2015 survey. Examination of the known springs from the Florida Geological Survey in Kings Bay does not indicate a spring at or near that location. SWFWMD Submerged Aquatic Vegetation (SAV) mapping station 101 is near this area and has been consistently between 5.0-6.5 feet deeper since 2021.
The converse, i.e., areas where the 2025 elevations are above those from 2015, occur mostly in a diffuse area in the “wing” of the “Phoenix” (Figure 6). This region is reasonably close to the commercial areas of the bay and probably has been experiencing sedimentation over the past 10 years. While kayaking through here recently, we noticed that the water was only a foot or two deep. SWFWMD does not have an SAV location in this specific area, but stations 1, 2, and 50 are nearby and their water depths can be less than three feet. Sediments have been moving around in this system for decades, and recent hurricanes (Figure 4) could have changed the bathymetry. For example, Hurricane Helene (late September 2024) deposited considerable sediments along the Springs Coast with reports of 1-2 inches of “muck” in people’s houses. Additional storms in the area since 2015, for example, Idalia (August 2023), Hermine (August 2024), and Helene (September 2024), each brought storm surge into the bay while others, such as Ian (September 2022) and Milton (October 2024), caused reverse storm surge.
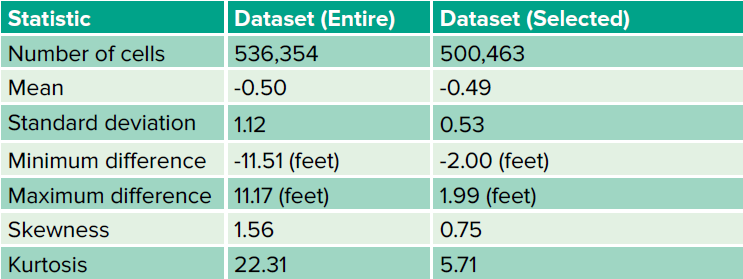
Table 4: Statistical summary for the difference DEM. The “Dataset (Entire)” column reports statistics for all cells within the “Phoenix” area, while the “Dataset (Selected)” reports statistics for the same area with deep and shallow regions excluded.
When the deep pit and shallow areas are removed from the analysis (Table 4, Dataset (Selected)) the mean difference among the remaining 500,463 cells decreases only to 0.49′ (from 0.50′), but the standard deviation decreases significantly from ±1.12′ to ±0.53′, and the skewness decreases by almost 50% to 0.75. These values suggest that while the outliers in the pit and shallow areas contributed to the overall spread of the differences, they had little effect on the majority of the cell differences.
Conclusions
The differences in the mean, standard deviation, and skewness when the pit and shallow water cells are removed suggests (1) a normal distribution of the differences, (2) that the pit and shallow areas are real, and (3) that the CZMIL and CZMIL-2 topobathymetric lidar elevations are consistent within their margin of error (0.6’) over the 10-year period.
In general, we find the two CZMIL topobathymetric lidar datasets to be consistent over the intervening decade. Considering changes in Kings Bay caused by different phenomena, the areas of major differences are minimal. This suggests that (1) CZMIL topobathymetric lidar, and probably topobathymetric lidar in general, as evidenced by the NOAA 2020 survey, produces consistent and reliable bathymetry for inland waterways, and (2) topobathymetric surveys separated temporally by a decade can help to understand general changes in bathymetry. 
References
Karlin, A, A. Nayegandhi and J. F. Owens, 2017. Topo-bathymetric lidar on the Springs Coast of Florida, LIDAR Magazine, 7(4): 36-43.
Karlin, A, J. F. Owens, E. Klipp and A. Nayegandhi, 2020. Surveying inland waterways: A Florida case study, LIDAR Magazine, 10(6): 56–62.
Karlin, A., D. Rogers and E. Klipp, 2023. Topobathymetric lidar reveals hidden springs in Florida, LIDAR Magazine, 13(2): 6–10.
Quadros, N., 2013. Unlocking the characteristics of bathymetric lidar sensors, LIDAR Magazine, 3(6): 62–66.
 Alvan “Al” Karlin, PhD, CMS-L, GISP is a senior geospatial scientist at Dewberry, formerly from SWFWMD, where he managed all the remote sensing and lidar-related projects in mapping and GIS. With Dewberry he serves as a consultant on Florida-related lidar and imagery projects, as well as general GIS-related projects. He has a PhD in computational theoretical genetics from Miami University in Ohio. He is the current president of ASPRS, an ASPRS Certified Mapping Scientist – Lidar, and a GIS Certification Institute Professional.
 Nicole Hewitt, CMS-GIS, GISP, is the remote sensing geospatial analyst for the mapping & GIS section of SWFWMD, where she manages photogrammetry and lidar projects. She began her career at SWFWMD in 2014 after graduating from the University of Florida (UF). She now serves on the UF Geomatics Program Advisory Committee and is a long-standing member of the Florida Surveying & Mapping Society as well as ASPRS.
 Madison Trowbridge, PhD is the Springs Scientist and Springs Team Lead for SWFWMD. She holds a PhD in cell and molecular biology from the University of South Florida. Her doctoral work focused on subsurface microbial ecology, including Florida springs, before joining SWFWMD in 2020. She has published four research papers and has worked on spring systems for over a decade.