By combining high-density aerial lidar and deep learning, it becomes possible to reveal the forests of Neuchâtel with an unprecedented level of detail. By leveraging point clouds with over 100 points/m² (ppsm) and very high-resolution derived models, the Neuchâtel government GIS center (SITN) offers products that foresters can use directly, ranging from simple raster products, such as the canopy height model, to the most advanced, derived directly from the 3D point cloud. These methods enable tree crown segmentation, followed by the classification of 20 major tree species using aerial lidar signatures that combine geometry and intensity, achieving an overall classification accuracy of approximately 80%, and over 90% for conifers. This innovation offers a comprehensive, detailed, and dynamic view of Neuchâtel’s forests, paving the way for nationwide automated inventories, precise estimates of forest resources, and better understanding and anticipation of climate change impacts on an ecosystem under significant pressure.
Introduction
For the past 25 years, the Neuchâtel government GIS center (SITN) has been using lidar surveys to map forests, in close collaboration with the canton’s forestry service (SFFN). Lidar data provides a detailed, objective 3D view of forest structure. This revolutionary technology, available for civilian applications since the mid-1990s, continues to improve and become more widely accessible. While the first sensors used in the early 2000s generated 20,000 measurements per second at a density of 1 ppsm, current sensors operate at frequencies of up to 4 million pulses per second, generating point clouds with a density of over 100 ppsm at a flight altitude of 1,000 m, making it possible to cover a Swiss canton in just a few days. Many countries have created, or are in the process of creating, national lidar coverage (France, Spain, Portugal, Germany, Italy, US, etc.). Switzerland, a pioneer in this field, is currently conducting its third national survey with Swisstopo’s swissSURFACE3D product, updated every six years. Several Swiss cantons supplement these surveys to achieve higher point density or more frequent updates. This is the case in Neuchâtel, which aims for a complete survey every three years. SITN currently has six aerial lidar surveys of its territory: 2001 (1 ppsm), 2010 (7 ppsm), 2016 (30 ppsm), 2019 (16 ppsm), 2022 (100 ppsm) and 2025 (100 ppsm). Figure 1 is an illustration of one of the sensors used. In the last two surveys, the density rises to an average of 250 ppsm above forest counting all returns, corresponding to ~10,000 to ~30,000 points per tree. This high density makes it possible to extract detailed information for each individual tree.
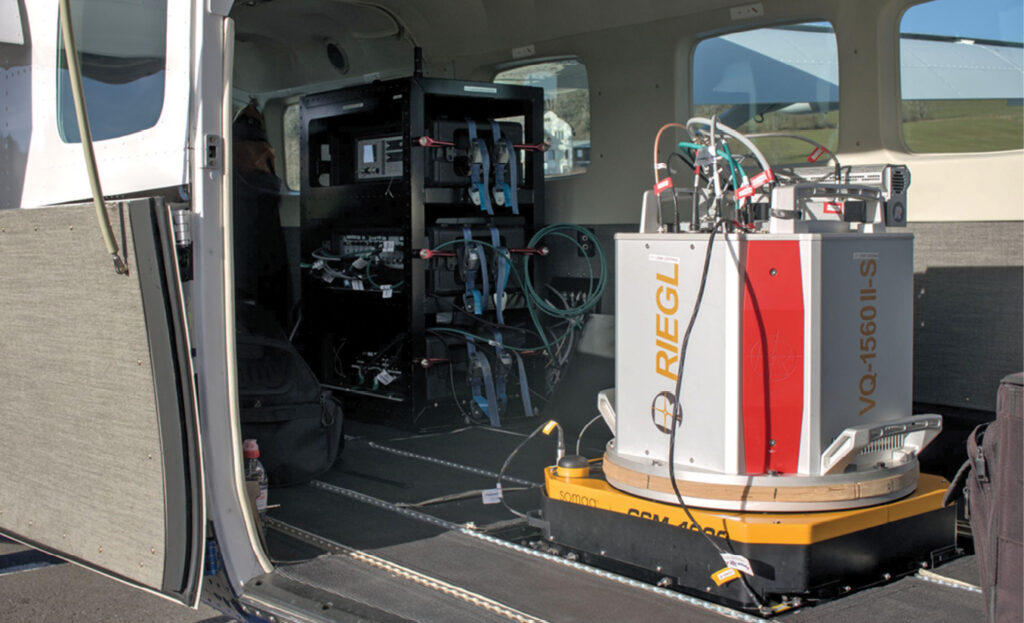
Figure 1: RIEGL VQ-1560 II-S lidar sensor from Swiss Flight Services used for the 2022 and 2025 surveys.
A three-year update cycle enables regular monitoring of forests, which are subject to very high stresses related to climate change: drought, heat waves, and extreme weather events (storm in La Chaux-de-Fonds in 2023 with over 30,000 trees destroyed; late snowstorm in Valais in April 2025 with over 100,000 trees destroyed); dieback (beech, spruce). Figure 2 shows the variation in data density and the ability of the data to describe the canopy for each individual tree. It illustrates the difference in the amount of information that can be extracted depending on the density of the point clouds.

Figure 2: Changes in data density as lidar sensors improve.
SITN has recently developed deep learning methods to produce high-resolution forest maps across Neuchâtel (30,000 hectares), identifying approximately 10 million trees and classifying them into 20 species. Beyond tree species identification — a crucial indicator for understanding how forests adapt to climate change — the ultimate goal is to determine or estimate as many dendrometric variables as possible: height, crown, tree diameter, trunk diameter, standing timber volume and stand structure.
This innovation builds on many years of experience, combining the expertise of SFFN, SITN engineers, and close collaboration with the research community, particularly EPFL (two PhD theses: G. Gachet in 2009 and M. Parkan in 2018).
Lidar products and use cases for forestry
Several products derived from lidar surveys, such as digital terrain models (DTMs), digital surface models (DSMs), canopy height models (CHMs) and canopy evolution models (ΔCHMs), have become tools used daily by forestry professionals (Figure 3). These raster products (images, regular grids) are easy to use and simple to generate, and do not necessarily require very high lidar density, although their quality improves as density increases. SITN currently works with cantonal DTMs and DSMs with a high resolution of 10 cm, and CHMs and ΔCHMs with a resolution of 20 cm. Lower resolutions can also be used, depending on the application. Table 1 lists some applications of these products.
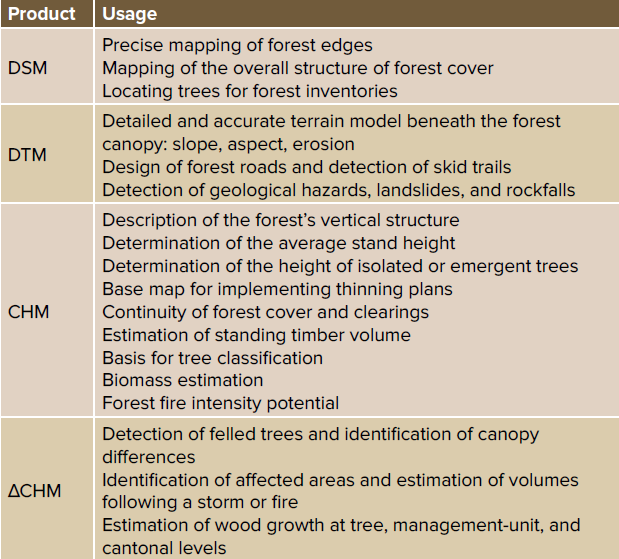
Table 1: Some uses of forest management products.
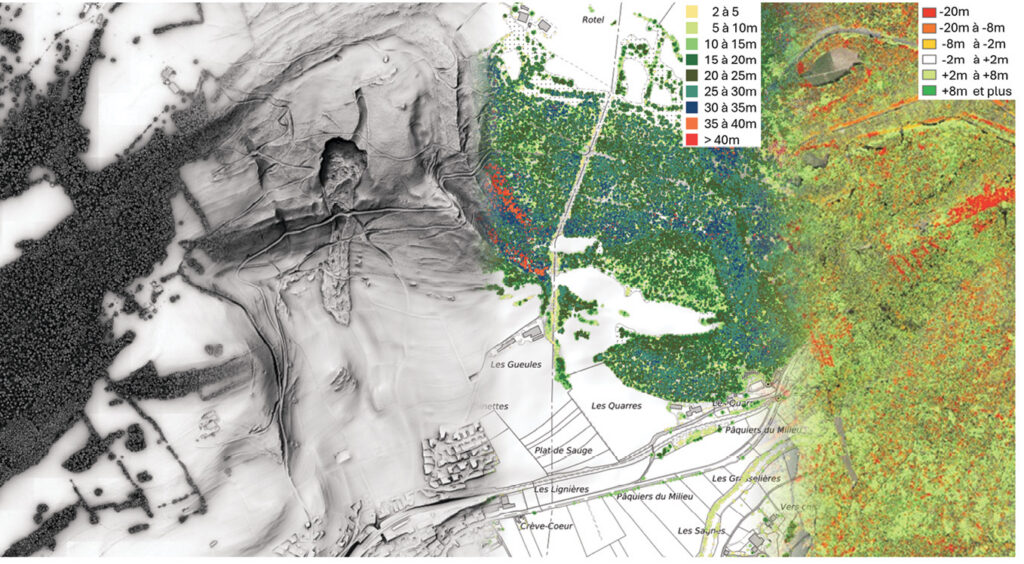
Figure 3: From left to right — DSM, DTM, CHM, and canopy change model (ΔCHM).
- The DSM is interpolated from the point cloud using the spike-free DSM algorithm, and the shading is calculated using ambient occlusion, which conveys 3D information better than directional shading.
- The DTM reveals numerous details (skid trails) beneath the canopy thanks to the high point density and the canopy-penetrating capability of lidar. DTM shading is calculated using an algorithm from the Relief Visualization Toolbox (Archéo Blend).
- The SITN CHM is calculated directly from the height-normalized point cloud (terrain elevation removed). It can also be calculated by subtracting the DTM from the DSM.
- The CHM evolution is calculated by differencing the CHMs from different surveys.
Tree detection
Recent innovations at SITN have made it possible to segment the point cloud by tree and classify tree species of Neuchâtel’s forests. To achieve this objective, the following challenges had to be addressed:
- Acquiring high-density lidar data (>100 ppsm)
- Managing large volumes of data, over 100 billion measurements in the lidar point cloud, i.e., several terabytes (4 TB in LAS and 1 TB in LAZ COPC)
- Generating derived products: classification of lidar points, calculation of DSM, DTM, and CHMs
- Developing a tree crown segmentation algorithm, i.e., delineating the footprint of each tree
- Developing an algorithm to identify tree species
Segmentation of tree crowns
To characterize forests at the individual tree level, the first step is to separate the trees from one another. This process is called instance segmentation, from the Latin word segmentum (“piece” or “part”), itself derived from secare (“to cut”).
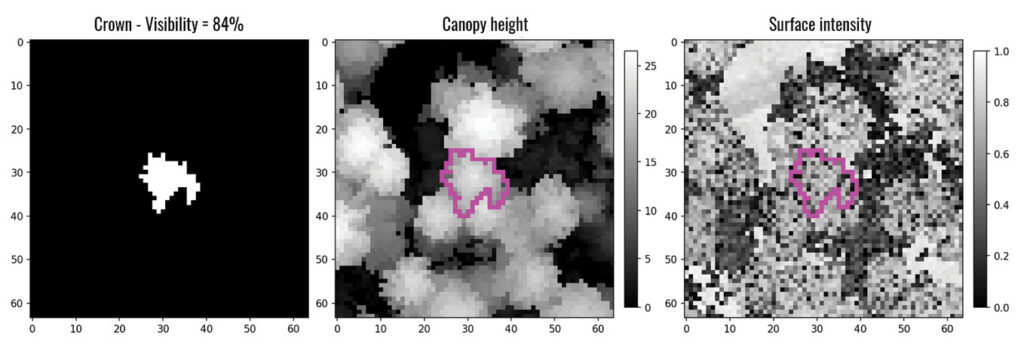
Figure 4: On the left, the footprint of a tree canopy (in white) that we are trying to predict (it is also overlaid in pink on the other two images for illustrative purposes). In the center, a section of the canopy height model. On the right, a section of the lidar echo intensity model.
This segmentation problem, which can be applied to various types of data (2D/3D raster, 3D point cloud), has been extensively studied in forest remote sensing. It is particularly complex in the irregular, dense, and mixed forests found in Neuchâtel. It has not been fully resolved to date, although considerable progress has been made in recent years thanks to the rise of methods based on deep neural networks (deep learning), the availability of high-resolution training data, and access to significant computational power, particularly through the use of high-end Graphics Processing Units (GPUs). The most recent state-of-the-art segmentation methods actually produce excellent results by working directly on 3D data. However, they remain rarely implemented at regional or national scales, mainly because they place high demands on computational resources and data quality (resolution).
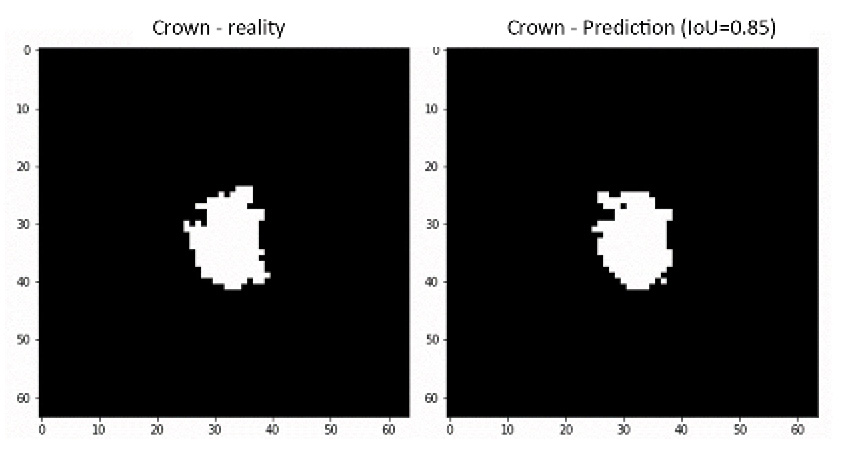
Figure 5: Example of a comparison between an actual tree crown (manually measured reference) on the left and the prediction from the segmentation model on the right. The similarity score here is 85%.
The segmentation method developed for this project does not aim to achieve state-of-the-art results, but rather to provide a generalizable solution, suited to operational implementation at a regional scale. It uses a deep neural network trained to predict tree crown boundaries based on canopy height and the intensity of lidar echoes (Figure 4). The canopy height model provides information on the shape of the crown, while the lidar echo intensity model is related to its reflectance at the laser’s operating wavelength (near infrared, 1064 nm) and is particularly useful for distinguishing between evergreen and deciduous trees in leaf-off surveys. These two variables provide both geometric and radiometric discrimination that helps distinguish adjacent crowns. An initial training phase is used to optimize the model parameters by repeatedly comparing thousands of manually delineated reference crowns with the model outputs. Agreement between the reference and predicted crown footprints is quantified using a shape-overlap score (Figure 5), with values approaching 100% indicating a close match. An automated optimization procedure then iteratively adjusts the parameters until improvements in the score level off across the training dataset. In a second phase, the optimized model is evaluated on a test dataset (i.e. tree crowns that were not used for training but have known reference footprints). This allows its performance on unknown data to be estimated. The results of this phase indicate good generalization performance, with similarity scores generally ranging between 80% and 90%. However, there are cases of poorly segmented forest patches, particularly in deciduous forest areas where the canopy structure is homogeneous and where individual trees are difficult to distinguish, even to the human eye.
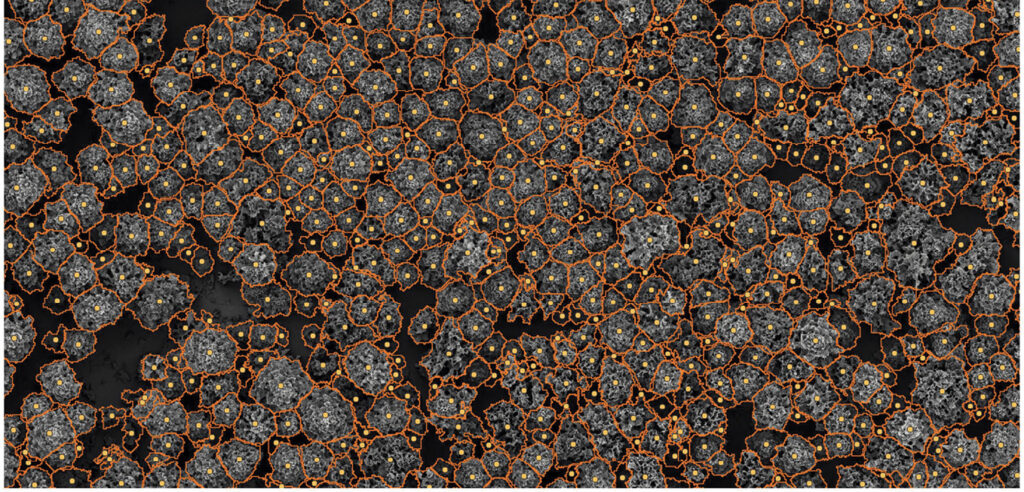
Figure 6: Segmentation results showing the crown footprints (in orange) and their centroids (yellow dots).
Finally, the model is applied to the entire dataset to produce a segmentation map at the canton level (see excerpt in Figure 6). To do this, it is run iteratively to small analysis windows centered on candidate locations, starting with the tallest trees, until the entire territory is covered. The resulting 2D segmentation, draped over the point cloud, is shown in Figure 7.
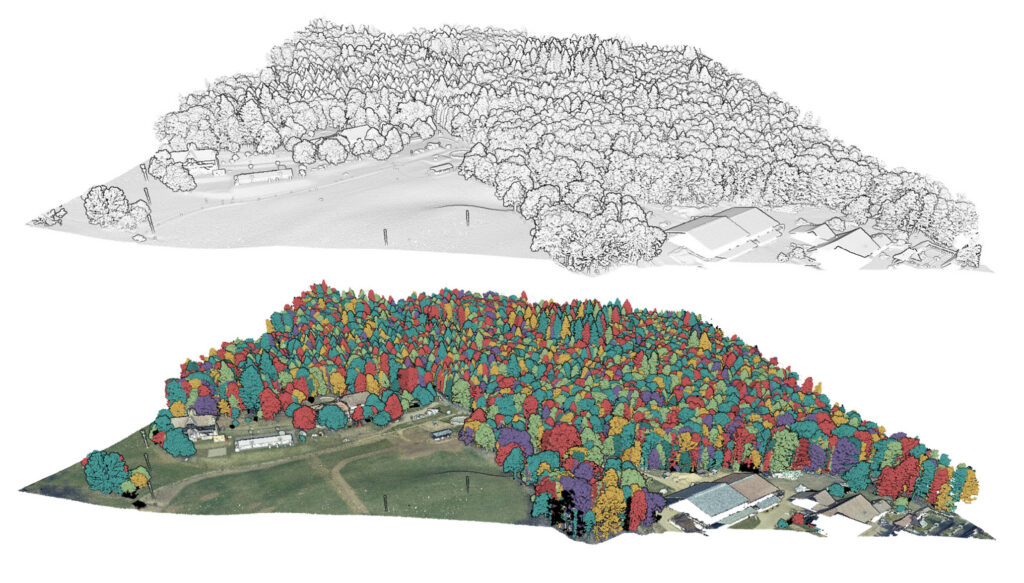
Figure 7: Raw point cloud (top) and the same cloud colored by upper-canopy segmentation (bottom), with points grouped by tree crown.
In other words, the canopy is dissected, tree by tree, from the highest to the smallest, like pieces of a puzzle. For practical reasons, the canton is divided into 500 m by 500 m tiles with overlap. A notable limitation of this method is that it uses only the information visible in the upper canopy. Trees located in the understory are therefore only partially segmented or not detected. There is room for improvement, particularly with the addition of training data to better represent the actual variability of tree crowns and thus increase the robustness of the method.
Classification of tree species
Tree species are also classified using an artificial intelligence algorithm. Instead of working directly with the lidar point cloud, which requires significant computing power, the algorithm uses two-dimensional profiles. For each tree surveyed, the algorithm extracts three vertical cross-sections and an aerial view from the point cloud. The points extracted are then converted into two images, one showing the density of lidar points, the other their return intensity. This intensity is a key parameter for classification. An example for two trees is provided in Figure 8.
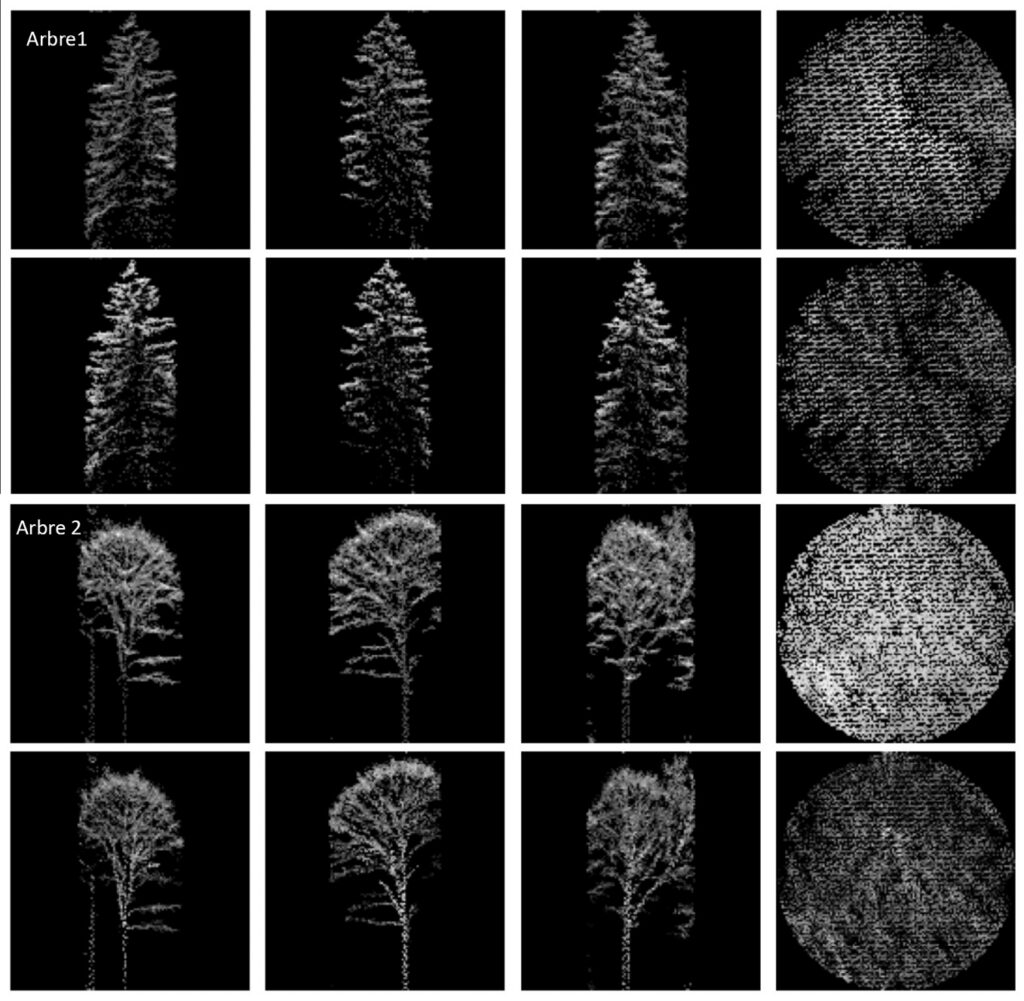
Figure 8: Profiles extracted from the point cloud for two trees. The top line in each pair represents the point density, and the bottom line represents the lidar return intensity.
Since the lidar beam operates at an infrared wavelength (1064 nm), it is partially absorbed by vegetation, to varying degrees depending on the plant type. Subtle changes in the laser’s return intensity then provide valuable information about the species of the tree observed. Once the cross-sections have been extracted from the point cloud, they serve as input to the artificial intelligence model tasked with classifying tree species. This uses a neural network (deep learning) that must first be trained.
During this phase, the model learns to distinguish between tree species using annotated data, i.e. data for which the true species is known. Whenever the model makes a mistake, its parameters are adjusted to improve its performance. By repeating this process a very large number of times, on a large dataset, the result is a trained model that classifies tree species as accurately as the data allow.
The model was developed and trained entirely in-house by the SITN team. The data used for training includes more than 30,000 trees surveyed by the Neuchâtel Forestry Service and the Lyss Forestry Competence Center, plus several thousand trees provided by the cities of La Chaux-de-Fonds and Neuchâtel, and by the forest inventory of the canton of Zug.
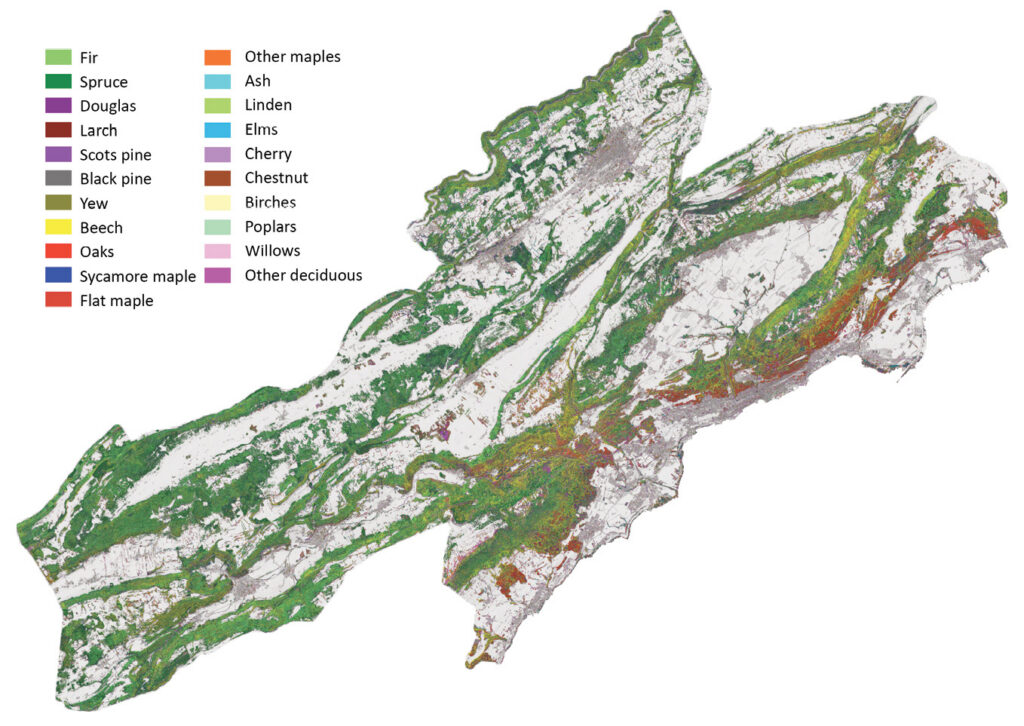
Figure 9: First map of the canton featuring automated tree species identification.
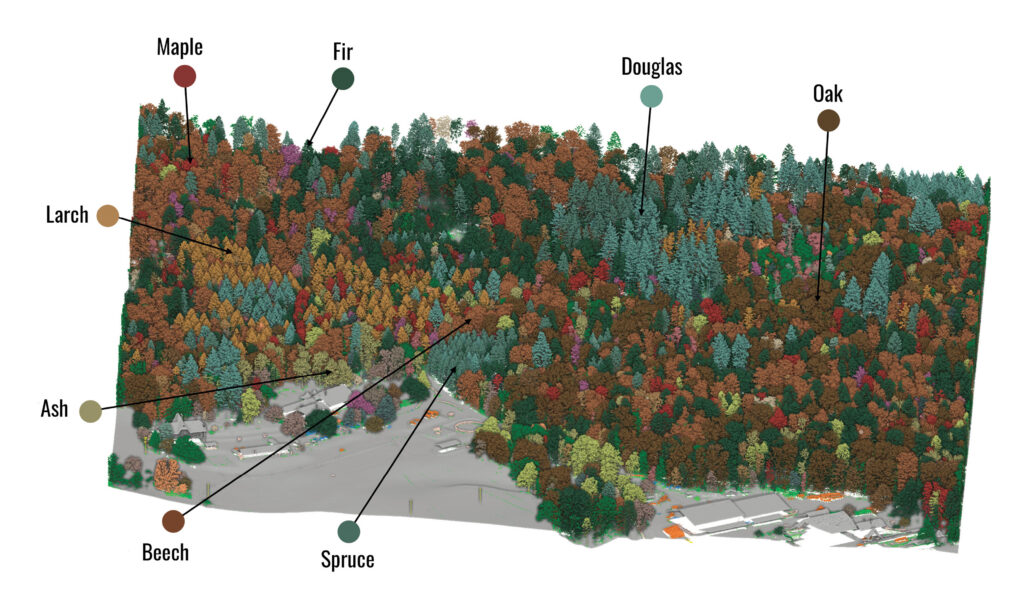
With nearly two million parameters, the model is trained in about ten hours on a desktop computer fitted with a GPU suited to AI workloads, which allows the model to be adjusted quickly and several specialized versions to be created. When trained on the 20 most common tree species in the canton of Neuchâtel, using trees at least 8 m tall, the model correctly classifies over 80% of trees, despite the diversity and complexity of Neuchâtel’s forests. The 2D map shown in Figure 9 is the first published canton-wide tree species map of Neuchâtel, with approximately 10 million trees identified. It can be used to analyze both the overall distribution of tree species and their detailed spatial patterns. Figure 10 shows a forest sector where the point cloud has been colorized by tree species, while Figure 11 presents a cross-section of the segmented and classified point cloud.
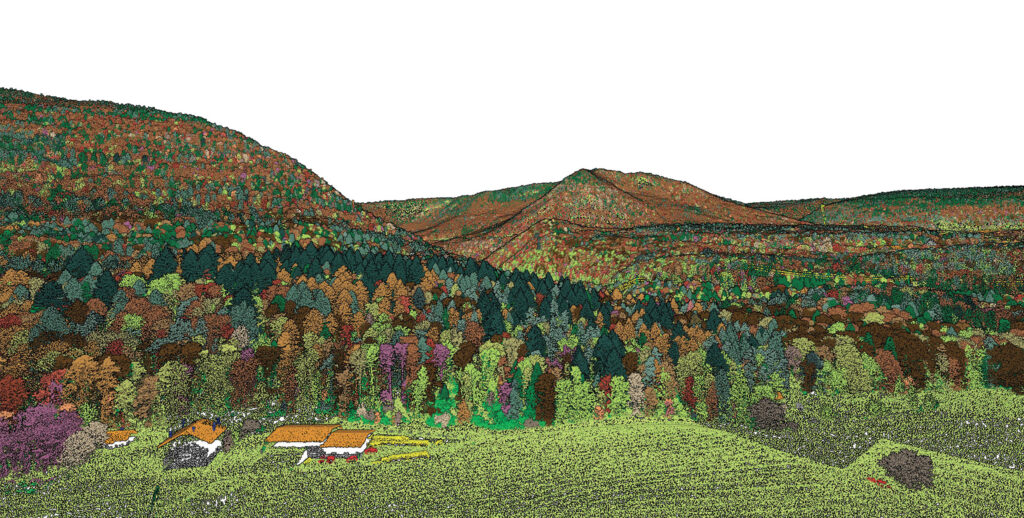
Figure 10: The tree species identification results generated in 2D were reprojected onto the lidar point cloud to enable a virtual representation of the forest: https://sitn.ne.ch/lidar.
Some species, however, are harder to tell apart. Norway maple, for example, is often mistaken for other maples, for which the model has too little training data.

Figure 11: Cross-section of a high-density point cloud segmented into individual trees and classified by species.
Overall, conifers are much better differentiated than broadleaf species (Table 2). This is readily explained by their characteristic shape and by the fact that they keep their needles in winter, when the lidar data is acquired. Using the trained classification model, it is possible, thanks to the tree segmentation presented in the previous section, to determine the species of all trees in the canopy on the entire territory of Neuchâtel. The result is an automatic identification of tree species throughout the canton, down to the individual tree — information that did not previously exist. Such an automatic inventory supports precise, large-scale analysis of species distribution and makes it possible to monitor how it changes over time. The model is not perfect. Like any AI algorithm, it makes mistakes, sometimes systematically. We note that trees at the forest edge are often misidentified, and the same holds true for isolated or small trees. The training dataset is also biased: some species are underrepresented. Finally, the algorithm focuses only on trees in the canopy and in forested areas. Trees located in the understory are much more difficult to distinguish. Urban areas contain a far wider range of species, often planted and pruned, which makes them harder to tell apart. SITN is actively working to develop models able to handle such trees, as climate adaptation challenges are also very significant in urban environments.
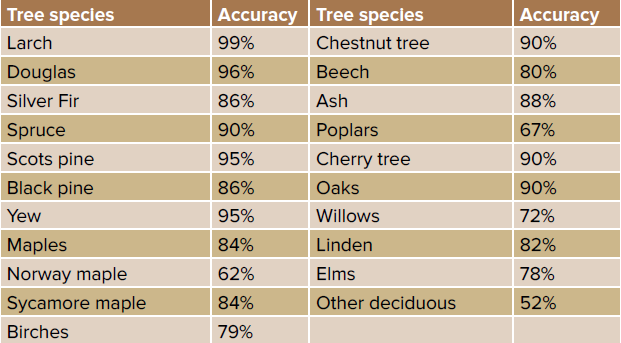
Table 2: Accuracy of tree species identification using the SITN model.
Conclusion and outlook
Since the advent of lidar data in the early 2000s, SITN’s goal has been to turn the large and relatively complex datasets produced by this advanced measurement technology into operational products and maps directly usable by forestry professionals. The idea is to develop methods to automatically interpret the forest, from the cantonal scale for an overview down to the individual tree for detailed analysis. A very close and effective collaboration has been established with the Neuchâtel Forest Service to adapt data acquisition and products to forestry needs. The segmentation of individual trees and the detection of major tree species represents a significant step toward achieving this goal. As new generations of high-density lidar surveys become available, the long-term vision is to enable nationwide, tree-level forest inventories in Switzerland and to inspire similar initiatives internationally.
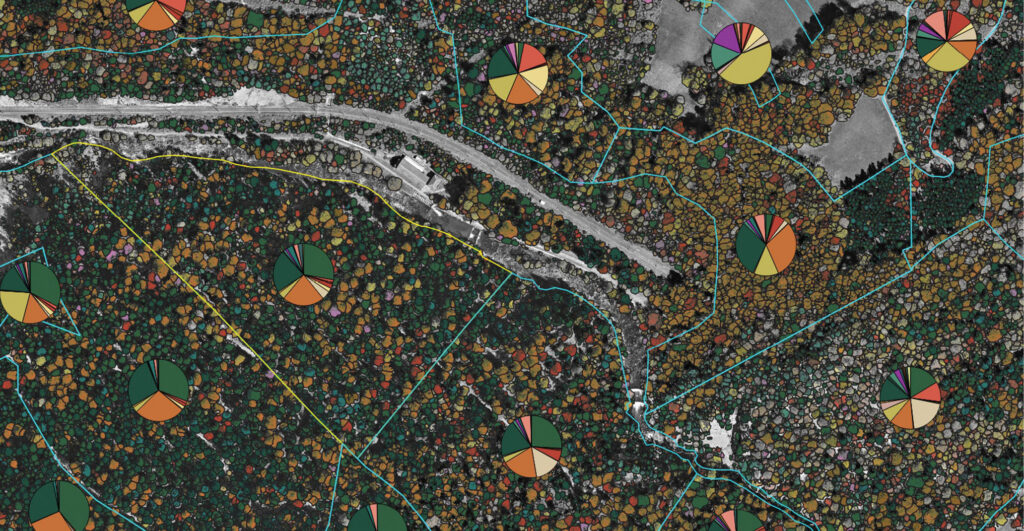
Figure 12: Tree attributes derived from lidar: distribution of tree species by management unit.
We continue to work on improving our algorithms to enhance the accuracy of our products and extract new metrics. These include, in particular, the estimation of diameters and volumes, paving the way for automated inventories that complement current field inventories, where tree species and dendrometric statistics can be computed for each forest management unit as illustrated in Figure 12. Work has also begun on analyzing understory vegetation, with promising early results. SITN welcomes collaborations on lidar-based forest mapping.
The challenges we face in preserving our forest ecosystems, which are under pressure from climate change, are immense. Lidar technology and geomatics tools will play a crucial role in understanding, monitoring, and preserving forest ecosystems under climate change. 
Acknowledgements
We thank the teams at Swiss Flight Services and Flotron for the exceptional quality of the data provided for the 2022 and 2025 lidar surveys, and forestry engineers Pascal Junod, Romain Blanc, and Frédéric Wyss for a demanding and exemplary collaboration.
Links and notes
Further information is available from the authors: Marc Riedo (marc.riedo@ne.ch), Matthew Parkan (matthew.parkan@ne.ch) and Corentin Junod (corentin.junod@ne.ch). All three work at the Service de la géomatique et du registre foncier, Système d’Information du Territoire Neuchâtelois – SITN, Tivoli 22, CH-2000 Neuchâtel, Switzerland.
SITN and ASIT are organizing the Swiss lidar 2026 conference on November 10, 2026, at Le Cube in Morges. Save the date if you’d like to learn more about the data and the technology behind it.
The following links provide more information on topics mentioned in the article:
- Digital surface models (DSMs): https://sitn.ne.ch/s/geOuD
- Calculation of DSMs using ambient occlusion, C. Junod: https://github.com/sitn/DSM-Occlusion
- Digital elevation models (DEMs): https://sitn.ne.ch/s/34bcQ
- Relief visualization toolbox, Ž. Kokalj et al.: https://rvt-py.readthedocs.io/en/latest
- Spikefree DSM: A. Khosravipour, A. K. Skidmore, M. Isenburg: https://rapidlasso.de/generating-spike-free-digital-surface-modelsfrom-lidar
- Canopy height models (CHMs): https://sitn.ne.ch/s/qWJzi
- Surface vs. terrain comparison: https://sitn.ne.ch/s/lJpi
- Canopy differences: https://sitn.ne.ch/s/4ZrbW
- Differences in DSM for storm damage: https://sitn.ne.ch/s/t00So
Marc Riedo is head of the Neuchâtel GIS Center – SITN. Dr. Matthew Parkan and Corentin Junod are project managers at SITN.