TCarta’s water clarity dashboard, HydroIQ, provides daily measurements contextualized against historical trends to inform flight operations, project timelines, and reflight decision-making.
Topobathymetric project success depends on aligning flight operations, including pilot schedules, maintenance windows, and calibration requirements, with short windows where weather and sea-state conditions are optimal. To assess water clarity and sea-state, flight operators and project managers rely on reconnaissance flights and field mobilization, which are costly and have limited geographic coverage. Satellite-based water clarity monitoring addresses these limitations by providing comprehensive coverage of entire waterbodies and coastlines at almost daily frequencies for a fraction of the cost of traditional survey methods. When daily measurements are contextualized within historic trends, the resulting insights improve topobathymetric data quality, lower operational costs and minimize carbon footprints.
The advantages of satellite imagery for water clarity monitoring
Modern satellite constellations provide unparalleled spatial and temporal coverage that enables both historical and near-daily water clarity assessment in a wide range of aquatic environments ranging from open ocean to rivers and lakes. In coastal environments, water clarity derived from the Sentinel-3 Ocean and Land Color Instrument (OLCI) is the gold standard. Sentinel-3 OLCI observations have a 300 m spatial resolution, are available within three hours of capture at near-daily frequency and have a historical archive reaching back 10 years to 2016. Because Sentinel-3 OLCI was designed specifically for aquatic remote sensing, it boasts a uniquely high signal-to-noise ratio and 21 spectral bands from 400 to 1200 nm. This design facilitates atmospheric correction in complex coastal environments as well as enhanced sensitivity to water constituents including suspended sediments, chlorophyll-a, and colored dissolved organic matter.
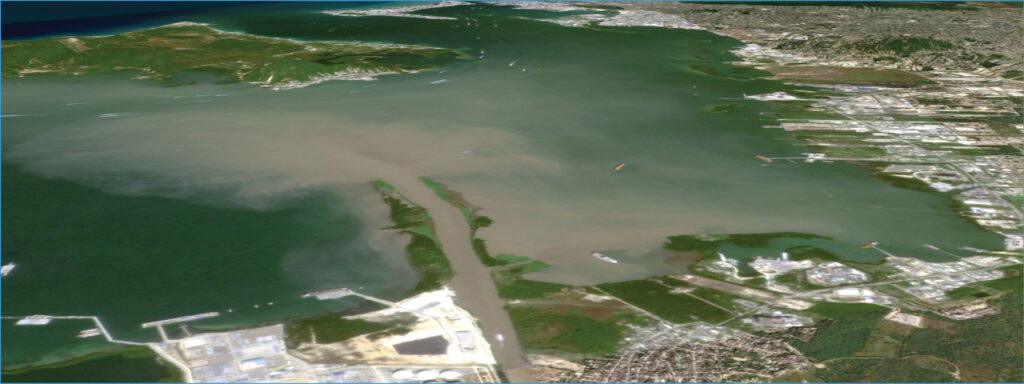
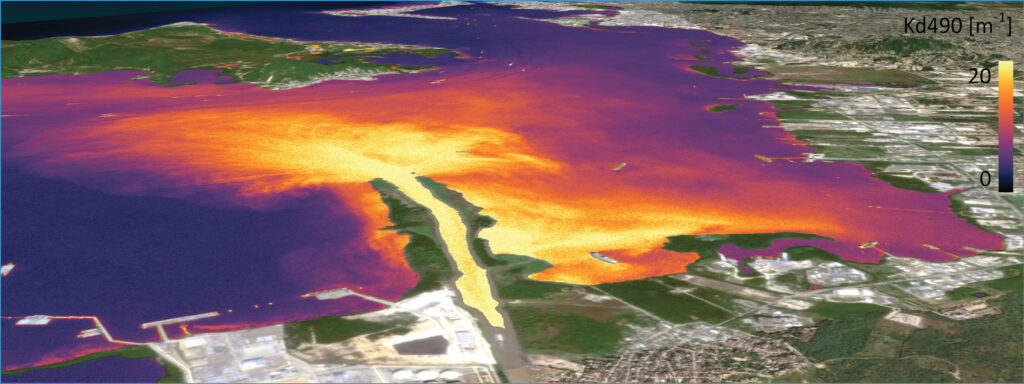
Water clarity estimates in Cartagena Bay highlight turbidity plume extent and intensity. Image source: Planet Labs; basemap source: Vantor; elevation source: USGS.
Given that Sentinel-3 observations are freely available and provide exceptionally high-quality water clarity estimates, they are almost always the best choice for coastal monitoring; however, for projects in rivers, ports, or small inland waterbodies, 300 m Sentinel-3 observations may be too coarse. For these applications, commercial imagery from the 3 m PlanetScope constellation is an appropriate substitute. Like Sentinel-3, PlanetScope imagery is available shortly after capture with near-daily frequency and has a comprehensive historical archive reaching as far back as 2020. With eight spectral bands ranging from coastal blue to near infrared, PlanetScope provides both the spatial and spectral resolution required for monitoring water clarity in optically complex waters where detailed spatial resolution is required.
TCarta’s technology and approach
Daily water clarity measurements from either Sentinel-3 or PlanetScope contextualized against historical trends are the foundation of TCarta’s water clarity dashboard service, HydroIQ. HydroIQ’s analysis and displays are custom-built to support three distinct topobathymetric lidar project phases: initial scoping and project planning, day-to-day flight operations, and reflight decision-making. Importantly, the platform is equipped to facilitate rapid, straightforward interpretation for non-technical users and, at the same time, provide detailed trend information to data specialists.
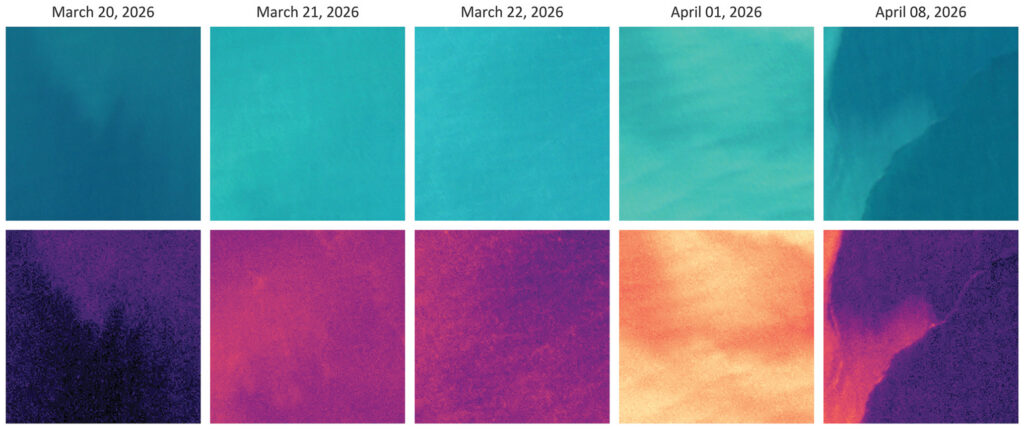
Natural color satellite images (top row) and corresponding Kd490 estimates (bottom row) for a 1 km² monitoring site off the coast of New Zealand. By monitoring a single site over time, users can watch turbidity plumes emerge and disperse in response to rain, winds, and near-shore currents. Image source: Planet Labs.
The primary water clarity parameter behind HydroIQ is the diffuse attenuation coefficient at 490 nm, often referred to as Kd490, which quantifies the rate at which blue light is scattered and absorbed as it moves through the water column. As values increase, water clarity decreases. Complementary parameters may include turbidity, secchi depth, and, in complex waters, chlorophyll-a concentration and the backscattering coefficient at 490 nm.
In aquatic environments, complex atmospheric conditions driven by evaporation and rapidly changing aerosol concentrations present a persistent challenge to satellite-based water clarity monitoring. TCarta addresses these challenges by applying rigorous atmospheric correction to produce accurate and consistent retrievals across a wide range of acquisition conditions and time periods. In addition to atmospheric correction, detailed cloud masking makes it possible to use observations where just a small portion of the monitoring area is visible. This significantly increases the total number of usable observations and makes water clarity monitoring possible even in persistently cloudy environments.
Beyond the challenges associated with atmospheric conditions, coastal waters are highly dynamic and optically complex. Water clarity, governed by suspended sediments and organic matter concentrations, shifts considerably across environments and changes rapidly due to rainfall, tidal cycles, and wind events. In this context, water clarity parameters are estimated using methods tailored to site-specific conditions, ranging from band ratios and semi-empirical algorithms to machine learning and in-water radiative transfer models. Where robust in-situ data is available, location-specific algorithms can be developed to improve accuracy and extend the spatial and temporal applicability of direct measurements.
Historical insights support project planning
Even before a project begins, historical water clarity data reveal site-specific seasonality and overall turbidity baselines which can be used to inform bid submission, client expectations, and resource planning and staging. Water clarity often follows predictable seasonal patterns driven by factors such as storm frequency, snowmelt, and river discharge. Hence understanding these patterns is essential for structuring project timelines around windows when conditions are mostly likely to support successful collection. To address this, TCarta calculates the average water clarity for each month across six to ten years, depending on data availability. The resulting monthly estimates are insulated against year-to-year fluctuations and reveal when, on average, conditions are optimal for bathymetric lidar collection.
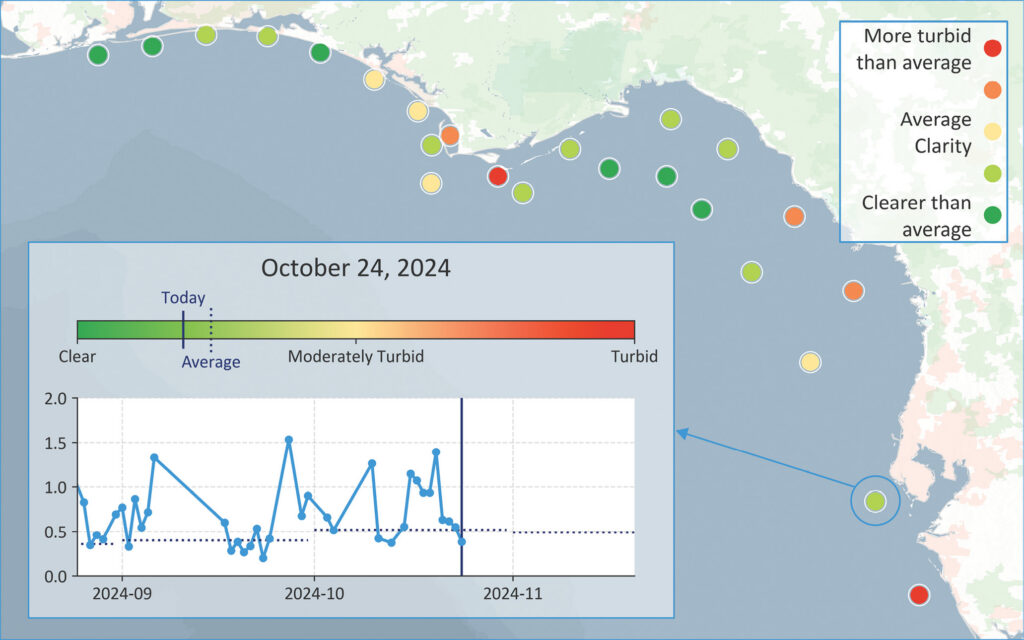
Daily water clarity relative to the monthly average for monitoring sites in Florida. Green points represent sites that are clearer than average; red shows sites where recent conditions are more turbid than expected. The site pop-up provides additional context. This example assumes that today’s date is 24 October 2024. Basemap source: Esri.
Beyond seasonality, historical averages highlight persistently turbid, or, conversely, clear locations. In an industry where water clarity specifications are often based on optimal or manufacturer-rated conditions, real-world site-specific information facilitates strategic operational sequencing and sets realistic client expectations for the most challenging sites. Historical water clarity analysis gives project teams key evidence to support conversations with clients from the earliest stages of engagement, including project scoping. Ultimately, the goal is to ensure that specifications reflect what a site can realistically deliver, reducing the likelihood of scope changes, budget overruns, and unmet expectations.
Daily observations streamline operational decision-making
Once a project is underway, HydroIQ helps maximize the quality and depth penetration of surveys by supporting flight decision-making with user-friendly data display and comprehensive daily coverage across the survey area. For this purpose, the dashboard provides two complementary views of daily measurements: absolute water clarity and water clarity relative to the monthly historical average. This dual perspective is particularly valuable because it highlights time-sensitive collection opportunities. For example, the absolute view may identify five sites with acceptable clarity on a given day. The relative view adds important context, revealing that four of those sites are consistently clear and could be surveyed at any point during the project window, while the fifth is experiencing unusually favorable conditions relative to its monthly average. In this case, the relative view helps identify an ephemeral opportunity that could be missed without the kind of comprehensive view satellite-based data can provide. Conversely, HydroIQ can flag sites where conditions may appear acceptable in absolute terms but are actually more turbid than their historical average. In this case, delaying collection could yield better results. Together, these two perspectives give flight teams a more complete picture of where and when to fly, reducing the risk of collecting data in suboptimal conditions.
Because HydroIQ is designed so that both technical and non-technical stakeholders can engage with the data, it is also a valuable tool for keeping all parties informed and aligned as projects evolve. For clients, the ability to view real-time conditions alongside historical context provides confidence that flight teams are operating efficiently. Shared use of the platform also builds a common understanding of how recent conditions influence project progress and gives clients the opportunity to give input based on both HydroIQ and their own contextual knowledge.
Water clarity trends guide reflight decisions
Reflight decision-making can have huge implications for overall data quality, project cost, timeline, and carbon footprint. HydroIQ supports reflights by providing site-specific popups that contextualize water clarity on any given day within historical averages and other recent observations. This allows teams to answer key questions such as: were conditions during the initial collection attempt unusually poor, and is there good reason to expect better results by flying again? If HydroIQ shows that conditions at the time of collection were well below the historical average, a reflight is likely to yield improvement. If conditions were already near or above average, the basis for reflight is weaker and the corresponding cost is harder to justify. By framing reflight decisions with both observed and historical contexts, HydroIQ helps teams avoid costly mobilizations with limited benefit while ensuring that genuinely poor collection conditions don’t go unaddressed. Furthermore, HydroIQ can be used to communicate the argument for reflight to clients. Rather than relying on qualitative assessments, project teams can point to specific water clarity measurements to build a shared understanding of the likelihood that reflying will improve returns.
HydroIQ supports NV5 and LINZ in New Zealand
Since early 2025, HydroIQ has supported NV5 Geospatial’s topobathymetric lidar operations over New Zealand’s South Island as part of Toitū Te Whenua, Land Information New Zealand’s 3D Coastal Mapping Programme. This program is an ambitious three-year initiative to capture high-resolution elevation and seafloor data across 40% of New Zealand’s coastline in support of hazard modeling, infrastructure resilience, and long-term coastal planning. New Zealand presents some of the most challenging survey conditions in the Southern Hemisphere, including sediment-laden surf zones, steep coastal topography and unpredictable weather. In this context HydroIQ has been an essential asset for NV5. With more than 50 sites placed at key river mouths and survey locations, HydroIQ gives NV5’s flight teams a persistent, near-daily view of water clarity conditions across the entire survey area, supporting real-time flight decisions and ensuring collection is prioritized when and where conditions are most favorable.
Feedback from LINZ indicated the value of the system. “Ultimately, this service helped improve data quality, lower NV5’s operational costs, increase efficiency and minimize the project’s carbon footprint,” commented Brad Cooper, Senior Hydrographic Surveyor, LINZ.
As the project approaches the end of its second collection season, HydroIQ has increasingly supported reflight decision-making. For NV5, HydroIQ provides the operational context needed to determine whether a reflight is likely to improve returns or confirm that initial results reflect persistent conditions which are unlikely to improve within the project timeline. For LINZ, access to the same data supports informed oversight and clear communication across a technically complex, multi-year programme. According to Colin Cooper, Technical Director, NV5, “TCarta’s HydroIQ platform has become a valuable operational tool for our topobathymetric lidar program, providing consistent, data-driven water clarity insights that support planning, flight execution, reflight decisions, and client communication.”
Looking ahead
Beyond New Zealand, HydroIQ has been successfully deployed in support of topobathymetric survey operations across a range of aquatic environments, from the coastal waters of Florida to rivers and estuaries in the northeastern United States. At its core, HydroIQ is a flexible platform that can be configured for long-term projects as well as rapid-response deployments for disaster relief and emergency mapping where timely water clarity information can be critical to operational planning. The service is equally applicable to limited-season environments such as the Arctic, where short collection windows make the ability to identify and act on favorable conditions especially valuable.
Moving forward, TCarta plans to integrate river gauge measurements, tides, wind, and precipitation-based predictions into its dashboards, giving teams an even more comprehensive view of factors that impact bathymetric lidar returns. Recent milestones in reducing image latency, including delivery times approaching 13 minutes from capture, point toward a future where near real-time water clarity information is routinely available to flight teams in the field. As these capabilities mature, TCarta will continue to evaluate how emerging sensors and delivery pipelines can be integrated into HydroIQ in a way that balances the operational value of faster information against the cost of commercial imagery, ensuring that monitoring configurations reflect the conditions and requirements of unique projects.
About TCarta
 TCarta delivers satellite-based hydrospatial intelligence to solve complex challenges in dynamic coastal and aquatic environments. Founded in 2014 and headquartered in Denver, Colorado, TCarta has decades of combined experience in hydrography, geospatial science, remote sensing, and environmental science. To learn more visit www.tcarta.com or email info@tcarta.com.