Example of the storm of July 24, 2023 in La Chaux-de-Fonds, Switzerland
The increasing frequency and intensity of extreme weather events require efficient methods for documenting, analyzing, and managing natural disasters. Using the storm that struck La Chaux-de-Fonds (canton of Neuchâtel, Switzerland) on July 24, 2023 as a case study, this article demonstrates the critical contribution of geomatics to crisis management and post-event analysis.
High-resolution airborne surveys combining orthophotography, oblique imagery, and high-density lidar enabled rapid and comprehensive three-dimensional documentation of the affected area. The resulting datasets supported emergency response operations, insurance assessment, forest damage analysis, and decision-making processes across multiple institutions.
This article presents the acquisition strategy, data processing workflow, and the main geospatial products generated, along with feedback from operational users. The experience highlights the importance of rapid data acquisition, integrated 2D and 3D visualization tools, and AI-assisted lidar processing in emergency contexts. The results demonstrate that timely access to geospatial data significantly improves situational awareness, coordination, and recovery planning following extreme events.
Introduction
Climate change is contributing to the increasing frequency and intensity of extreme weather events worldwide. These events place growing pressure on both natural and built environments, often causing severe damage to infrastructure, forests, and urban areas. While risk prevention and preparedness remain essential, post-event documentation has become equally important for understanding event dynamics, improving mitigation strategies, and supporting effective crisis management.
Post-event mapping plays a central role in this process by enabling rapid and accurate three-dimensional documentation of affected areas. High-resolution geospatial data provides decision-makers with the information required to assess damage, coordinate emergency operations, and support recovery efforts. In addition, such datasets contribute to long-term analysis through numerical modeling, risk assessment, and improved prevention measures.
This article presents the contribution of geomatics to the management of the severe windstorm that struck La Chaux-de-Fonds. The event, characterized by peak wind speeds of up to 217 km/h, was described by the Swiss Federal Office for Meteorology and Climatology (MeteoSwiss) as a hybrid phenomenon combining characteristics of both a tornado and a microburst. Although the event lasted less than ten minutes, its sudden and unpredictable nature prevented the issuance of an advance warning. The consequences were severe, resulting in one fatality, 45 injuries, damage to approximately 3000 buildings, impacts on more than 25,000 trees, and building damage exceeding CHF 120 million (Figures 1 and 2).
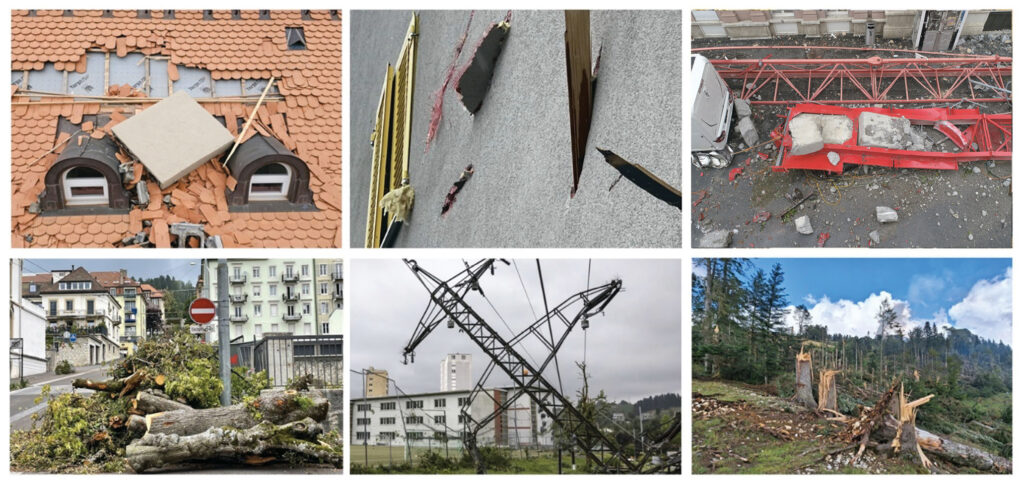
Figure 1: Images of the damage. Sources: Pierre Schneider, municipal engineer (top three images and lower left); La Chaux-de-Fonds Police Department (lower center); Pascal Schneider, SFFN (lower right).
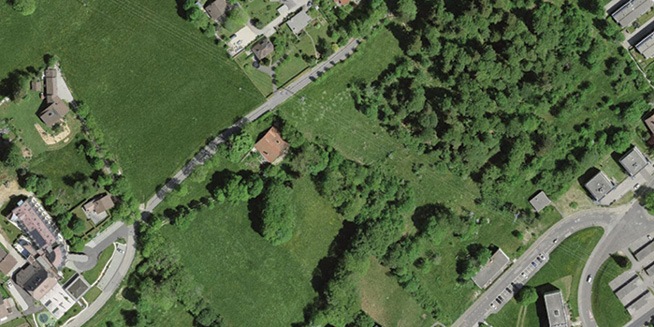
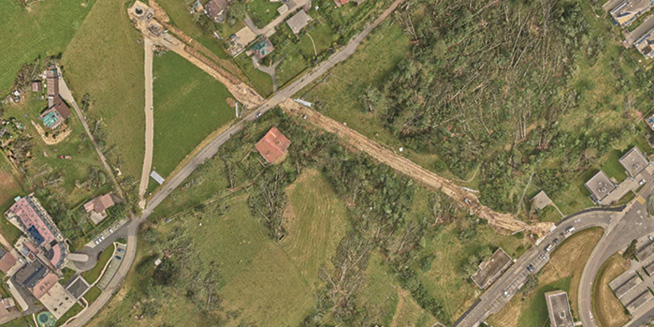
Figure 2: These images of a wooden area, acquired before (top) and after (bottom) the windstorm, highlight the severity and suddenness of the damage.
Faced with the scale of the event and the urgency of the situation, multiple institutions collaborated to rapidly acquire and process high-resolution airborne data. This paper describes the acquisition strategy, the geomatics methods employed, and the operational benefits observed through feedback from emergency services, insurance authorities, forestry services, and meteorological experts.
The canton of Neuchâtel’s Geomatics Office (Système d’Information du Territoire Neuchâtelois – SITN), the city of La Chaux-de-Fonds’s Geomatics Department and the Cantonal Insurance Institution (ECAP) coordinated their efforts to commission Sixense Helimap1 to carry out high-resolution surveys by helicopter. This enabled them to collect orthophotos with resolutions of 2, 5, and 10 cm, oblique images (Hexacam system: Figure 3), and lidar (100 ppsm). One of the major challenges of these acquisition campaigns was the speed with which the data had to be collected and made available. Sixense Helimap carried out an initial flyover on July 27, followed by delivery of the raw images on July 28 and delivery of the orthophotos on July 29. A refined version was delivered with the lidar data on August 3 eight days after the event. The orthophotos were published on the canton geoportal on the day they were received, providing considerable assistance to the emergency services responsible for securing roofs. The combination of orthophotos, oblique images, and very high-density 3D lidar surveys, and their comparison with campaigns prior to the storm, proved extremely valuable and effective. To speed up data processing, artificial intelligence was used to automatically classify standing and fallen tree trunks in the lidar point cloud.
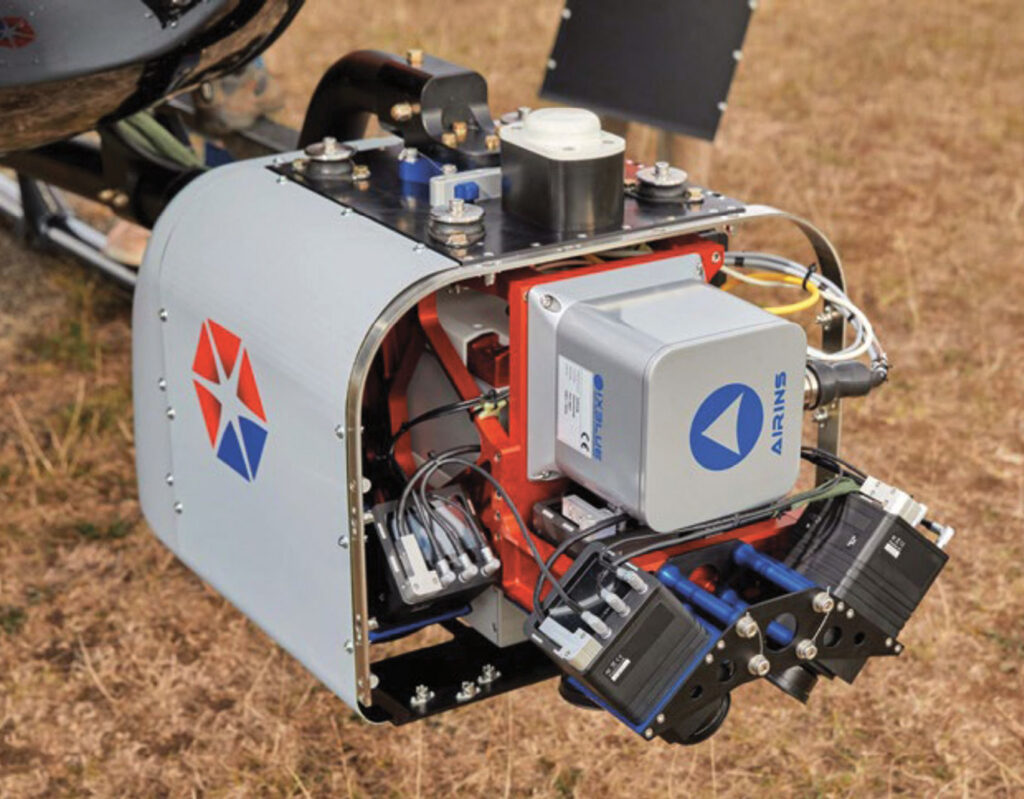
Figure 3: Hexacam sensor for acquiring lidar data and very high-resolution nadir and oblique RGB-NIR images.
Data acquisition and mapping strategy
Given the extent of the affected area, which included the cities of La Chaux-de-Fonds and Le Locle as well as surrounding forest areas, drones were not suitable for providing homogeneous emergency coverage. The urban area alone covered more than 30 km², making crewed helicopter-based acquisition the most practical solution.
A combined lidar and photogrammetry approach enabled rapid acquisition of high-resolution orthophotos over large areas. As Les Eplatures Airport is located within the area of interest, specific authorizations were required to operate within the controlled airspace (CTR). On July 27, less than 72 hours after the storm, an initial flight covering approximately 30 km² of urban areas was carried out between 9:40 a.m. and 11:30 a.m. During this mission, nearly 5000 images with a ground resolution of 2 cm were acquired, together with a lidar point cloud with a nominal density of approximately 60 ppsm.
Following consultation with the various stakeholders, the acquisition area was subsequently extended to the surrounding forests to assess the damage. A second flight was conducted on August 10, 2023, at an altitude of approximately 850 m above ground level, covering an area of 40 km² between 9:30 a.m. and 10:40 a.m. This mission acquired approximately 700 RGB-NIR images with a ground resolution of 9 cm, together with a lidar point cloud (35 ppsm).
A third flight was carried out on November 8, prior to the onset of winter conditions, to monitor the progress of roof repair.
Deliverables
The first flight was conducted in an emergency context, with the primary objective of delivering usable data to emergency services as quickly as possible. A 2 cm resolution orthophoto, referred to as a “quick-drop orthophoto”, was delivered on July 29 to support the analysis of building and roof damage within urban areas. To accelerate production, the cantonal digital terrain model (DTM) provided by SITN was used for orthorectification, allowing image processing to proceed without waiting for lidar data integration.
In addition, the use of a high-performance inertial measurement unit (IMU) enabled the acquisition to be processed without ground control points, significantly reducing production time. The very high spatial resolution of 2 cm was intentionally selected to allow detailed identification of roof damage, down to the level of individual tiles.
In a second phase, lidar data processing enabled the production of a true orthophoto with improved geometric accuracy. Data acquired during the August 10 flight was subsequently integrated to generate a four-band RGB-NIR orthophoto at 10 cm resolution covering the surrounding forest areas, delivered on August 16.
In total, the acquisition campaigns produced nearly 15,000 images and approximately 25 billion lidar points, representing a total data volume of approximately 3 TB
Data processing, analysis, and dissemination
SITN was responsible for processing, analyzing, and disseminating the datasets acquired during the three airborne campaigns carried out by Sixense Helimap. This work required exceptional coordination and close collaboration with operational users and technical partners. In parallel, SITN collaborated with Flai2 to perform automated classification of lidar point clouds using a cloud-based platform integrating artificial intelligence. This approach reduced processing time by several weeks compared to conventional workflows.
A primary objective was to provide the most relevant datasets to users as rapidly as possible. Several challenges had to be addressed simultaneously, including prioritizing user needs, coordinating external partners (Sixense Helimap, Flai, and the Federal Office of Topography — swisstopo3), managing very large data volumes, selecting processing algorithms optimized for speed and reliability, and rapidly developing customized applications adapted to operational requirements.
The main output products included:
- Rapid publication, four days after the storm, of an orthophoto dedicated to security and emergency services
- Collaboration with swisstopo to obtain high-priority pre-event Swissimage imagery from May 2023, enabling meaningful before-and-after comparisons under similar vegetation conditions
- Development of a dedicated geoportal for the forestry service (SFFN) to support intervention planning and safety management
- Creation of a GIS application for the cantonal insurance institution (ECAP) to locate, record, and monitor more than 3000 damaged buildings.
- Development of QGIS-based operational applications for the emergency services command center (SIS) to visualize raw imagery and monitor safety interventions in near real time
- Creation of a simplified geoportal for decision-makers and MeteoSwiss to facilitate analysis of the phenomenon and comparison of pre- and post-event conditions4
- Publication of all datasets on the cantonal 2D geoportal5 and the 3D lidar geoportal6
Particular emphasis was placed on high-density lidar data, which proved to be a major asset for assessing vegetation damage. To facilitate comparisons between pre- and post-event conditions, SITN relied on its cantonal lidar survey acquired in spring 2022, with a density exceeding 100 ppsm. The availability of national Swissimage 2023 imagery, prioritized by swisstopo, was essential for meaningful comparison, as earlier imagery was either outdated or acquired outside the leaf-on vegetation period, making canopy assessment difficult.
Several lidar-based analyses were performed to support both large-scale visualization of damage and detailed analysis at the individual tree level. The main products included:
- Digital canopy models generated before and after the storm, together with their differences to quantify vegetation loss (Figure 4).
- Nearest-neighbor analysis of pre- and post-event lidar point clouds, enabling detailed three-dimensional visualization and cross-sectional analysis of damage at the individual tree scale (Figures 5 and 6).
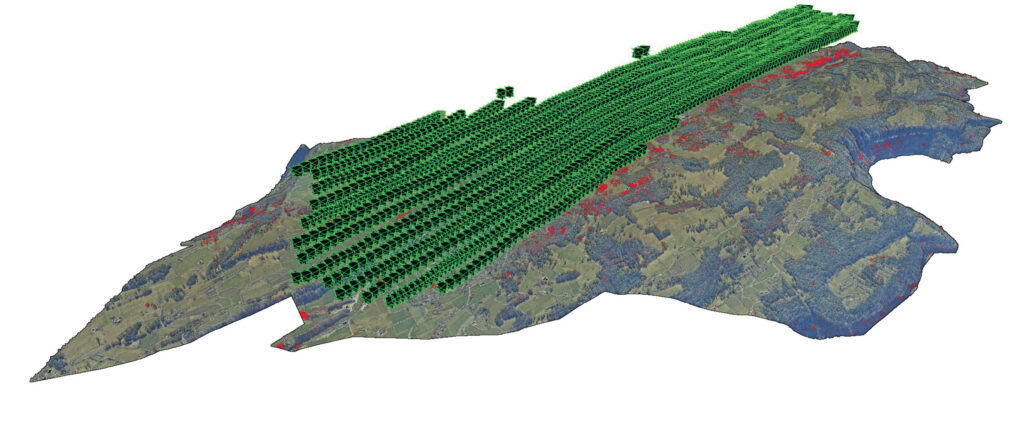
- Classified point clouds and maps of standing and fallen tree trunks (Figure 7).
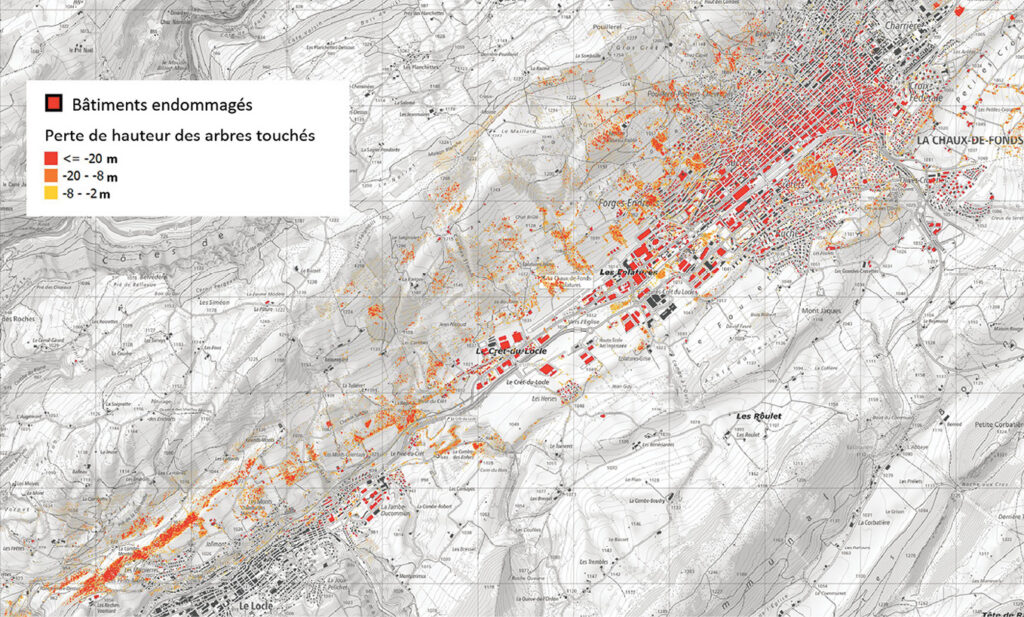
Figure 4: Map of damage, showing the difference between pre- and post-storm canopy models.
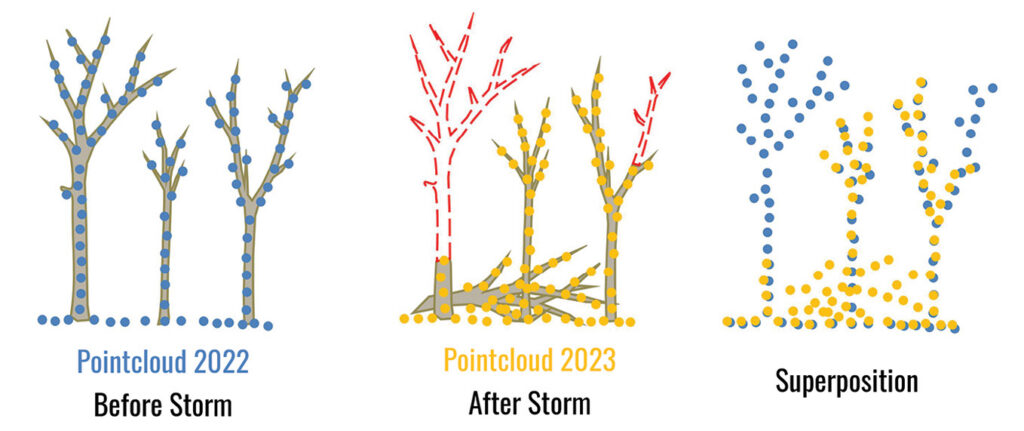
Figure 5: Cross-section view showing the pre-event (2022) points colored in red where storm damage occurred in 2023.
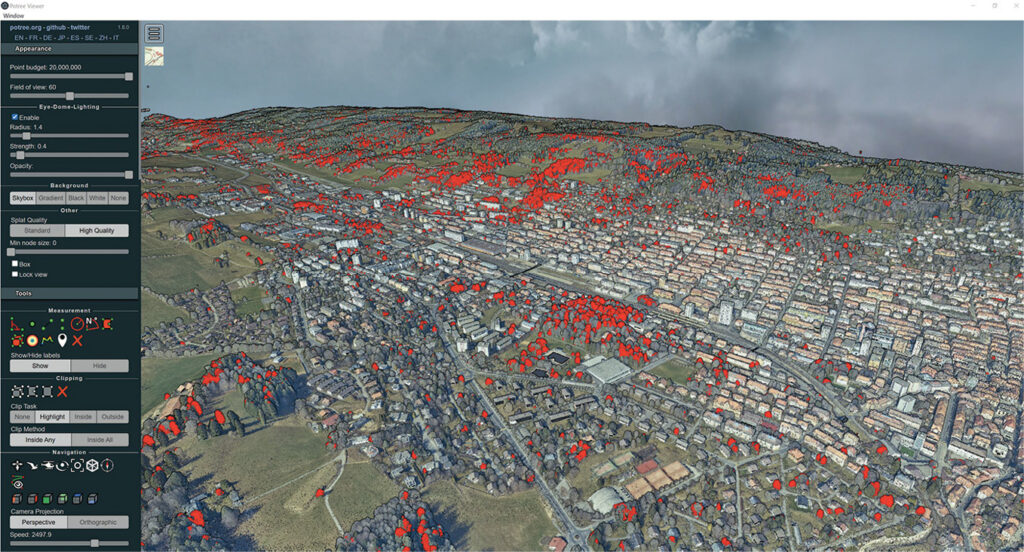
Figure 6: 3D lidar geoportal (Potree-based) highlighting damage to trees across the entire affected area.
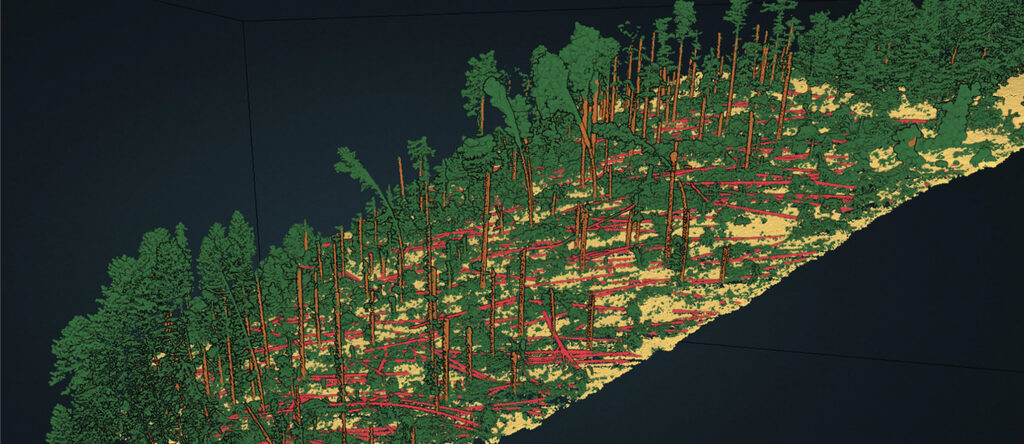
Figure 7: Mapping forest damage: AI classification of standing and fallen tree trunks (SITN-Flai collaboration).
Operational feedback and user perspectives
Following the delivery of geospatial products and applications, SITN conducted a feedback survey among the main actors involved in crisis management, to assess the operational value of the data and tools developed, and to obtain input to adapt the rapid mapping strategy for future events. The main conclusions are summarized below.
Fire department command center (SIS). The geoportal integrating orthophotos and the intervention monitoring application developed in QGIS significantly improved operational efficiency during crisis management. The orthophotos provided an immediate overview of the situation affecting approximately 3000 damaged roofs. Without aerial surveys, assessment would have required the deployment of ladder trucks sector by sector, resulting in substantial delays and resource mobilization.
The solutions developed enabled real-time monitoring of safety interventions, providing a clear overview of completed and pending work. Information related to damage types, intervention status, and responsibility for corrective actions could be centrally managed. The system also facilitated follow-up interventions, as additional windstorms required repeated inspections of previously secured roofs.
Finally, the recorded information proved valuable for conflict management, allowing the fire department to respond objectively to claims regarding allegedly inadequate interventions.
Cantonal Insurance Institution – ECAP. The geoportal developed by SITN enabled ECAP to carry out its assessment mission objectively, while limiting the need for additional field investigations. The data supported preventive safety measures in cases where building elements remained at risk of falling and enabled more accurate calculation of compensation through comparison of pre- and post-event conditions.
The overview provided by orthophotos also facilitated internal organization, including the allocation of affected sectors among insurance experts. The photographic surveys contributed directly to estimating overall damage costs and identifying areas requiring additional safety measures, particularly ahead of winter conditions.
Department of Wildlife, Forests, and Nature (SFFN). The combination of orthophotos and lidar data proved essential for managing and securing affected forest areas. Rapid processing of lidar data, even prior to full classification, allowed immediate identification of areas with significant vegetation height loss and provided a first estimate of the spatial extent of forest damage. Given the scale of the affected area, such an overview would not have been achievable using field observations alone.
Geospatial data significantly supported intervention planning, including accessibility assessment, identification of temporary storage areas, and prioritization of interventions in protective forests and frequently visited public areas. The placement of access restrictions and safety measures was largely based on lidar-derived information.
At a later stage, the canopy height difference model enabled a more precise estimation of the volume of damaged timber. Initial estimates made immediately after the storm suggested approximately 150,000 m³ of damaged wood, whereas lidar-based analysis refined this estimate to approximately 50,000 m³. Both lidar data and orthophotos also proved valuable communication tools for conveying the scale and nature of the damage.
The sequence of three acquisition campaigns further enabled the identification of suspicious tree felling activities. The quality and temporal consistency of the datasets, combined with field verification, provided a high level of confidence in the analysis.
The rapid integration of operational layers into the geoportal, including intervention zones, wood storage areas, and work progress, enabled efficient coordination of logging operations. Up to four logging teams, transport operations, and forestry supervision activities were coordinated efficiently from a central location, significantly reducing field travel and communication overhead.
Green spaces department of the City of La Chaux-de-Fonds. Post-event geospatial data was primarily used to assess reported damage and monitor unjustified tree removal carried out after the emergency phase. The availability of aerial imagery acquired shortly before and after the storm allowed clear differentiation between storm-related losses and subsequent interventions.
Lidar data, including point clouds and canopy models illustrating vegetation loss, played a decisive role in identifying the most affected areas. These datasets are now also being used to support long-term urban reforestation strategies and park reconstruction projects. The 3D photogrammetric reconstruction model generated from oblique imagery is currently used in planning future planting and landscape redesign.
MeteoSwiss. The availability of high-resolution geospatial data represented a major asset for understanding the event7 and will be equally valuable for future extreme weather events. The before-and-after datasets provided comprehensive spatial coverage and sufficient resolution to analyze the geometry of damage patterns, which was essential for distinguishing between linear and rotational wind effects.
Visualization capabilities provided by the SITN platform and the canopy height difference layer were particularly valuable for identifying areas with the most significant structural changes following the event.
Conclusion
In extreme situations, rapid documentation of post-event conditions is essential not only for effective crisis management but also for preserving evidence of the phenomenon before restoration and cleanup operations alter or remove visible traces. Accurate and timely geospatial documentation makes it possible to better understand event dynamics retrospectively and to improve future risk assessment and mitigation strategies.
The experience gained during the storm of July 24, 2023 demonstrated that rapid deployment of airborne acquisition systems, combined with efficient data processing workflows and close collaboration between institutions, constitutes a decisive factor in successful crisis response. The ability to produce and disseminate multiple complementary geospatial datasets within a very short timeframe significantly improved situational awareness and operational coordination among stakeholders.
This event occurred in a broader context marked by several major natural hazards in Switzerland in recent years, including flooding of the Rhône in June 2024 (damage in excess of CHF 200 million), the impressive collapse of the Birch Glacier in May 2025, which wiped the village of Blatten off the map (~CHF 300 million damage). Total natural hazards damages for 2024 are estimated at nearly 1 billion Swiss francs, mainly in June. In such situations, the complementary roles of swisstopo’s Rapid Mapping service and high-resolution airborne mapping solutions, such as the combined orthophoto, oblique imagery, and lidar approach presented in this article, have proved particularly effective.
Through this exceptional storm, SITN significantly strengthened its expertise in crisis management and further developed its technical infrastructure and operational workflows in response to evolving environmental challenges. Since 2019, the recurrence of major natural events approximately every two years has confirmed the necessity of maintaining rapid-response geomatics capabilities.
After testing several acquisition configurations in emergency mapping contexts, the combined use of orthophotos, oblique imagery, and lidar has proved especially efficient, with each data source providing complementary and essential information. Feedback from operational users clearly demonstrates the added value of geomatics in crisis management, from emergency response and insurance assessment to forestry management and scientific analysis. 
Acknowledgements
SITN wishes to acknowledge the strong commitment and expertise of its partners at Sixense Helimap, Flai, and swisstopo, as well as the operational users who readily adopted the geospatial data and services developed under exceptional time constraints.
Marc Riedo is head of the GIS center for the canton of Neuchâtel (SITN). Matthew Parkan is a geomatics engineer at the GIS center for the canton of Neuchâtel.
Julien Vallet is director and founder of Helimap Sixsense.
Hugues Fournier is deputy director of Helimap Sixsense.
David Ulrich is project manager at Helimap Sixsense.
Gildas Allaz is the geomatics manager for the city of La Chaux-de-Fonds.
- 1 https://helimap.ch/
- 2 https://www.flai.ai/
- 3 https://www.swisstopo.admin.ch/en
- 4 https://sitn.ne.ch/web/t240723/t240723.html (t240723 is the code name for the storm on July 24, 2023)
- 5 https://sitn.ne.ch/s/t240723
- 6 https://sitn.ne.ch/lidar/t240723.html
- 7 https://sitn.ne.ch/s/meteosuisse