Aerial imagery, lidar and GIS help decision-making on the planting of trees for maximum environmental improvement, financed by grant funds from USDA Forest Service
Chattanooga is using AI to fight urban heat. By mapping 5.3 million trees and creating a heat-risk index, the city is deploying $6 million to plant 5000 trees where they matter most.
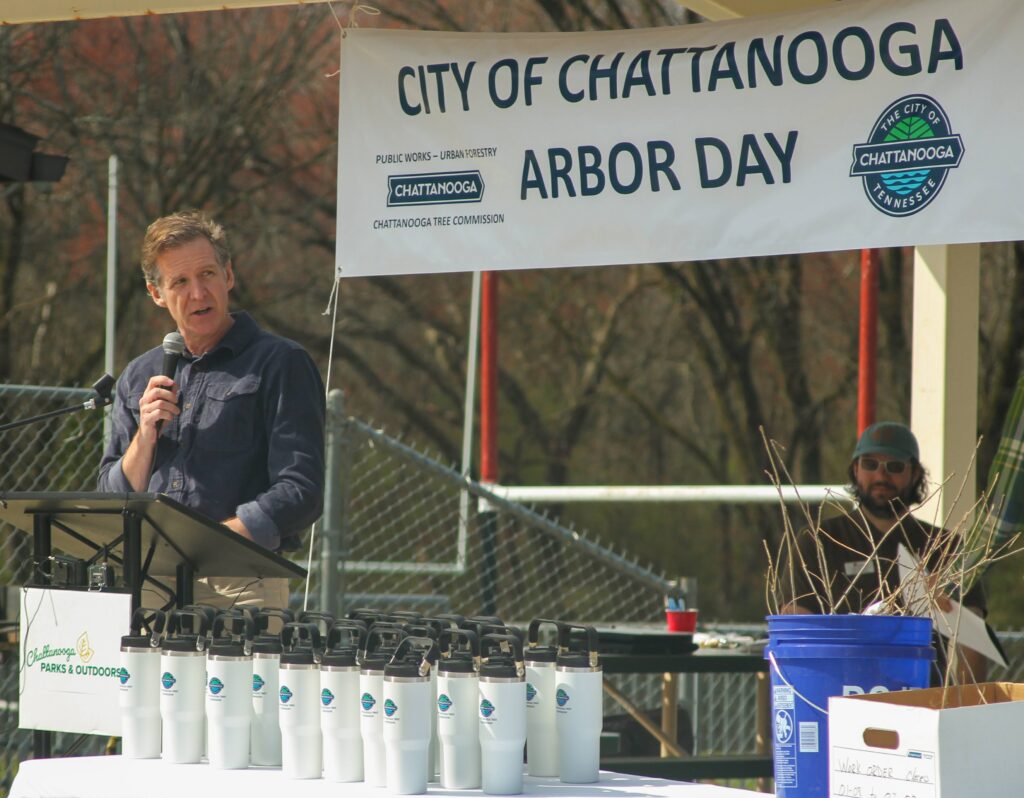
Mayor Tim Kelly addresses volunteers at Chattanooga’s annual Arbor Day event, where hundreds of residents help plant trees. The mayor reviews GIS heat maps in his spare time, linking the data directly to policy decisions about urban forestry.
Downtown Chattanooga hits 112 degrees Fahrenheit on summer afternoons. Three miles away in the Moccasin Bend neighborhood, temperatures drop to 90 degrees. That 22-degree gap highlights the role of trees as nature’s air conditioning. Tree shade blocks direct sunlight, leaves release water vapor, and tree canopies channel a breeze.
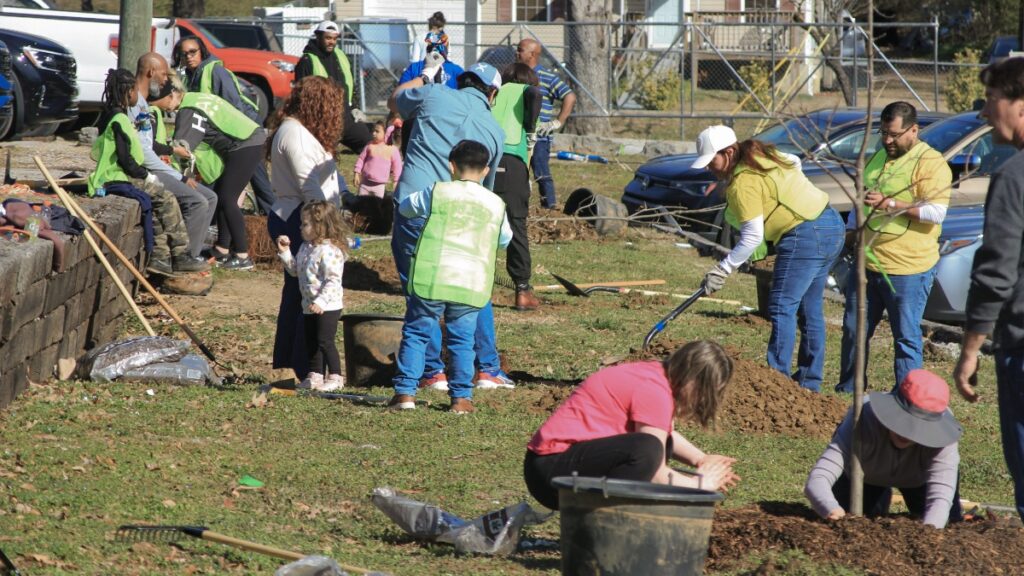
Families work side by side at a neighborhood park, turning data into dirt work. These community planting days build buy-in for urban forestry while getting trees in the ground fast. Children planting today will enjoy the shade their work creates in 20 years.
“Chattanooga sits in the big bowl of the Tennessee River Valley—heat and moisture come up from the Gulf and get trapped here,” said Charlie Mix, director of the Center for Applied Geospatial Data Science at the University of Tennessee at Chattanooga (UTC). “It gets even hotter downtown where there’s a lack of tree canopy. If you have a neighborhood with shade, your cooling costs are going to be cheaper. There’s a real economic benefit, not just an ecological one.”
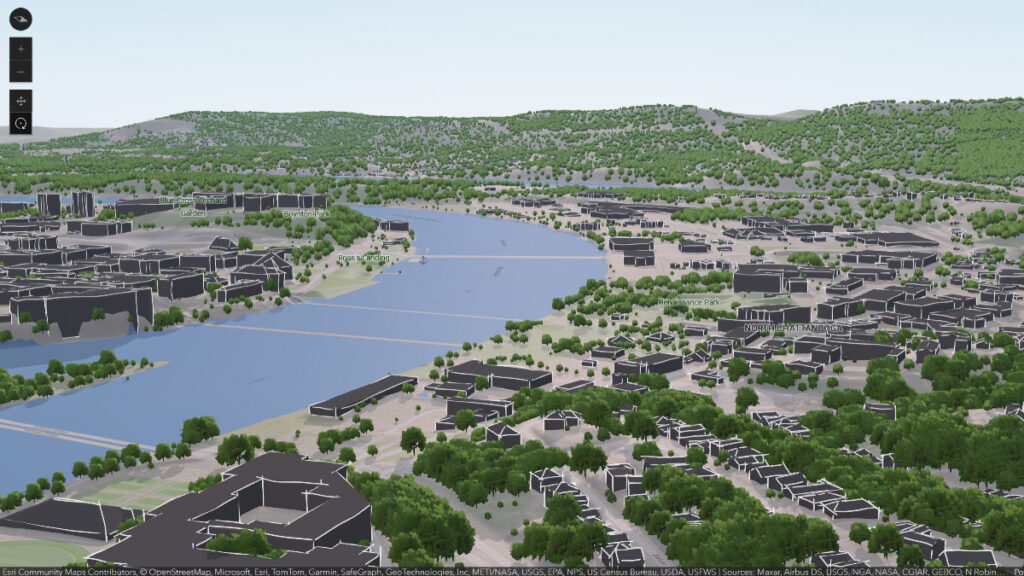
Lidar-derived 3D visualization of trees and buildings.
Fewer trees mean higher risk to elderly residents in homes without air conditioning, children in concrete schoolyards, and families without transportation to reach cooler areas. To address that risk, Mix and his team set out to map every tree in the city using aerial imagery, artificial intelligence (AI), and geographic information system (GIS) technology.
AI models drive discovery, and impact policy
Sending arborists to walk every street and count every tree would have taken years and cost hundreds of thousands of dollars. Mix had a faster approach: teach a computer to see trees. Working with aerial imagery from the US Department of Agriculture (USDA) and lidar scans from Hamilton County’s GIS, Mix trained a deep learning model to distinguish tree canopy from rooftops, pavement, and grass.
When the model analyzes an aerial image, it traces every tree crown with precision. The model counted 5.3 million trees across Chattanooga with 97% accuracy.
Mix ran the model on aerial imagery from 2014. Comparing historical count to 2023 analysis showed Chattanooga had lost 2837 acres of canopy—3% in nine years. Since 1984, the city had lost 48% of its forest cover.
The data showed not just a current state, but a trajectory. The hottest neighborhoods would only get hotter.
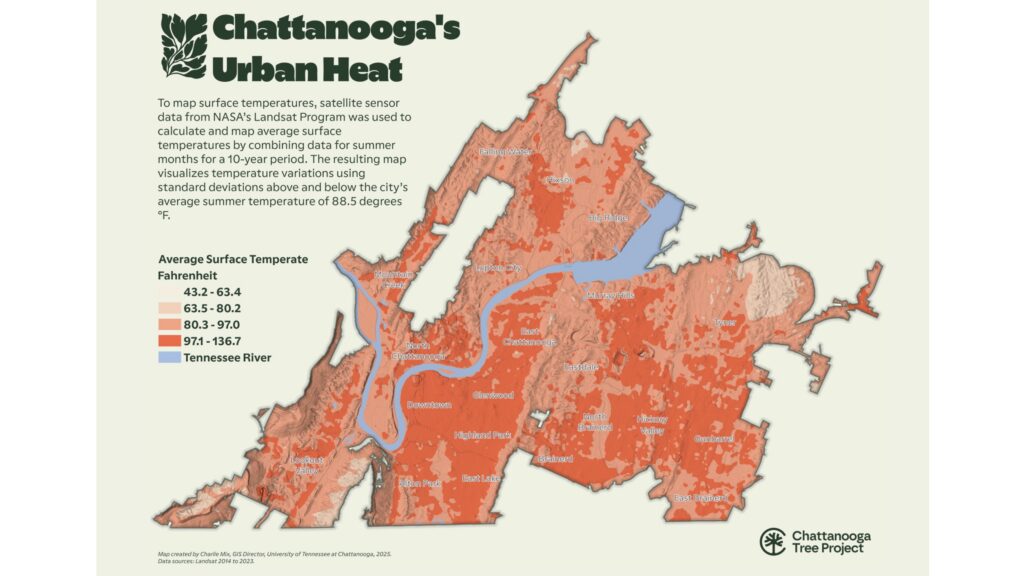
NASA satellite data reveal that downtown Chattanooga’s surface temperatures can reach 136 degrees Fahrenheit in summer—nearly 40 degrees hotter than tree-covered neighborhoods. The stark pattern shows where asphalt and concrete absorb heat versus where green spaces cool the city.
“This really makes a case for preserving our canopy,” Mix said. In cities where tree loss continues unchecked, canopy eventually correlates with wealth—rich neighborhoods keep their shade, poor neighborhoods lose it.
The USDA Forest Service awarded Chattanooga a $6 million grant for an initiative to plant 5000 trees in priority areas. To determine where those trees should go, Mix created a heat risk index combining surface temperatures with demographics—households with young children and seniors, homes without air conditioning, car ownership rates, and poverty levels.
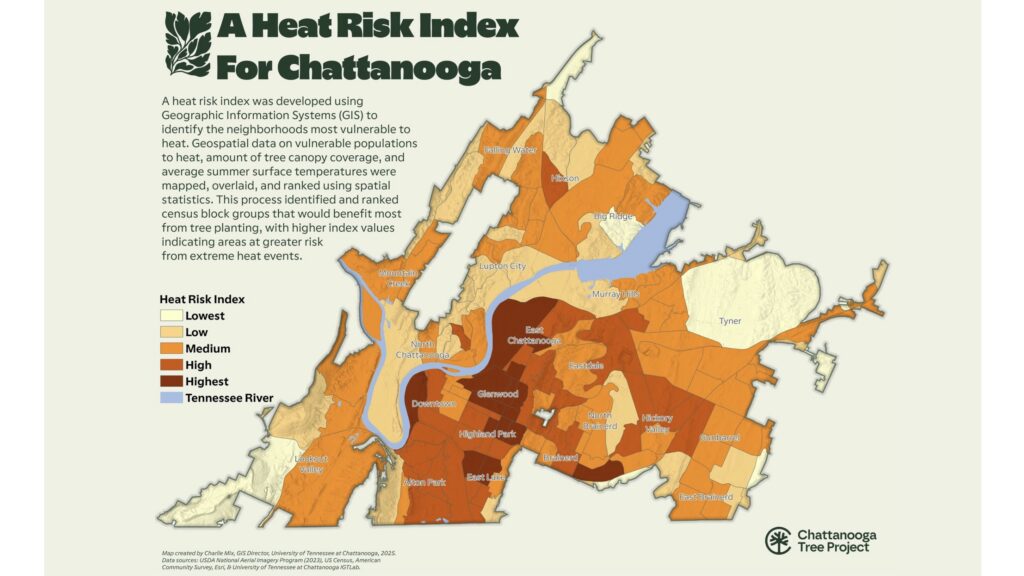
Downtown Chattanooga and surrounding neighborhoods face the highest heat risk, shown in dark brown. The heat index combined 10 years of temperature data, tree canopy coverage, and vulnerable populations to guide where 5000 new trees should be planted.
One neighborhood topped the index: Orchard Knob. The irony wasn’t lost on anyone—the area named for a long-ago cluster of fruit trees had few trees and dangerously high surface temperatures. There was one problem: Orchard Knob sat outside the grant’s original boundaries. Fortunately, the Forest Service approved a boundary change based on Mix’s analysis.
Today, the Chattanooga Tree Project brings together city government, academia, nonprofits, and federal agencies to plant those 5000 trees in places with the greatest human need and environmental return.
Seeing trees as green infrastructure
The analysis led to policy change. In 2024, after a year of public meetings, the city passed an updated tree ordinance requiring inch-for-inch replacement of city trees: if someone removes a 36-inch diameter tree, for example, they must plant 18 two-inch diameter replacements.
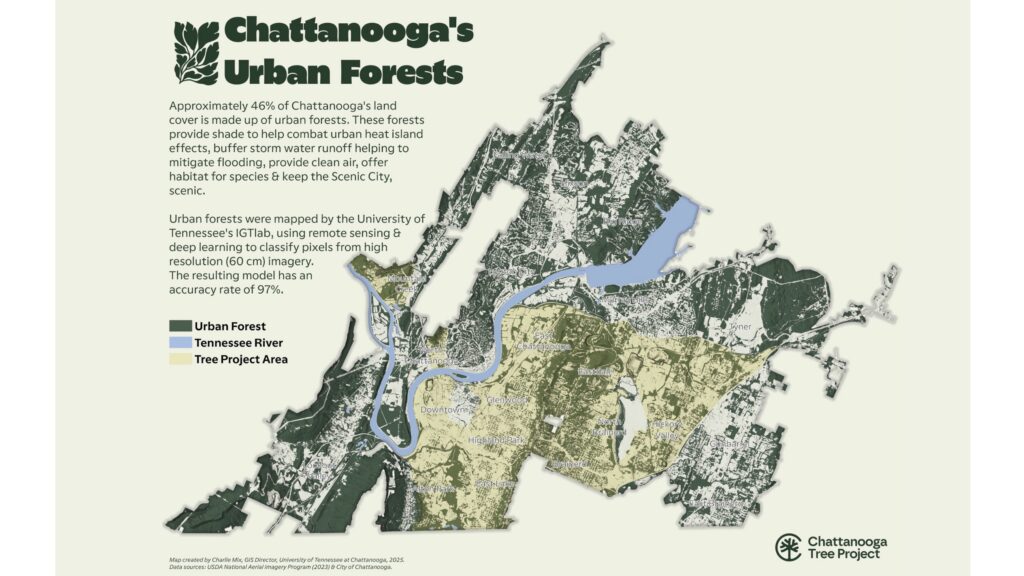
A custom deep-learning model mapped every tree crown across Chattanooga at 60 cm resolution with 97% accuracy. The tan overlay shows the Tree Project Area—vulnerable neighborhoods where 5000 native trees will be planted to bridge the green space gap.
Pete Stewart, an arborist and Chattanooga’s urban forester since 2021, uses GIS maps and apps to guide day-to-day tree maintenance and monitor workflows. Recently, his focus has shifted to land development—guiding where trees are planted, how many, and which species for every project site.
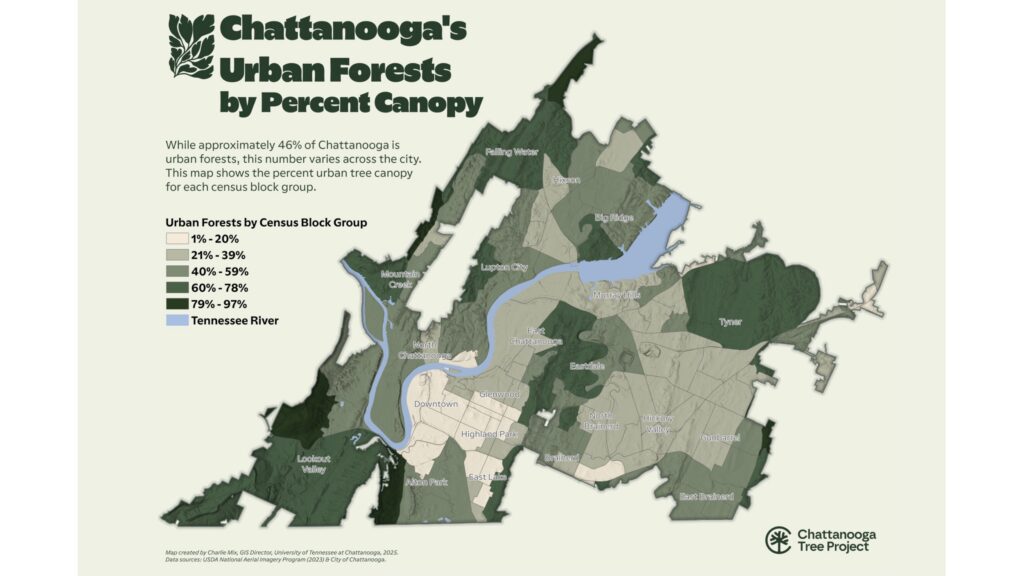
Deep-learning analysis of aerial imagery reveals that downtown neighborhoods have tree canopy as little as 1–20% while surrounding hills reach 79–97%. This uneven distribution creates the heat island effect and shows where strategic planting can help most.
“At least a third of my time is spent in plan reviews and site inspections of construction projects,” said Stewart, who reviews development plans to balance tree inventory and gauge how new construction will affect existing canopy. “Way more trees are planted by developers and affected through construction than any other activity.”
From smokestacks to strategic urban forestry
Chattanooga’s focus on trees carries historical weight. In 1969, a report from the US Department of Health, Education, and Welfare identified Chattanooga as having the nation’s worst air pollution. As Mix described it, “The story goes, you could go to work in the morning wearing a white T-shirt and by the end of the day it would be gray from the smoke of all the steel foundries.”
Today, Chattanooga is North America’s first National Park City, an international designation recognizing the city’s commitment to integrating nature into urban life. But as development accelerates and temperatures rise, maintaining the tree canopy becomes both more challenging and more critical.
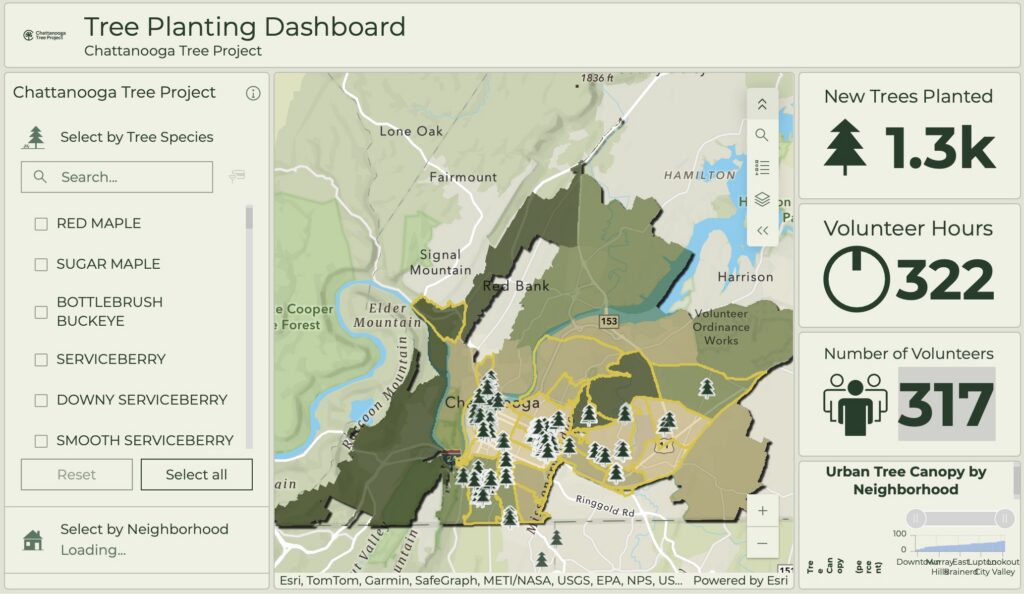
Real-time tracking shows exactly where each new tree goes. The dashboard updates as field crews plant, logging species, location, and maintenance schedules. So far, 1300 trees are in the ground, thanks to 317 volunteers contributing 322 hours.
The Chattanooga GIS team, led by manager Brendan Cleary, created a dashboard integrating tree data with the Forest Service’s freely available i-Tree tool to track progress and attach monetary value to each tree—annual property value increases, gallons of stormwater intercepted, and pounds of air pollution filtered.
Tree-lined streets show measurable property value premiums. Hospital admission rates for respiratory illness correlate inversely with tree coverage. A mature street tree intercepts thousands of gallons of stormwater annually, reducing overflow and treatment costs and improving water quality. The GIS dashboards make these quantifiable benefits visible citywide.
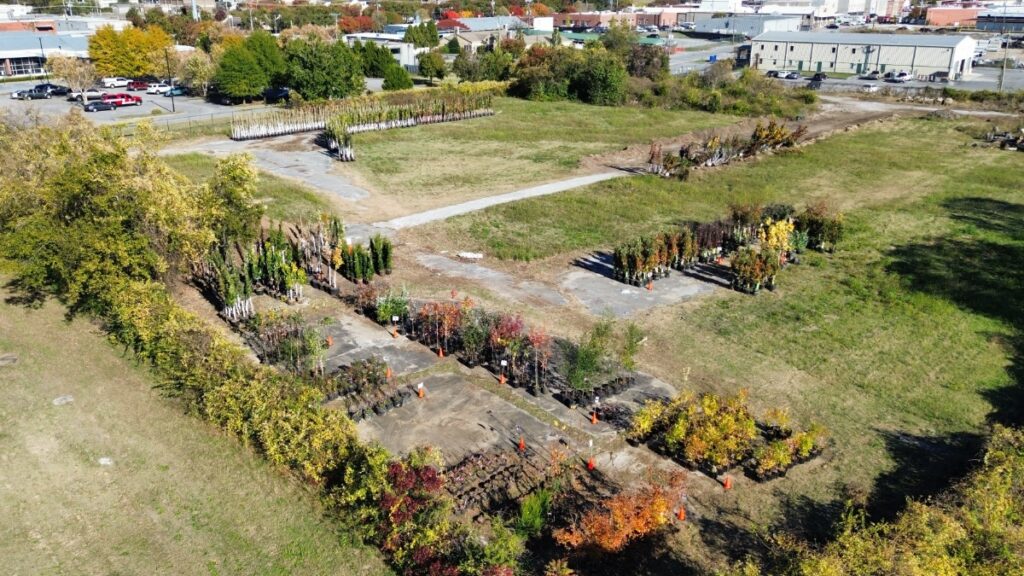
An aerial view reveals the staging operation behind tree planting at scale. Saplings are grouped by species on concrete pads, ready for crews to load on to trailers and deploy across target neighborhoods based on the heat risk index mapping.
They also show that trees do more than filter the air—they help circulate it. Chattanooga is exploring adding air-quality sensors mounted on buses to measure air pollution in each neighborhood. Displaying this data on tree coverage maps will show where stagnant air necessitates the planting of more trees.
For a city that cleared its air of industrial smoke, the goal of strategic tree planting is within reach. “The resilience of nature is pretty amazing,” Mix said. “We have a real opportunity to protect these forests now, so our neighborhoods don’t become hotter in the future.”
This article originally appeared in Esri Blog. Learn more about how GIS helps municipal foresters map and manage the trees in their city.
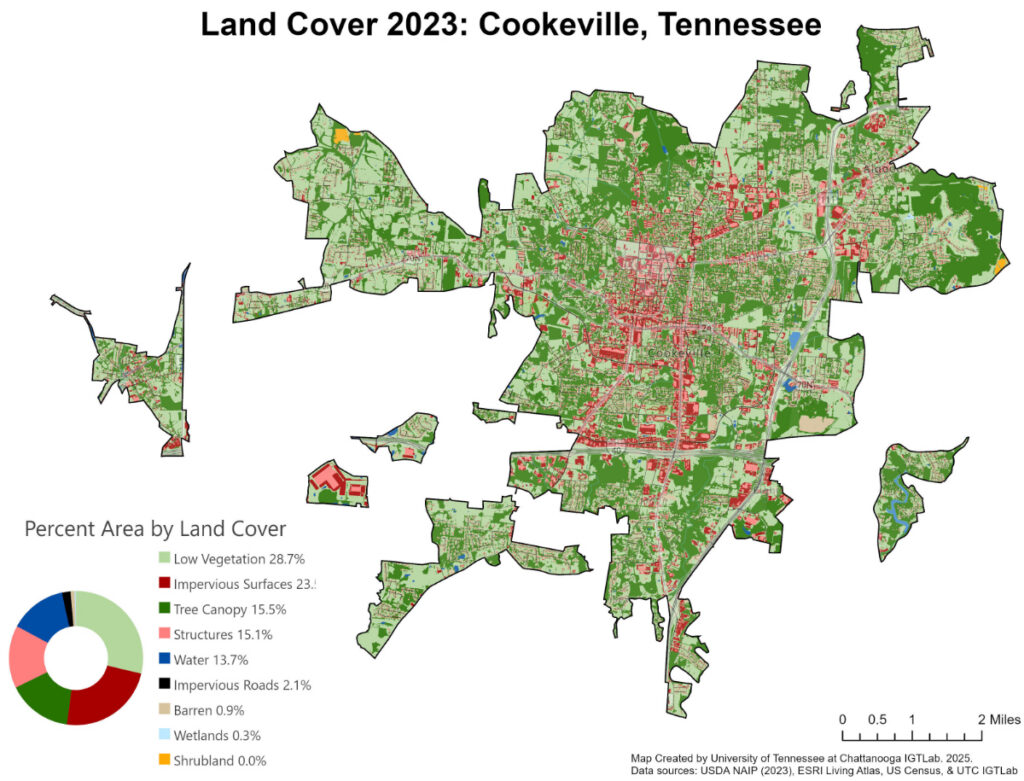
Cookeville is one of 24 small Tennessee communities receiving the same deep-learning analysis that guided Chattanooga’s tree planting. Red shows impervious surfaces downtown, dark green shows tree canopy. The state is funding students to replicate this work.
For Mix, it’s about democratizing access to data-driven environmental planning. Small cities with limited or no GIS capacity can make informed decisions about where to plant trees, ensuring the benefits of strategic urban forestry reach Tennessee communities of all sizes.
Sidebar:
Replicating success across Tennessee
The innovative mapping techniques developed for Chattanooga go beyond city limits. Charlie Mix and his team at UTC’s Center for Applied Geospatial Data Science are now extending this work to 24 small communities across Tennessee—places that lack the GIS departments, trained staff, and technical resources of larger cities.
Through a partnership with the Tennessee Division of Forestry’s Urban & Community Forestry Program, UTC students are using the same deep-learning models and high-resolution satellite imagery to map urban forests, measure heat severity, and identify vulnerable populations in towns with fewer than 50,000 residents. Communities such as Tullahoma are receiving comprehensive urban canopy assessments at no cost, funded through federal Forest Service grants.
“These are all communities that have come to the state’s new program wanting that assistance,” Mix said.
Students use GIS to create land-cover maps, overlay demographic data, and build interactive dashboards local officials can use to guide planting decisions. One graduate student is mapping her own hometown, bringing cutting-edge geospatial tools to the community where she grew up.