Editor’s note: See the companion video, Charting Change: Geospatial Insights for a Safer Valdez
The City of Valdez, Alaska, partnered with NOAA to gather hydrographic data in support of navigation safety, disaster preparedness, and the region’s economic interests.
Alaska is home to some of the most breathtaking and volatile landscapes in the world, and Port Valdez is no exception. Fed by relentless snow accumulation in the high peaks and icefields of the Chugach Mountains, glaciers carved deep U-shaped valleys through the land over thousands of years, and the Pacific Ocean gradually flooded the freshly scoured earth. At the head of this millennia-old glacial fjord, flanked on both sides by steep mountain slopes, is the City of Valdez.
Valdez is located roughly 100 miles due east of Anchorage as the crow flies but is 300 miles by car due to the heavily glaciated Chugach Mountains. As the northernmost ice-free port in the U.S., the city was chosen as the terminus of the Trans-Alaska Pipeline System in 1975. In 1989 the infamous Exxon Valdez supertanker struck a reef in Prince William Sound shortly after departing Valdez. Lessons learned from the incident are still being leveraged to improve how we prevent and respond to oil spills in complex environments worldwide.
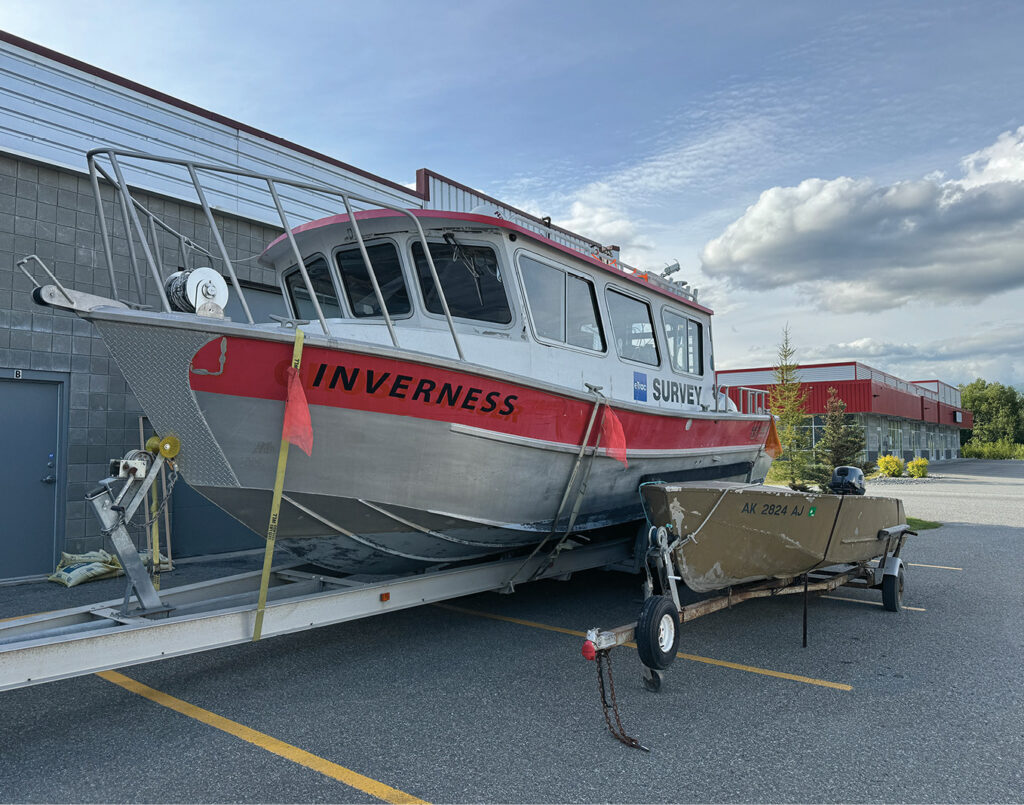
The primary surveying vessel next to the skiff used for navigating Valdez Glacier Lake.
Today, Valdez ships over 150 million barrels of crude oil from its port to the lower 48 states of the U.S. and other areas of the world annually. Fishing, both recreational and commercial, and tourism also play important roles in the city’s economy. Likewise, multiple government agencies depend on Port Valdez as a critical hub for maritime safety, transportation infrastructure, and national security operations.
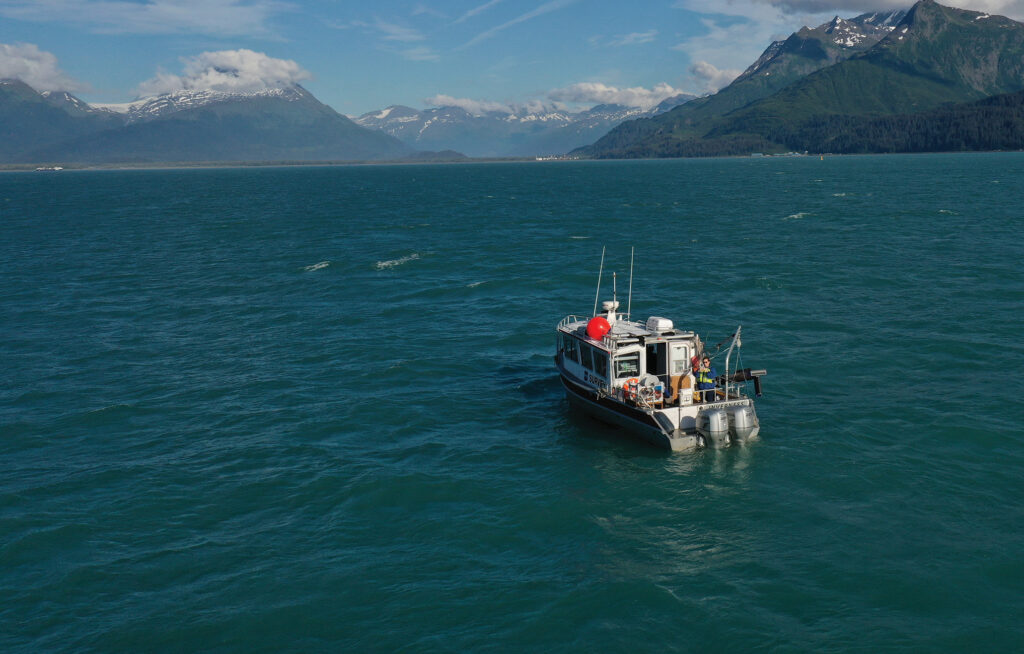
Woolpert hydrographer onboard the survey vessel collecting bathymetric data.
Because there is only one road in and out of the city, the economic success and welfare of Valdez and its citizens depend on reliable port accessibility. As with much of Alaska, Port Valdez is an incredibly tectonically active area, necessitating accurate hydrographic mapping to identify and study submerged hazards.
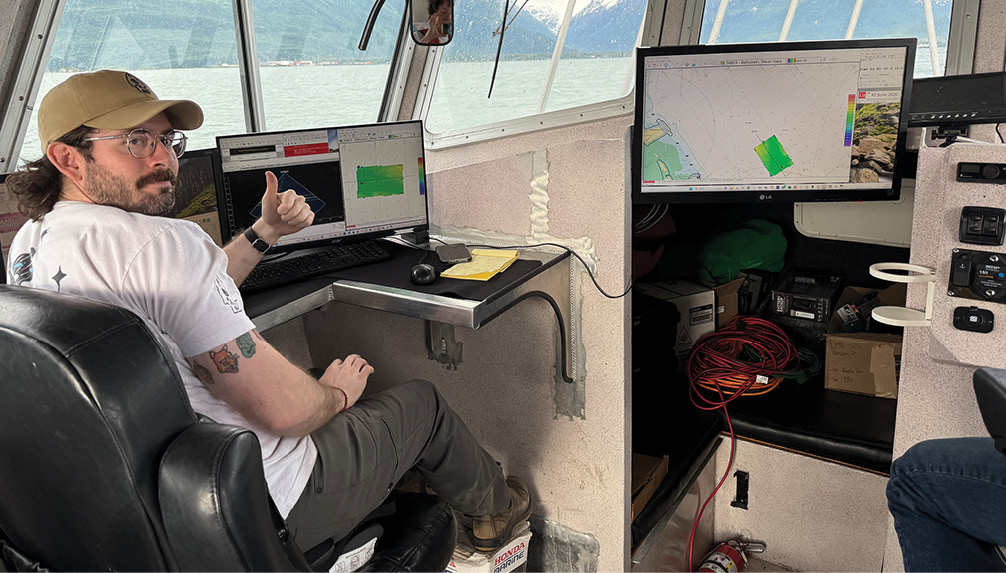
Monitor onboard the surveying vessel displaying bathymetric data.
Historical background of Valdez and the need for updated hydrographic data
Glaciers constantly grind down mountains and discharge massive amounts of glacial flour by way of rivers laden with sediment. As these silty rivers reach the calm waters of Port Valdez, the sediment is deposited as river deltas that border the steep-sided fiord. During a very large seismic event, this unconsolidated sediment is likely to slump and slide catastrophically in what is known as a submarine or underwater landslide. This sudden displacement of a large mass of land underwater generates a tsunami, which can inundate the coastline with little or no warning.
The City of Valdez is no stranger to landslide-induced tsunamis. In 1964, a 9.2-magnitude earthquake, also known as the Good Friday Earthquake, triggered multiple underwater landslides in the Valdez Basin and subsequent tsunamis, which struck the city, claiming the lives of 30 people. In the aftermath, the U.S. Army Corps of Engineers moved the community from its original site to a new location with more bedrock and stable soil.
Most recently, in 2020, the terminus of the Valdez Glacier collapsed, sending a mile-long section of ice into the glacier lake and its outflow. The glacier lake, located about seven miles northeast of Valdez, is surrounded by high, mountainous slopes. As the glacier continues to retreat, these slopes become increasingly vulnerable to potential failures. When the glacier’s front collapsed, it exposed a significant portion of the lake that had never been surveyed.
To be able to manage the impact of these events appropriately and mitigate future disasters, the city needed to acquire new hydrographic surveying data of Port Valdez and the glacier lake. The last survey of Port Valdez was conducted in 2002, and since that time multiple significant changes to the landscape have occurred.
“With over 22 years of change and evolution, we figured it was time to get some new data to have a better understanding of what’s going on under the water here locally on our coastline,” Valdez City Manager Nathan Duval said.
Updated maps of the ocean floor and glacier lake have proved vital to navigation safety, assessing current and potential hazards, and protecting the public and critical infrastructure.
Acquiring the data and funding the project
The emergency manager for the City of Valdez, Aaron Baczuk, contacted the National Oceanic and Atmospheric Administration’s (NOAA1) Alaska Navigation Manager2 to ask about acquiring updated bathymetric and hydrographic data to support the city’s population and economy. During discussions, it was suggested that the city apply for the Brennan Ocean Mapping Fund3, named after Rear Admiral Richard T. Brennan, who passed away shortly after becoming the director of the NOAA Office of Coast Survey. The program invites non-federal entities to partner with NOAA on ocean and coastal mapping projects of mutual interest using NOAA’s geospatial contracting vehicles. The program relies on NOAA’s mapping, charting, and geodesy expertise, appropriated funds, and its authority to receive and expend matching funds contributed by partners to conduct surveying and mapping activities.
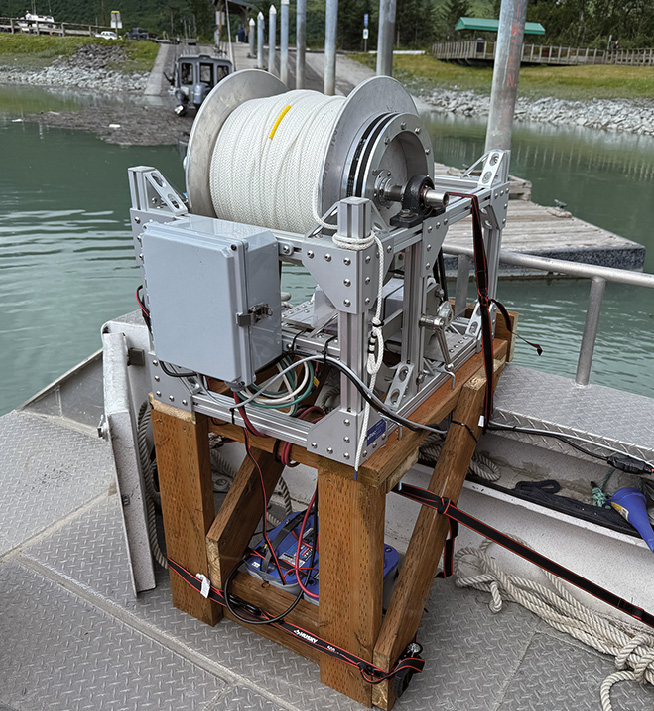
The high-speed winch used to model spatio-temporal variations in the water column and correct for refraction.
“[Brennan] was a real passionate guy about hydrography, about surveying, about the people in the community—but, in particular, really reaching out to additional folks,” said Captain Sam Greenaway, chief of the Hydrographic Services Division for the Office of Coast Survey. “In projects like this, we’re working closely with the city, we’re working on geological hazards, we’re updating the chart—he was pushing for this for years. It’s good to see this vision come to fruition.”
In November 2023, the Port Valdez area was selected as a partner project for the Brennan Ocean Mapping Fund opportunity, with mapping scheduled to occur in 2025 via NOAA’s hydrographic services contract vehicle4. This opportunity leverages NOAA and non-Federal partner funds to acquire more ocean and coastal mapping data from qualified contract surveyors, which represents cost savings for the Federal government to advance such work. “It’s always beneficial to partner with other organizations like NOAA to help spread out the cost of these types of projects,” Duval said.
NOAA selected Woolpert as the contractor most qualified to conduct this work from the pool of NOAA’s hydrographic survey vendors. Woolpert is a global architecture, engineering, and geospatial firm with a long history of supporting NOAA and collecting large-area topographic and bathymetric data across Alaska.
“Woolpert has been mapping Alaska for over 20 years, with offices in Anchorage and Wasilla, and staff embedded across the state,” said Dave Neff, a certified hydrographer who leads Woolpert’s geospatial maritime team. “We’ve supported projects from Southeast Alaska to the North Slope to the farthest remote tips of the Aleutian Islands. Our work includes mapping for telecommunications cable route surveys, harbor mapping, navigation and charting, as well as emergency response efforts like the Barry Arm landslide risk.”
Mapping the Valdez Basin and Valdez Glacier Lake
The depth of the Valdez Basin ranges from just a few feet near the shoreline to about 1000 feet. Woolpert’s survey covers depths down to 1042 feet. To map the Valdez Basin, Woolpert’s hydrographic survey team used both high- and low-frequency multibeam sonar to map all depths within the project area. This sonar’s wide dynamic range of frequencies, from 90 to 450 kilohertz, enabled the team to reach the highest resolution possible for both the shallow and deep water.
Oil tankers navigate the Valdez Narrows to deliver crude oil from Alaska to the lower 48, while bathymetric data reveals a seafloor shaped by glacial processes.
A unique challenge the Woolpert team had to address was refraction. The cold freshwater rivers flowing into the survey area cause sound velocity changes in the water column, resulting in distortions in the bathymetric data. Woolpert prepared accordingly by bringing a high-speed winch and freshly calibrated sound velocity profilers. These tools enabled Woolpert to model the spatio-temporal variations in the water column and correct for refraction. In total, the port survey covered an area of approximately 34 square nautical miles.

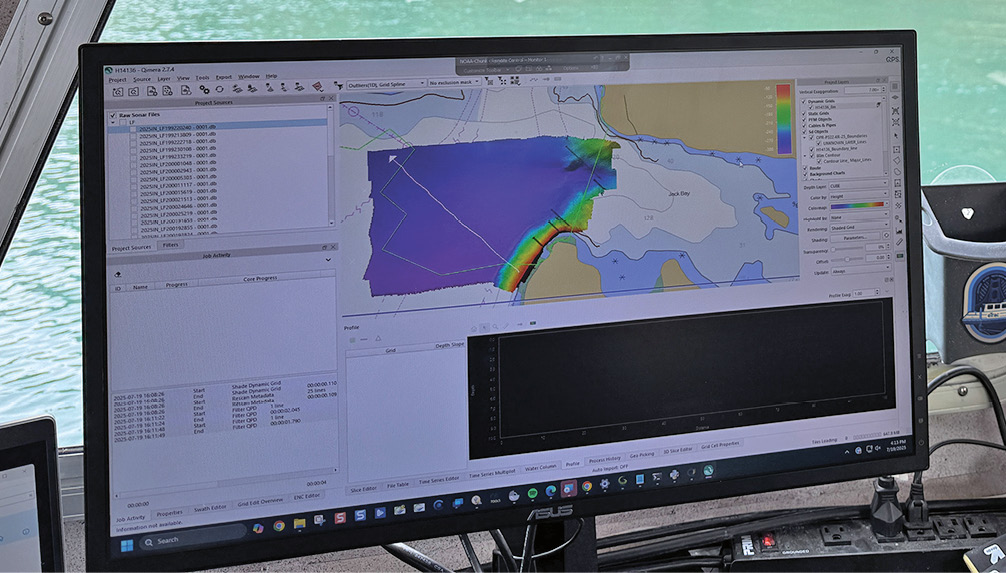
A complex depositional environment is revealed in the bathymetric data adjacent to the City of Valdez.
Having completed the first survey, the team shifted its focus to Valdez Glacier Lake.
“After the city was awarded the original contract for the hydrographic survey, I reached out to NOAA and explained the situation with Valdez Glacier Lake,” Baczuk said. “Typically, NOAA works with ocean surveys, but because of the proximity of the lake to the ocean and to our critical infrastructure, they were willing to include that survey at no additional cost to the City of Valdez.”
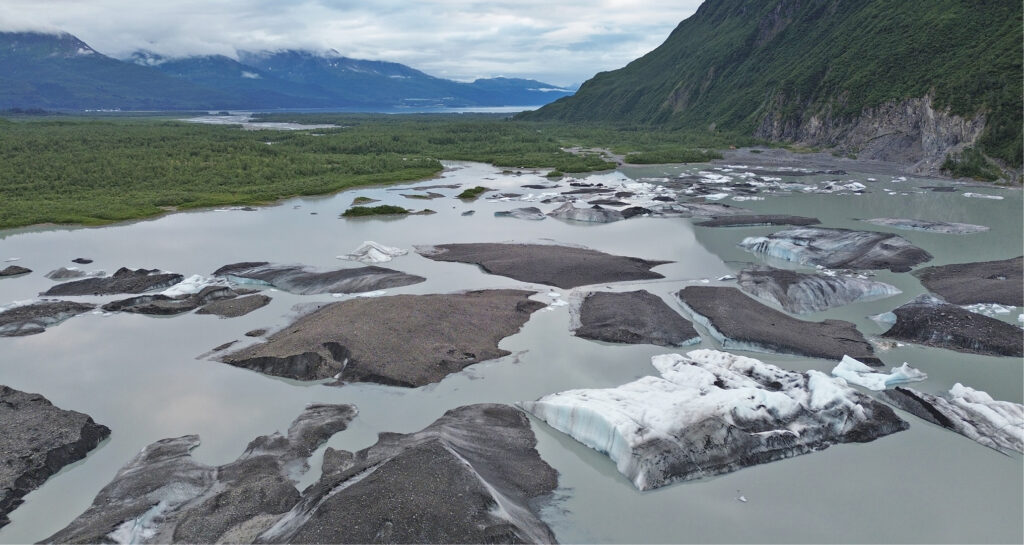
Valdez Glacier Lake and its labyrinth of icebergs.
In comparison, the two square nautical miles of Valdez Glacier Lake were considerably smaller than the port’s survey area. Nevertheless, the lake’s water depth reached 656 feet, very impressive for such a small body of water. These depths meant that the Woolpert team needed to use the same deep-water, high-resolution multibeam sonar to acquire accurate data.

The figure and the skiff indicate the scale of a large iceberg inside Valdez Glacier Lake.
The challenge, however, was that Valdez Glacier Lake had no boat launch and was choked with a labyrinth of icebergs. Woolpert could not launch its survey vessel into the lake, and the vessel was too large to navigate safely through the icebergs.
“Valdez Glacier Lake required innovative approaches,” Neff said. “We employed an uncrewed watercraft with custom equipment to safely and accurately survey this remote and dynamic landscape.”
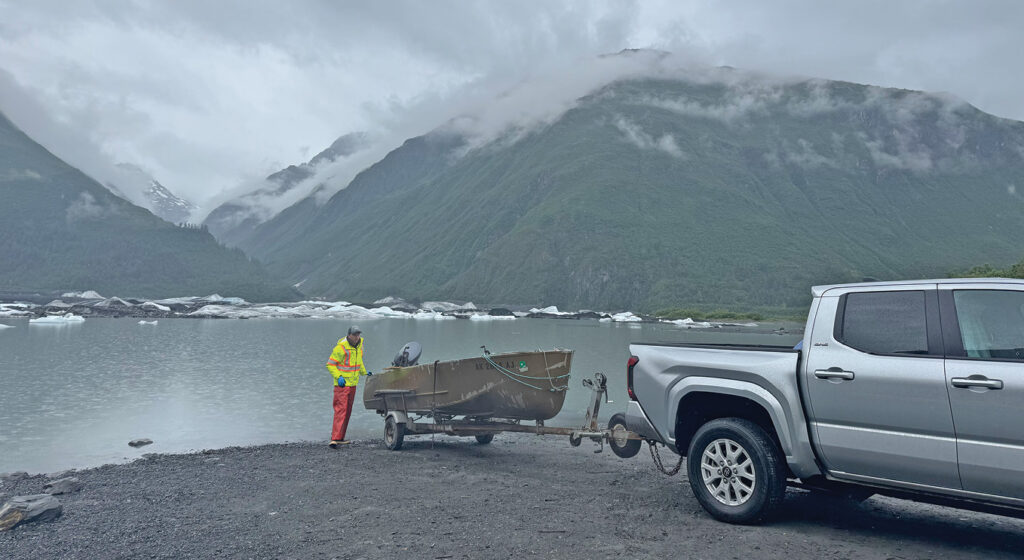
The skiff being deployed into Valdez Glacier Lake.
Woolpert’s uncrewed survey vessel was accompanied by a skiff and by Baczuk, who came out in his personal kayak to help escort the team through the icebergs. This strategy allowed Woolpert to use its deep-water, high-resolution multibeam sonar to successfully map all the way to the glacier’s face, including the deepest parts of the lake.
Michael Stephens, contracts team lead of the Hydrographic Surveys Division for the Office of Coast Survey, was “impressed with how much data they were able to collect in such a harsh environment with so many logistical challenges as well.”
The broader benefits of seafloor mapping and utilizing federal grant programs
Updated bathymetric data from these surveys support many other critical applications in addition to disaster preparedness. Accurate data ensures that vessels in Valdez’s waters can navigate safely and avoid underwater hazards. It also supports industries such as fishing and tourism, as well as planning new infrastructure, for example, identifying locations for underwater fiberoptic cables. Other possible uses include habitat modeling and resource management.
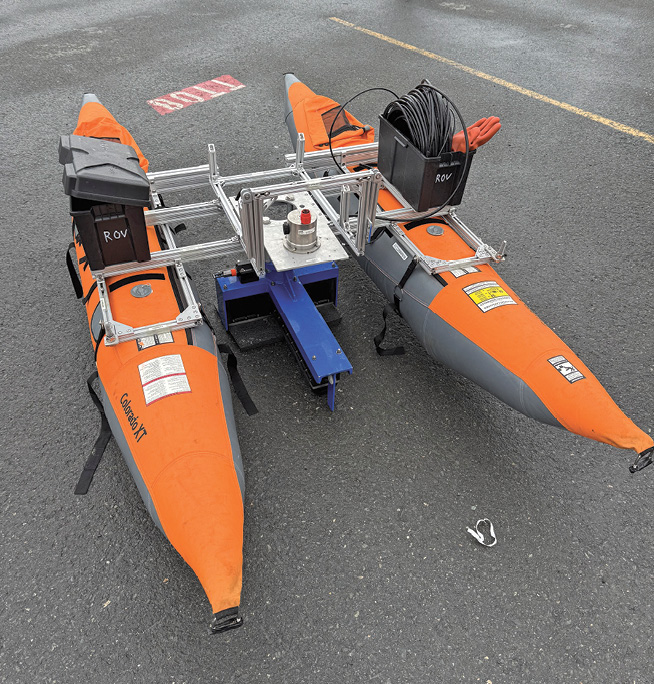
The uncrewed surveying vessel with the deep-water, high-resolution multibeam sonar.
“The maritime economy is largely invisible to most Americans, but it’s fundamental to the functioning of our economy today,” Greenaway said. “Whether you think about grain exports coming down the Mississippi River and heading overseas, or oil moving from, say, Valdez down to a refinery on the West Coast, the supply chains are so important to … every aspect of our economy, and it’s critical that we have updated navigational products to support that.”
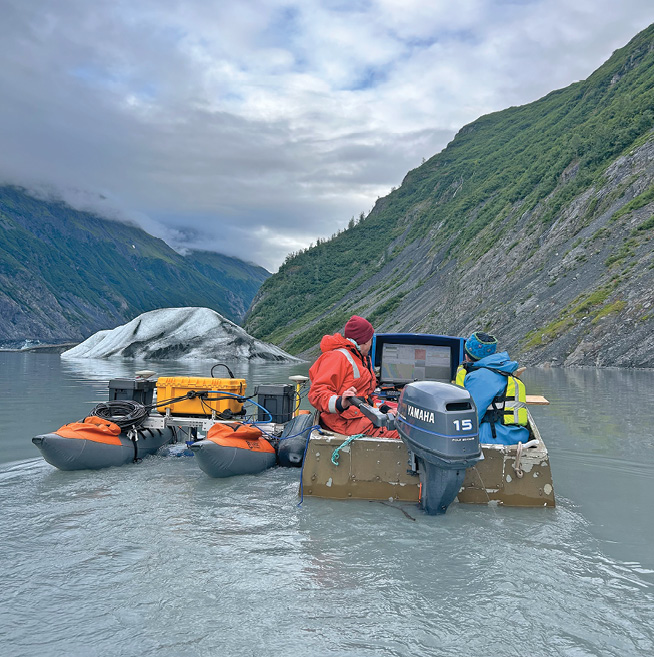
The Woolpert team surveying Valdez Glacier Lake, accompanied by an uncrewed vessel equipped with a deep-water, high-resolution multibeam sonar.
Furthermore, these mapping projects demonstrate to non-federal entities, such as cities like Valdez, the advantages of partnering with federal agencies to leverage their expertise, contractor networks, and resources.
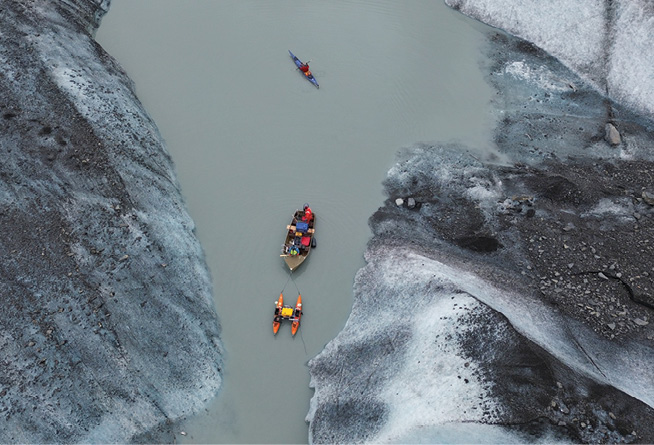
Drone photograph of Aaron Baczuk, the City of Valdez emergency manager, in his kayak leading the Woolpert team in their skiff as they pull the uncrewed surveying vessel through the icebergs.
“You never know down the road who you may have worked with or partnered with—how that relationship is going to be beneficial in the future,” Duval said. “Working with NOAA and Woolpert, those were relationships that we were able to establish and connections that may be used for other projects, but it may also just be something that helps us understand their processes for a future grant or other opportunities that may come up.”
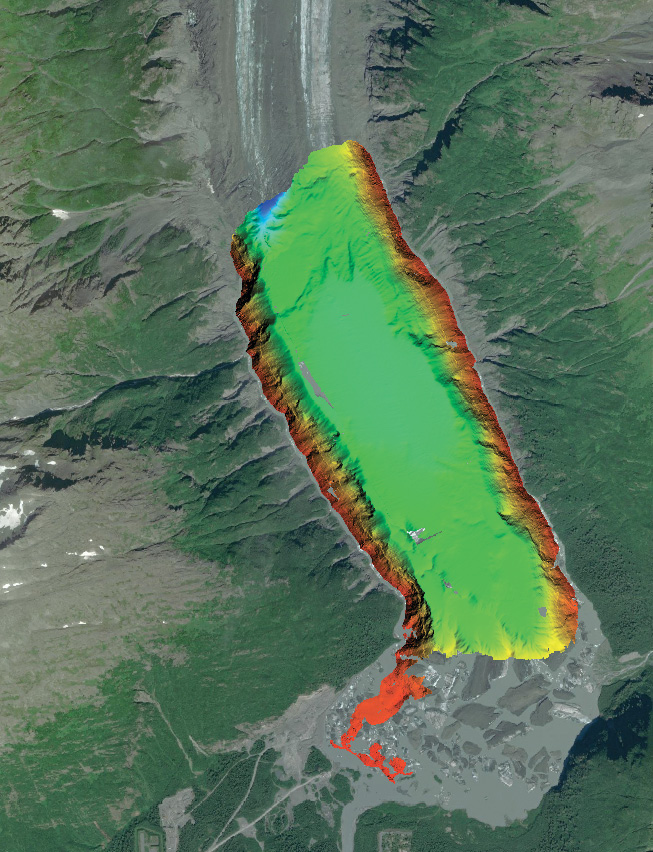
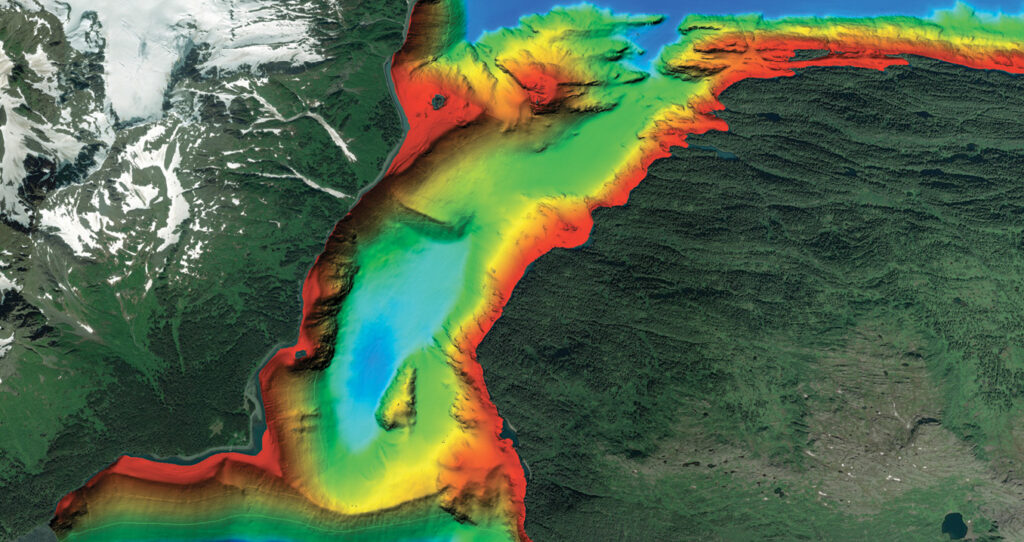
Bathymetric data for Valdez Glacier Lake. Data was collected up to the face of the calving glacier, where depths reached up to 192 m (632 feet).
“NOAA was a fantastic partner for the City of Valdez in this project,” Baczuk said. “At the very beginning, they helped us understand whether our project and what we were trying to accomplish would work with the Brennan Ocean Mapping Fund.”
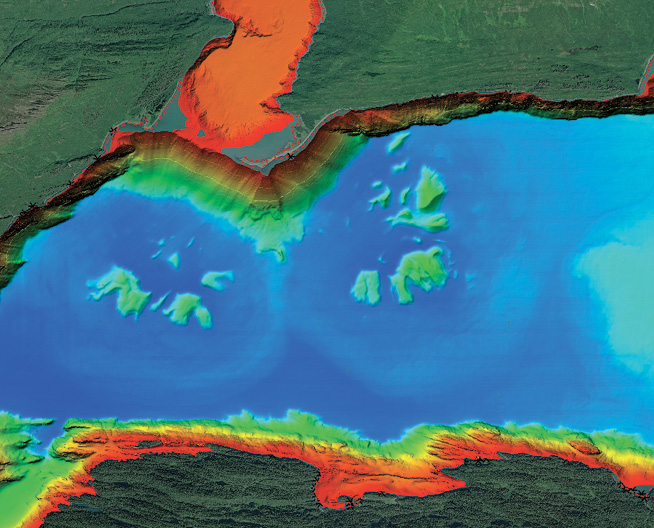
Submarine landslide debris are clearly visible in the bathymetric data. With heights up to 40 m, these slump deposits lie at the base of the glacial fjord, showing evidence of prior slope failures.
He also highlighted the contributions of Woolpert, saying, “… when it came to the Valdez Glacier Lake, they were tenacious in helping us to acquire that data.”
 Woolpert Lead Hydrographer and Project Manager Ryan Cross, CH, has expertise in collecting, processing, and analyzing spatial data. He specializes in vessel operations and data acquisition and is responsible for leading field operations and maintaining proper protocols. As a geophysicist and project manager, Cross merges rigorous scientific standards with business requirements, working closely with clients and colleagues to see projects through the initial planning to the final deliverables. He earned his BS and MS in geology and geophysics, respectively, from the University of Alaska Fairbanks.
- 1 https://www.noaa.gov/
- 2 https://nauticalcharts.noaa.gov/customer-service/regional-managers/index.html
- 3 https://iocm.noaa.gov/planning/contracts-grants-agreements.html
- 4 https://nauticalcharts.noaa.gov/data/hydrographic-surveys-contract-vehicle.html