When hurricanes strike, geospatial data becomes an essential tool for both immediate disaster response and long-term coastal resilience. After a storm, two phases of mapping typically occur: one immediately in the aftermath to aid emergency operations, and another months later to establish a new baseline of the changed landscape.
Woolpert completed sonar mapping of the channel leading to Port Tampa Bay after Hurricane Milton, enabling the port to be opened within three days of landfall.
Immediate post-storm mapping: a lifeline after landfall
In the days immediately following a hurricane, geospatial teams rush to collect critical data that helps authorities assess damage and safeguard communities. The focus is on speed and coverage:
- Aerial photography: Within hours, NOAA’s National Geodetic Survey (NGS) often flies aircraft over impacted areas to capture high-resolution aerial photos. For example, after Hurricane Helene hit the Southeast U.S. in 2024, NOAA rapidly released aerial imagery of flooded neighborhoods, eroded coastlines, and damaged infrastructure. These images enabled responders to map flood extent, identify blocked roads, and estimate structural damage, without waiting for ground surveys. Such imagery also aids in spotting hazardous debris or oil spills in waterways for immediate clean-up.
Similar to NOAA, the Civil Air Patrol (CAP) plays a major role locally in mobilizing aircraft to capture emergency aerial photographs. These are generally low obliques showing the maximum impact on structures and extent of flooding. For example, in 2024, the Florida Department of Emergency Management deployed CAP immediately following Hurricanes Debby, Helene and Milton to survey the areas where the hurricanes made landfall. This imagery is critical for identifying stranded homeowners and finding emergency evacuation routes.
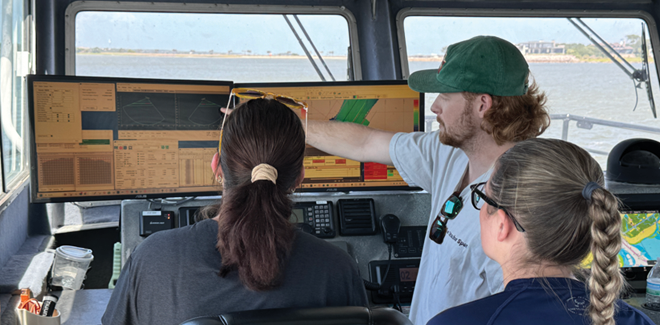
- Lidar and sonar quick scans: If it can be acquired, preliminary airborne lidar can be used to map terrain changes or debris piles in accessible areas. In the case of coastal storms, bathymetric sonar surveys of harbors and channels are conducted to ensure safety of navigation. After Hurricane Milton struck Florida in 2024, Port Tampa Bay—the state’s largest port—was closed owing to potential underwater hazards. NOAA’s Office of Coast Survey, the U.S. Coast Guard, and the U.S. Army Corps of Engineers (USACE) teamed up with Woolpert to perform an emergency multibeam sonar survey of the ship channel. Working overnight, the Woolpert survey team mapped the seafloor and confirmed that no shoaling or large debris were obstructing the channel. Thanks to this rapid mapping, Port Tampa Bay was able to reopen just three days after the hurricane, allowing fuel barges and relief supplies to resume flow—an outcome praised as critical for both public safety and the local economy.
Applications of immediate post-storm data
These fast-turnaround datasets are applied directly to emergency response and short-term recovery:
- Search and rescue: Up-to-date maps of flooded areas guide rescuers to stranded populations.
- Debris and damage assessment: Officials use aerial imagery to pinpoint where debris removal or repairs are needed most, often by comparison with pre-storm images.
- Navigation and infrastructure: Sonar results ensure ports, shipping lanes, and bridge foundations are safe, preventing accidents as maritime and transport
operations restart.
While speed is paramount (data is often collected and shared within 24-48 hours of landfall), the trade-off is that this initial data is not always survey-grade. Nevertheless, it provides an indispensable picture of the initial situation. As emergency response teams often say, these efforts help “keep eyes on” the disaster zone when traditional access is limited.
Long-term baseline mapping: preparing for tomorrow
After the immediate crisis subsides, attention shifts to establishing a new geospatial baseline. Typically, a few months after the event, once cleanup is done and waters recede, high-fidelity surveys are conducted to document the permanent changes caused by the hurricane. This data becomes the foundation for future planning and resilience.
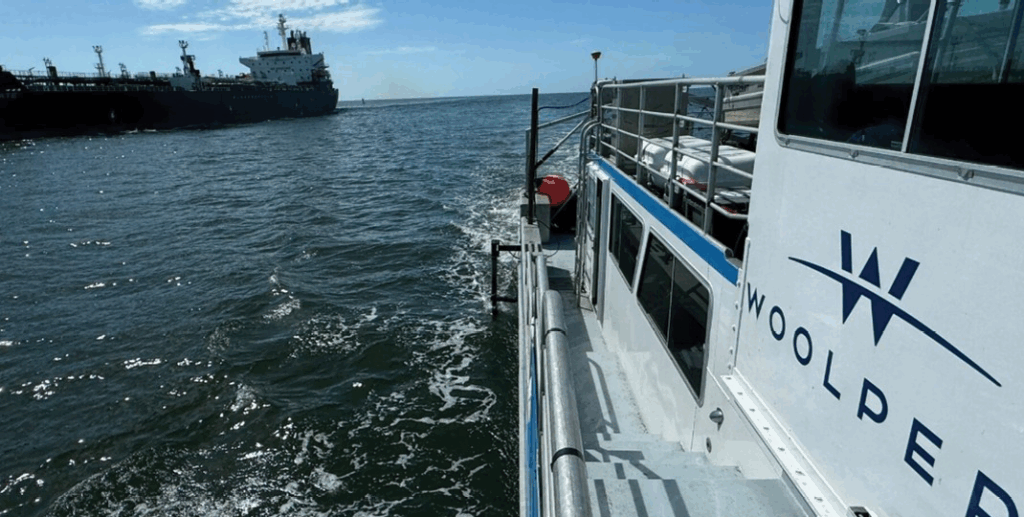
Woolpert completed sonar mapping of the channel leading to Port Tampa Bay after Hurricane Milton, enabling the port to be opened within three days of landfall.
- Topobathymetric lidar surveys: A flagship technique for post-storm baselining is airborne topobathymetric lidar, which uses a combination of infrared lasers (for land elevation) and green lasers (which penetrate water for bathymetry). By flying these sensors over the affected coast, we obtain a seamless 3D model of both terrain and shallow seafloor. Federal agencies such NOAA and USACE (via I-ATLAS Interagency Airborne Technologies for Lidar, Analysis, and Surveying, formerly known as JALBTCX) often fund these projects and contract private mapping firms to execute them. NGS uses the data to update the official U.S. shoreline and coastal maps. For instance, six months after a major hurricane, NGS may task industry partners to collect new lidar, which precisely captures how beaches, inlets, and floodplains have been reshaped. The result is an updated coastal dataset that serves as the “new normal” reference point.
- Drone Lidar for Debris Estimation: The use of drones (UAVs) to survey for debris volume estimation is becoming more prevalent for FEMA reimbursement. However, this is a topic for another discussion.
- Example – “Superstorm” Sandy: In one of the largest efforts of this kind, NOAA initiated the “Supplemental Sandy” mapping project. After Hurricane Sandy’s destructive landfall in 2012, Dewberry, Quantum Spatial (now NV5) and Woolpert collaborated under NOAA’s guidance to survey the Atlantic coast from South Carolina to New York. In 2013–14, they collected topobathymetric lidar and high-resolution imagery along ~1200 miles of shoreline. This resulted in detailed elevation models and orthoimagery of the post-Sandy coast. The data allowed NOAA to update nautical charts and coastal hazard models and provided coastal engineers and communities with a critical dataset for rebuilding. It also ensured that the impacts of any future storm in the region could be measured against a consistent post-Sandy baseline.
Why new baseline data matters
The benefits of the fresh information generated by this data are unarguable:
- Confirmation of lasting changes: For example, it measures how much sand a storm eroded or where new channels formed.
- Support for better reconstruction: Planners use the data to decide where to rebuild or bolster defenses (such as dunes or seawalls), armed with real measurements of the effects of the storm.
- Improvement of future forecasts: Updated models of the terrain and shoreline feed into flood prediction and simulation models, making future storm surge or inundation forecasts more accurate for the changed landscape.
- Legal and regulatory needs: An updated shoreline from NGS can redefine property boundaries, update flood zones, and inform environmental permitting. In essence, today’s post-storm survey becomes tomorrow’s “pre-storm” dataset for the next event, enabling a continuous improvement in readiness.
Public-private partnerships: a force multiplier
A persistent theme across both phases is the vital collaboration between government agencies and private geospatial firms. Major hurricane response efforts often exceed the capacity of government alone, and that’s where industry steps in.
- Rapid response: In urgent scenarios like Port Tampa Bay after Hurricane Milton, pre-established contracts allowed NOAA to utilize Woolpert’s surveyors and resources. This public-private coordination was key to capturing data and reopening the port in record time. Trust and advance planning (via contract mechanisms) meant that everyone knew their role when the storm hit, greatly speeding up the response.
- Large-scale surveys: For extensive post-storm projects (like the Supplemental Sandy mapping), multiple companies often join forces to support mapping requirements. The private sector brings specialized technology, extra aircraft and personnel, and expertise in data processing, while the public sector sets standards and ensures that the results serve broad public needs. The industry partnership for Sandy is a prime example of how pooling resources and know-how can achieve something that no single entity could easily do alone.
- Innovation and efficiency: These partnerships encourage innovation. Companies may use the latest sensors or develop new processing techniques during the project (for example, sophisticated algorithms to distinguish land and water in topobathymetric lidar data). The knowledge gained is often shared, improving practices for future events. Moreover, leveraging private firms can be cost-effective – agencies can scale up quickly after a disaster and scale down afterwards, rather than maintaining large year-round survey fleets “just in case”.
Thus geospatial professionals in both government and industry form a “team of teams” when disaster strikes, each contributing to the common goal of protecting lives and accelerating recovery through data.
 Amar Nayegandhi, CP, CMS, GISP is global head of technology and innovation and geospatial sector leader Woolpert. He is responsible for aligning, optimizing, integrating, and expanding Woolpert’s technology portfolio across its globally integrated architecture, engineering, and geospatial platform. Amar is an ASPRS Fellow and was the director of the ASPRS Lidar Division. He co-edited the ASPRS DEM Users Manual, 3rd Edition and authored the chapters on airborne topographic lidar and airborne lidar bathymetry.
 Al Karlin, Senior Geospatial Scientist, Dewberry, serves as a consultant on Florida-related lidar, topography, hydrology, and imagery projects.