What makes BayesMap Solutions special?
The BayesMap Solutions logo’s fuzzy lines represent the uncertainty in a probabilistic elevation model.
The geospatial community is most rewarded when academic know-how meets engineering realities to provide actionable data that can serve concrete business or societal needs. Yes, we’ve all heard that before, because that’s what we are all looking for. The goal is expressed in the first sentence above through many commendable buzzwords. Let’s go over what led to them becoming realities at BayesMap Solutions1.
The founder is a self-driven/self-taught computer programmer, trained in physics (including that of sensors) and remote sensing, passionate about predictive uncertainties. And just as important, he is persistent and not deterred by challenges (so he can tackle unsolved problems on his own even if it takes years to get there). He is rigorous like the academic he was for many years, but at the same time focused on usability (of software, but also of models and theories) and committed to provide the best solution. He built an astronomical image-processing software application while in high-school and later a full star-tracking hardware system complete with automatic control software.
He strongly believes data should be actionable, beyond immediate remote-sensing quality control; his wife is an earth scientist, hence the “so what” is not abstract in their household. And he can communicate. That also started years ago in a non-profit astronomy outreach program, where he improved water-rocket launchers and various material used to teach astronomy and space sciences2.
BayesMap Solutions is a business partner committed to having a positive impact in the world through: its own practices; helping academic research; encouraging clients to make corporate social responsibility (CSR) and sustainability statements for their company; and rewarding clients who have strong CSR and/or whose missions are related to sustainability, nature monitoring, nature preservation, etc.
Bayes and his theorem
300 years ago, Reverend Thomas Bayes (1702-61) was the first to provide a way of reasoning with uncertainty, deriving what is known as Bayes’ theorem (even if its canonical form and first practical applications are due to Laplace, we still refer to this kind of reasoning as Bayesian inference). It allows us to express the probability of a hypothesis given all the available data, also known as posterior probability, by combining the likelihood or the hypothesis (given by experimental measurements) with our prior knowledge.
Some history
BayesMap Solutions was founded in September 2014 in Castro Valley, California, a few miles southeast of Oakland (Figure 1). The family later moved further east to Pleasanton, and then to Mountain View, close to NASA Ames, in the heart of Silicon Valley. After 10 years in the US, the family moved back to France in 2022. BayesMap Solutions was registered as a French SAS in January 2023 and the home offices are located in the village of Le Rove, near Marseille (Figure 2).
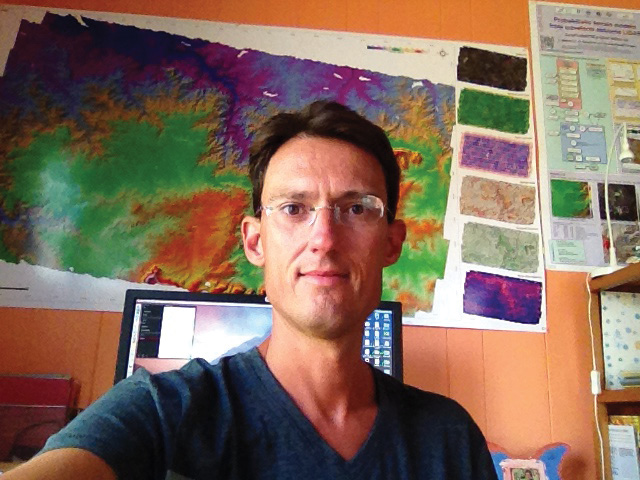
Figure 1: The author in BayesMap Solutions’ first office, between the basement and the backyard of his home in Castro Valley, California.
The goal has always been to provide unique consulting and software development services for the lidar industry, helping clients extract the maximum information from large, complex data sets. Initially, the focus was on consulting based on the academic experience of the founder. This could be research or development, but also custom data processing. The founder was hoping to be able to use some of his research code developed during past projects (waveform processing, filtering, and change detection) and run the software as a service to process data and deliver it to clients. This way, the developer runs the tools, which simplifies everything: no need for any user interface, manuals, training sessions or customer support!
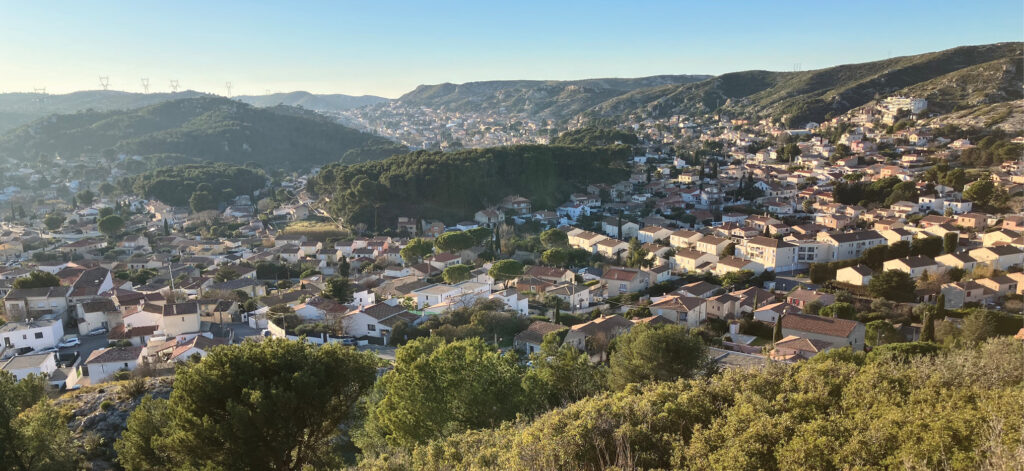
Figure 2: A view of Le Rove, in southeastern France, where the headquarters of BayesMap Solutions is located.
He quickly understood, however, that this type of business model was not going to work. The main reason was the licensing restrictions in California and many other US states – it is necessary to be a licensed land surveyor in order to sell XYZ positions, unless they are in the form of qualitative, low-resolution mapping products. Data transfer issues could be dealt with and software moved to the cloud, but obtaining a license was a different story.
Thus, BayesMap Solutions became a software company. Data collection companies would be the clients, and the production teams would run the software. The problem was to write production-quality code, which is not what most scientists usually do, but it had to be done. A command-line interface was the quickest to develop, and the founder was inspired by Martin Isenburg and the success of LAStools, which was popular in the industry and used as a command-line tool that people were willing to learn.
The WavEx software seemed a good place to start, since some waveform extraction code already existed (Jalobeanu and Gonçalves, 2014a), but soon enough more reverse engineering had to be done to be able to process data from more sensors (Jalobeanu and Gonçalves, 2012). Interestingly, the first academic client was a French university, and the first commercial one was a French company.
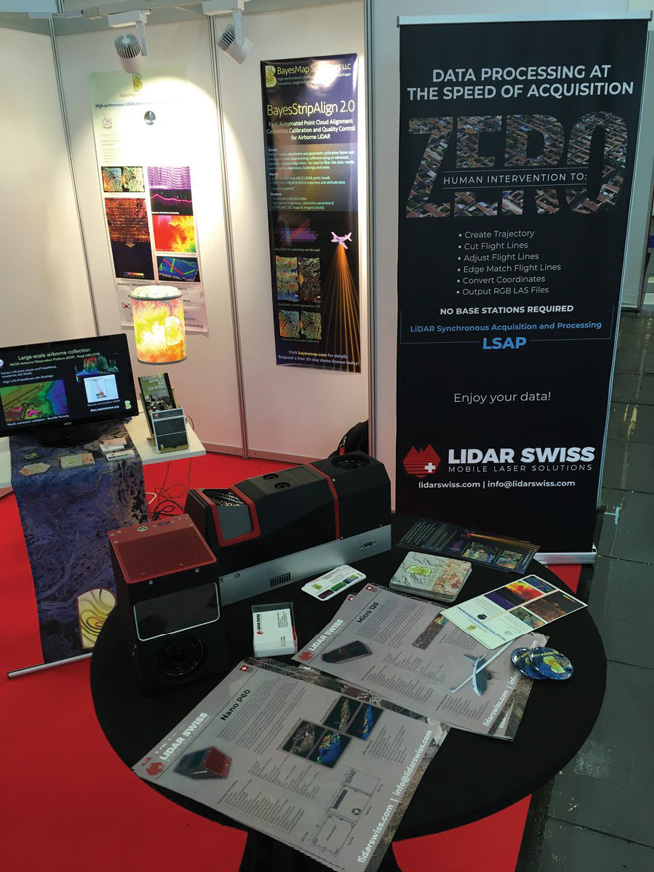
Figure 3: BayesMap Solutions co-exhibiting with LidarSwiss Solutions at InterGeo 2023.
Particularly close to the founder’s heart is the community that meets every year in Denver at Geo Week. ILFM 20153 was a great opportunity for BayesMap Solutions, indeed its first time to exhibit as a company, with a square booth decorated with colorful elevation models, posters of uncertainty maps, proposed software ideas and swag (the iconic DEM lamp proved to be very popular, and the free goodies, beer koozies, calendars and bottle openers were a success) (Figure 3). Among all the proposed ideas, lidar strip alignment attracted the most attention. Numerous prospective clients requested an alternative commercial solution to the one well-known software product then on the market, or the software supplied by the sensor manufacturers, and they were willing to buy it if it worked better and faster. That’s how StripAlign started (Figure 4).
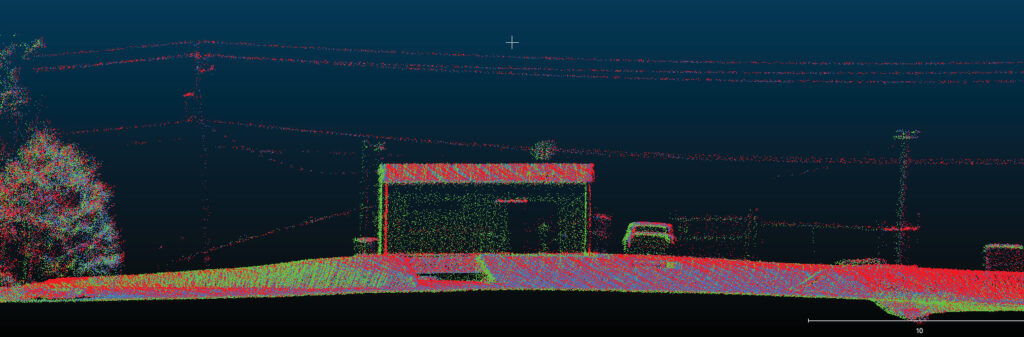
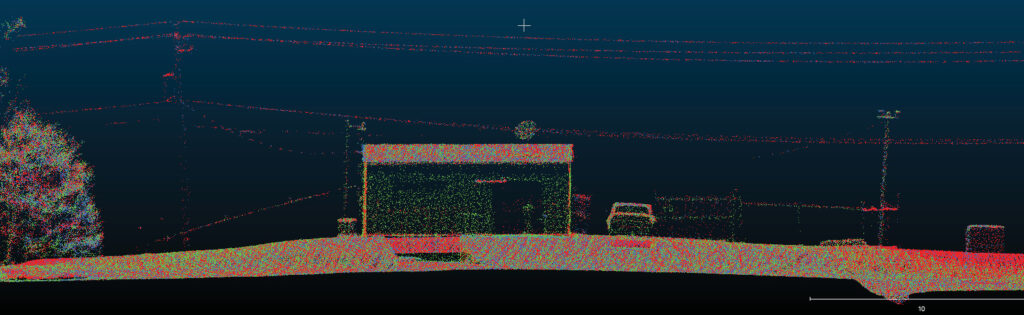
Figure 4: UAV point cloud cross-section showing the misalignment between flight lines (colored by flight line): top—before alignment, bottom—after alignment.
The demand from the industry was motivating, and the next few months were very busy with development, resurrecting some experimental registration algorithms, improving them, and ensuring that they worked on test data. Next, more work was required to put that into production, going from point-cloud registration to actual geometric correction. The effort fell not far short of developing an entire software package from scratch and testing it in a consulting project so the clients wouldn’t have to suffer the first bugs. Everything from storage went into the mix—probabilistic modeling, Bayesian inference, robust estimation, fast deterministic inversion and a lot of lidar geometry. Where other developers would have used triangular meshes and points, the founder used his experience in image processing, leading to new and powerful algorithms that were fast.
Thus, the prospects became clients, and they came from all continents—companies large and small, research institutions and government agencies4. They were happy with the improvement of both relative and absolute accuracy of their data. Of course, adjustments were made along the way, but the developer acted quickly, making necessary fixes as well as incorporating various new features suggested by clients. While the first versions of StripAlign were based on simplifying assumptions about flight-line geometry (so a product could be developed fast enough), version 2.0 was critical for the company’s success, not only allowing the alignment of cross-strips and complex scans, but also opening the way to alignment of UAV-lidar data, which is collected in a far wilder way than traditional large-scale airborne data5 (Figure 5). A few clients are also using StripAlign to correct sonar (multibeam echo sounder) data – the software simply needs point clouds with a trajectory, as long as elevation increases upwards. WavEx was given a few updates that made it more successful with point clouds, as the waveform market is relatively limited (but still very active in research institutions such as NEON6, which uses both software products in its workflow).
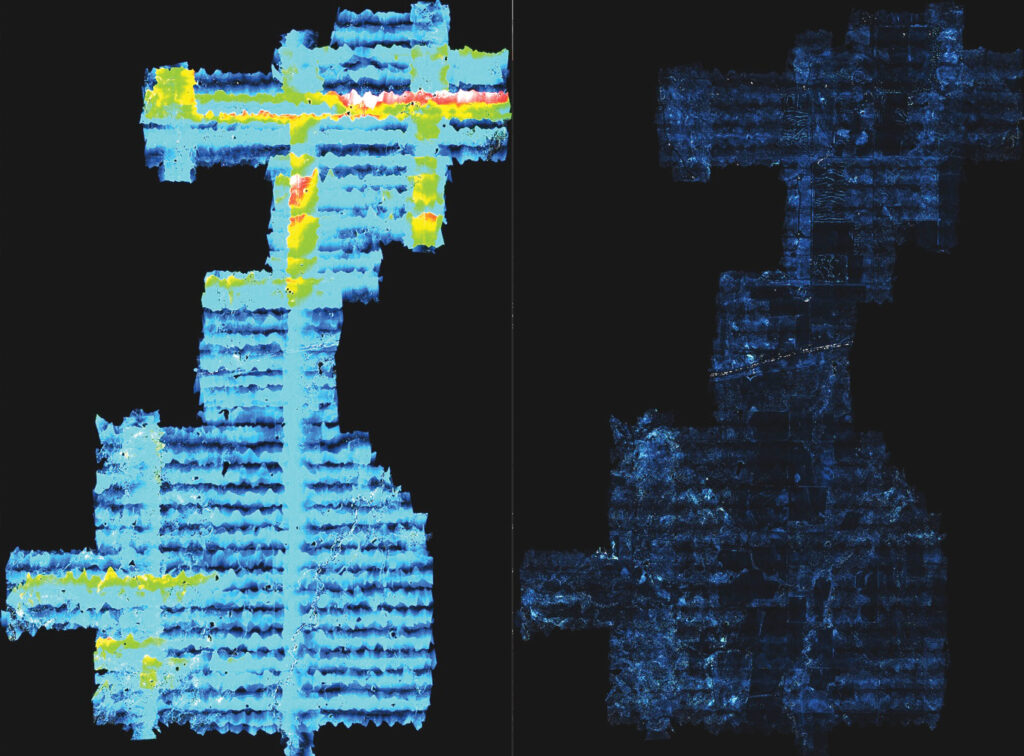
Figure 5: Relative error map (maximum absolute vertical difference between overlapping strips): left – before alignment, right – after alignment. The lack of color in the right-hand image shows that alignment of the strips has all but eliminated the vertical differences.
Switching to a subscription service was a wise decision, and helped differentiate the company from its competitors. BayesMap Solutions offers support directly from the developer, a few hours of training, consulting and testing, and the right to request new features. The company also partnered with various resellers across the globe to develop sales and offer lower prices, especially to small UAV-lidar companies. Some of these, for example GeoCue7 and Mad Nadir Mapping8, have integrated StripAlign directly into their software so the user doesn’t need to type a command line. The software is also available as a service on the Pointerra 3D9 and ROCK Robotic’s Rock Cloud10 platforms, which is perfect for occasional users, and easy to use, without learning the commands.
Ten years after its founding, BayesMap has three employees, two support specialists and one computer science student, and the company is likely to expand further. The last two products on the roadmap, accurate gridding and change detection, will be developed within two years, and a graphical user interface should be available in 2025. The two new products will complete the Bayesian toolset, as they rely on uncertainty propagation to generate probabilistic elevation models and help detect statistically significant changes. Starting with WavEx and its ability to provide range error estimates with each point, then StripAlign to correct the geometry, clients will be able to use a fully probabilistic pipeline to derive quantitative results for rigorous scientific applications (Figure 6).
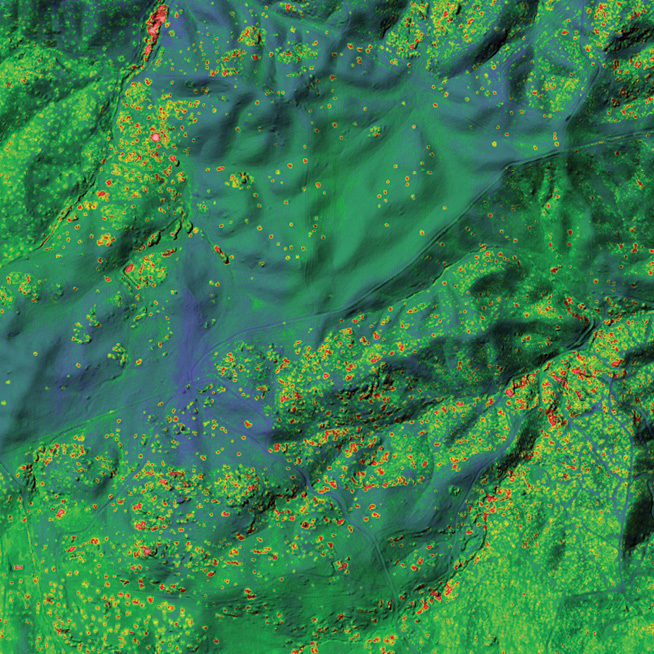
Figure 6: Predictive uncertainty map (spatial distribution of errors) using range uncertainties derived from full-waveform lidar data analysis.
The Bayes in BayesMap Solutions
Bayesian inference may look like magic, but it all comes down to computing the probability density of the unknown variables (which can be 3D points, orientation parameters or gridded elevations), given all the observations and available knowledge (or lack thereof). Models can be quite complex and have many extra parameters, but those are simply eliminated, or mathematically integrated out, to focus on what is really at stake.
To be more precise, a model describing data formation (e.g. sensor geometry and noise) is combined with all available knowledge about the quantity of interest (e.g. digital elevation model smoothness). The goal is to compute the posterior probability density function, using Bayes’s rule. This optimally combines data sources and expert knowledge in a consistent way. A probability density encodes both the optimal solution and the uncertainty, and Bayesian networks are used to propagate information and uncertainty further down the processing pipeline, all the way to the result, which is a quantity of scientific interest (e.g. snow depth). A spatial distribution of uncertainty on topographic models enables the user to obtain consistent results when deriving physical quantities, for flood analysis or change detection.
Bayesian inference requires an inverse approach, as opposed to direct problem solving in common engineering tasks. The optimal solution it provides actually works, as was shown by LidarSwiss Solutions, a business partner which developed the LSAP system11 (Figure 3). Using StripAlign onboard a UAV made it possible to reach an absolute accuracy upon landing very comparable to what would have been achieved via trajectory post-processing.
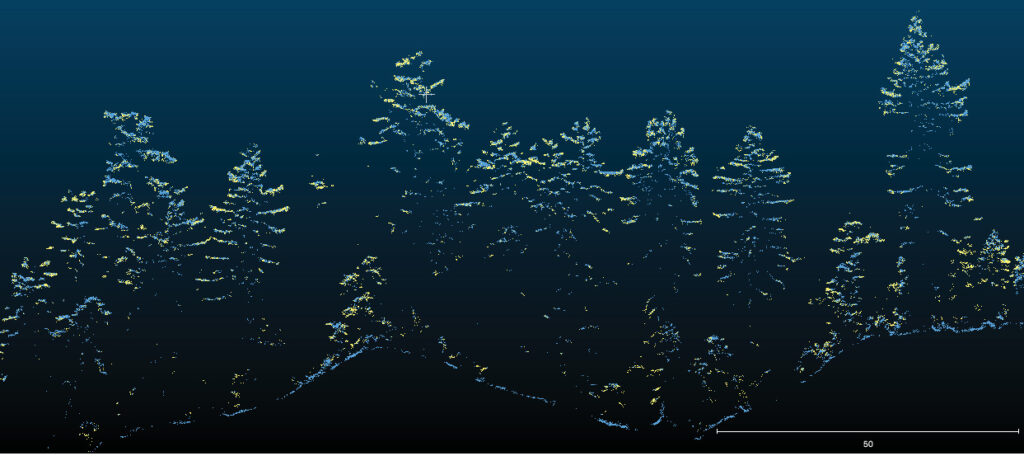
Figure 7: A cross-section of the final point cloud. The data, collected by GEO1/NV5 for the Earth Archive, was processed by BayesMap Solutions using WavEx and StripAlign.
In the geospatial field, Bayesian processing has been successful for the past 10 years, and now clients worldwide are using WavEx and StripAlign every day. By way of examples, let us mention the Muir Woods project (GEO1/NV512 and the Earth Archive13), where both software products were used (Figure 7); bathymetric data alignment by Airborne Research Australia14; UAV alignment by the Khmer Geographic Institute15 for Angkor Wat; alignment for the Klinaklini glacier topography change mapping by UNBC and Hakai Institute16; and NEON17 using both software regularly to process large-scale data and publish both aligned points and waveforms for environmental research.
Testimonial
Sometimes a heartwarming email arrives from a customer acknowledging that the products are working well. Matt Bethel, Director of Operations and Technology with Merrick & Company, Denver, Colorado, wrote: “I wanted to let you know that I got things running properly with your most recent advice/instructions and my test results look amazing. I am blown away by how well v2.0 is working. Thank you very much for the hard work you put in over the last year to get this to where it is now…especially handling the Optech Galaxy sensor. You have accomplished something that no-one else in the industry has been able to do. You should be very proud of your work!”
The founder of BayesMap Solutions
André Jalobeanu has been doing research in data processing and analysis (images, signals, time series, point clouds) for more than 20 years. The methods he develops use Bayesian inference, with an emphasis on automation and uncertainty estimation.
He received his Ph.D. in engineering and image processing from the University of Nice-Sophia Antipolis in France in 2001. This included developing new image deblurring algorithms in remote sensing using probabilistic inference.
After three years as a postdoc at NASA Ames in California, where he worked on rendering and 3D reconstruction from imagery, he returned to France and obtained a permanent research scientist position with CNRS near Strasbourg in 2004. He continued to do research on stereo vision and uncertainty propagation but this time from a data fusion perspective.
He moved to Portugal with his family after a few years and pursued more Bayesian stereo research until he concluded that lidar was more appropriate when it comes to computing elevation models with uncertainties in a rigorous way (Jalobeanu and Gonçalves, 2014b). He received a grant for a research project on probabilistic terrain models, which helped pay for full-waveform lidar acquisition in a nearby area and also a few students who helped with surveying. Little did he know that the data he purchased, collected with a RIEGL LMS-Q680 airborne scanner and flown by the French company IMAO, was delivered in a binary proprietary format that could not be read. But after a few months of reverse engineering (and with the help of a collaborator from Coimbra, Portugal) he was able to figure out the format and read the data, and they published the specifications (Jalobeanu and Gonçalves, 2012). Whether RIEGL was happy about that or not, he would not know until years later (Figure 8).
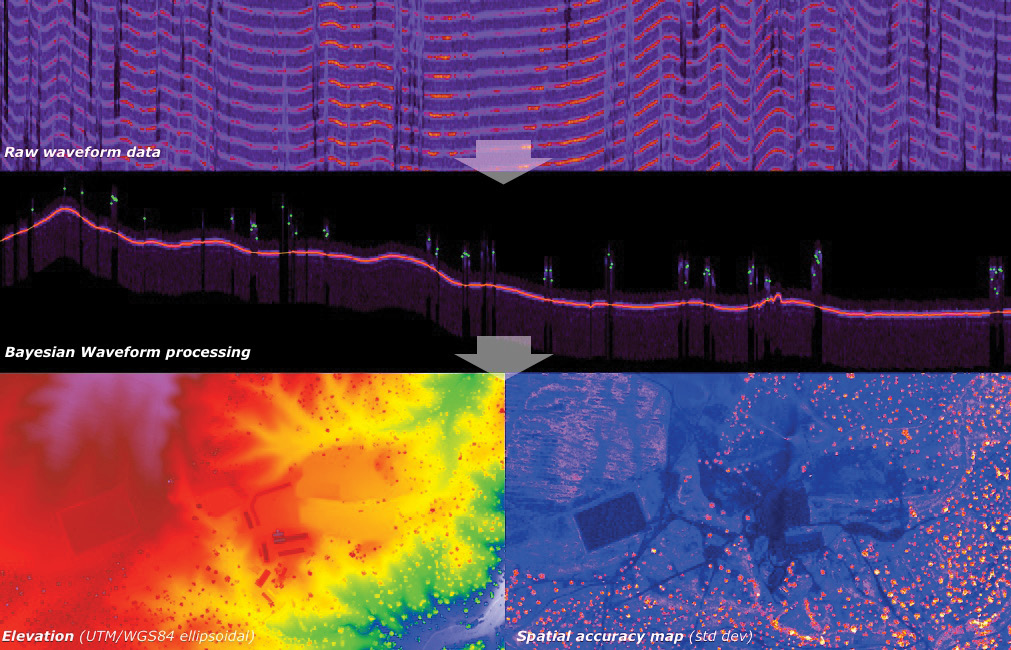
Figure 8: Starting from raw waveform data, Bayesian inference provides robust range information with error estimation, which can be used to derive probabilistic DEMs (elevation and predictive uncertainty for each height of the model).
He moved again, this time all the way to California, in the Bay Area but across the bay from NASA Ames. Networking during shows like ILMF helped find a senior postdoc position at the Naval Postgraduate School in Monterey, in the Remote Sensing Group, which was interested in his waveform and filtering research. He joined a DHS-funded Earthquake Response project where he contributed to change detection using point clouds (Jalobeanu, Kim, Runyon and Olsen, 2014). The team built mock-ups and scanned them with terrestrial sensors after they were punched and deformed to simulate damage. But he found that the main challenge was first to align the data, which at that time required a lot of manual, tedious work. That’s when he started thinking about new ways of registering point clouds. What started as a simple experiment on some troublesome archived data would become the inspiration for the best-selling software StripAlign, years later.
Federal funding eventually ran out, and he started looking for a new place in the Bay Area where he could pursue his research in lidar. Local companies were mostly interested in self-driving cars and city mapping for navigation, not so much in scientific data processing and error propagation. So he decided to start his own company.
Inspiration for new algorithms comes while hiking in the hills, running on the beach or sipping coffee poolside (Figure 9).

Figure 9: The founder of BayesMap walking in the hills near Le Rove, to find inspiration.
References
Jalobeanu, A. and G.R. Gonçalves, 2012. The full-waveform LiDAR Riegl LMS-Q680I: From reverse engineering to sensor modeling, ASPRS 2012 Annual Conference, Sacramento, California, 9 pp18.
Jalobeanu, A. and G.R. Gonçalves, 2014a. Robust ground peak extraction with range error estimation using full-waveform LiDAR, IEEE Geoscience and Remote Sensing Letters, 11(7): 5 pp, July 2014, 5 pp19. DOI:10.1109/LGRS.2013.2288152.
Jalobeanu, A. and G.R. Gonçalves, 2014b. The unknown spatial quality of dense point clouds derived from stereo images, IEEE Geoscience and Remote Sensing Letters, 12(5): 5 pp, December 201420, DOI:10.1109/LGRS.2014.2373133.
Jalobeanu, A., A. Kim, S.C. Runyon and R.C. Olsen, 2014. Uncertainty assessment and probabilistic change detection using terrestrial and airborne LiDAR, Proceedings of SPIE—The International Society for Optical Engineering, 9080: 19 pp, June 201421. DOI:10.1117/12.2049611.
- 1 bayesmap.com
- 2 astrorama.net
- 3 The International LiDAR Mapping Forum has been subsumed into Geo Week.
- 4 gim-international.com/content/article/extracting-more-value-from-lidar-data
- 5 gim-international.com/content/article/pushing-lidar-to-the-limits
- 6 National Ecological Observatory Network: data.neonscience.org/.
- 7 geocue.com
- 8 madnadirmapping.com
- 9 pointerra.com
- 10 freelidarprocessing.com
- 11 lidarswiss.com/technology/lsap
- 12 nv5.com/geospatial/solutions/geo1-1/; GEO1 was acquired by NV5 in 2022.
- 13 theeartharchive.com
- 14 gim-international.com/content/article/pushing-lidar-to-the-limits
- 15 kgi.xyz
- 16 universityaffairs.ca/news/unbc-supercomputer-reveals-acceleration-of-global-glacier-loss
- 17 neonscience.org/data-collection/lidar
- 18 For full text, visitresearchgate.net/publication/267556394_The_full-waveform_LiDAR_Riegl_LMS-Q680I_From_reverse_engineering_to_sensor_modeling.
- 19 For full text, visit researchgate.net/publication/259621590_Robust_Ground_Peak_Extraction_With_Range_Error_Estimation_Using_Full-Waveform_LiDAR.
- 20 For full text, visit researchgate.net/publication/268447030_The_Unknown_Spatial_Quality_of_Dense_Point_Clouds_Derived_From_Stereo_Images.
- 21 For full text, visit researchgate.net/publication/261723452_Uncertainty_assessment_and_probabilistic_change_detection_using_terrestrial_and_airborne_LiDAR.