Does the economic law of diminishing marginal returns apply to lidar point density?
Economics 101 teaches us the law (or principle) of diminishing marginal returns, which states that beyond a certain point of optimal capacity, the addition of another factor of production will result in smaller increases in output. All businesses abide by this classic economic principle, as it relates to decisions made in investing, marketing, and enterprise resource planning. For example, a restaurant owner will hire additional waiters to support the number of customers he expects to visit his restaurant; his profit and customer satisfaction rating will likely increase even though he is paying an additional salary for each subsequent waiter. However, given the limited size of the restaurant seating area and how quickly his chef can prepare the items in the kitchen, he will begin to see a decrease in his profit after a certain level of increased patrons. Until he can increase these other factors (such as seating area size, efficiency in the kitchen, number of chefs), he won’t need to hire more waiters. The restaurant owner’s ‘point of optimal capacity’ is defined by the maximum output (profit and customer satisfaction) per unit of input (number of waiters).
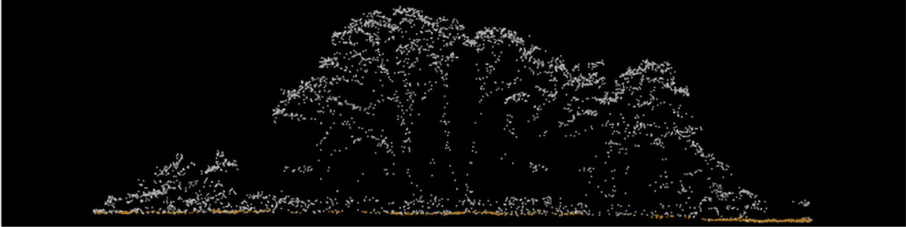
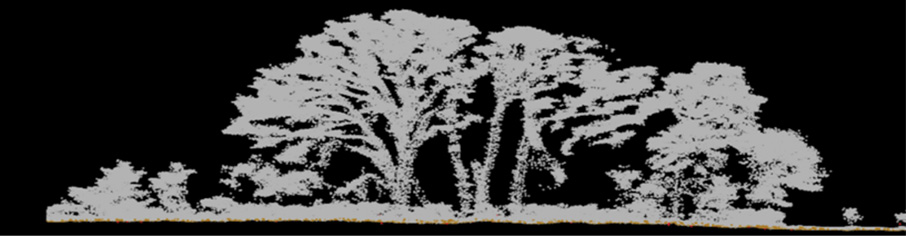
Figure 1: A profile across a canopy tree structure illustrates the level of detail in an 8 ppsm data set (above) and a 200 ppsm data set (below). Image courtesy of Dewberry
Does this principle also apply to the density of a lidar return point cloud? It certainly does, but we will address the point of optimal capacity in a point cloud and the factors that could be changed that will help us maximize output beyond the point of optimal capacity as defined today.
Is there an optimal lidar point cloud density?
A lidar point cloud is a set of spatially referenced 3D points captured by a lidar sensor. The density of a point cloud is typically defined as the number of “first returns” captured per unit area and represented as points per square meter (ppsm). While we recognize that this definition of “density” may not be ideal, the focus of this discussion, number of points, is independent of how the density is measured (as described in ASPRS Guidelines for Quantifying Horizontal Density of Aerial Lidar Point Cloud Data, Edition 1, Version 1.0, November 20241).
Several factors determine the usability of the data produced by a lidar sensor for a given application, including, but not limited to, spatial density, horizontal and vertical accuracy, classification of ground and above-ground features, and consistency in point distribution. The data usability is also based on the ability to characterize the desired amount of detail for the intended feature being mapped, such as the structure of a vegetated canopy, the slope of a terrain, or the modeling of a building rooftop. The key aspect of what is considered ‘optimal’ depends on the intended application. A flat parking lot can be modeled accurately with a point density of 2-4 ppsm, but if we want to model the vehicles in the parking lot, we will need 8-16 ppsm. Alternatively, if the intent is to train an AI algorithm to identify the make and model of those vehicles, we may need a higher density point cloud to accurately represent details of the vehicle’s shape. In another scenario, where we need to determine how water will flow in the parking lot in case of a flood event, 2-4 ppsm density will be sufficient. but we will need to achieve an absolute vertical accuracy of better than 10 cm RMSE. Less accurate point cloud data can still be used to train an AI model as long as the density to identify the type of vehicle is sufficient.
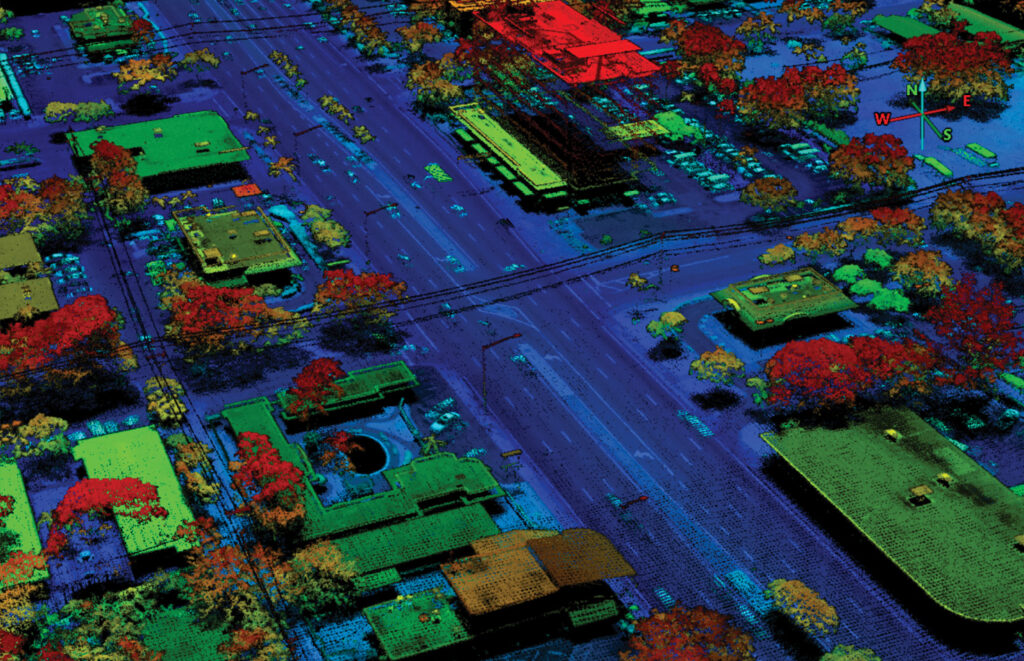
Figure 2: A high-density (100 ppsm) lidar dataset acquired for FDOT in 2017 illustrates the characterization of above-ground features (power lines, light poles, etc.) in very great detail. Image courtesy of Woolpert.
A canopy structure can be modeled with a “first return” point density of 2-4 ppsm, which could produce 6-12 returns within the canopy using a multiple return or waveform-resolving linear-mode lidar sensor. However, identifying individual tree stands in a canopy will require a much higher point density, and, depending on the canopy density, we may need upwards of 40 ppsm to accurately measure the tree canopy. For example, in a 525-acre tree assessment study conducted by Dewberry for a local developer within the Tampa Bay area in Florida, a very high point density dataset was acquired using the RIEGL VQ-1560 II sensor flown at 2000 ft AGL with 200% overlap using a cross-hatched flight pattern. The resulting dataset, which produced 200 ppsm for all returns (which is a density of ~50 ppsm for first returns), was used to measure the location of individual tree trunks, identify the tree type, and measure the diameter at breast height (DBH). When compared to a data set of 8 ppsm (Figure 1) over the same area, it is evident that for this specific application, the higher-density dataset was needed. This example illustrated that we need sufficient data density to penetrate through gaps in the top layers of the canopy to characterize the tree trunks and understory vegetation. The multiple look angles into the canopy through the cross-hatched flight pattern also enables better characterization of the canopy structure.
Accurate mapping for the utilities industry and the electric grid also requires high point density. Managing the transmission and distribution network requires detailed mapping of assets such as power lines, poles, and substation infrastructure, enabling accurate analysis of their condition, locations, and potential issues like vegetation encroachment. Most utility mapping surveys are conducted using airborne lidar mounted on an aircraft or helicopter, flying low and slow above the power lines to achieve 35+ ppsm density. These surveys are used for transmission networks and characterizing substations. Would a higher point density enable accurate mapping of the overhead distribution network?
The Florida Department of Transportation (FDOT) tasked Woolpert in 2017 to conduct a 100 ppsm density survey in a 25 square-mile urban area in Fort Lauderdale, Broward County, Florida. Two airborne survey missions were flown using the Leica ALS80 sensor at 3500 ft AGL with 30% sidelap to produce the required point density. The resulting data set enabled mapping of above ground features such as power lines, light poles, vehicles, and building rooftops with significant detail (Figure 2). This dataset was acquired for FDOT to assess the benefits of a high point density for various applications.
These examples suggest that an increased point cloud density does support additional applications, and that higher point density produces an output that has greater value. However, there does come a point when generating more data density may not add more value. It does depend on the application, but, even for the most demanding applications, point densities in excess of 50 ppsm (equivalent to 14 cm point spacing on the ground) may not provide any greater value, which is typically when laser footprint size exceeds the sample spacing for linear-mode airborne lidar sensors. So, should we consider recommending 50 ppsm as the optimal lidar point cloud data density for first returns with the potential to capture >200 ppsm in dense canopies?
50 ppsm density is fantastic, but what about the cost??
We can all benefit from higher point density, but there are budgets and financial considerations that can and should play a big role in decision making. Several studies have been conducted to assess the benefits of lidar data on a national scale. The 3D Nation Elevation Requirements and Benefits Study conducted by Dewberry is being used to plan for the next generation of the US Geological Survey (USGS) 3D Elevation Program (3DEP), following the completion of the nationwide coverage based on a similar study conducted in 2012. Due to a combination of technological advances, the increased need for higher-resolution data to support various applications, and the need to assess landscape change at a finer resolution in areas where natural disasters often occur, USGS is already supporting the collection of 8 ppsm density over large areas on a national scale. Advances in lidar technology have enabled the cost for an 8 ppsm collect to be lower than a 2 ppsm collect from a decade ago. However, a 50 ppsm collect using traditional linear-mode lidar technology will be considerably more expensive than 8 ppsm, as it must be flown at lower altitude with significant overlap.
What if we can reduce the cost by flying higher to cover more area and increase collection efficiency while also increasing point density? What if we can imagine a lidar sensor as an imager similar to an aerial 4-band imagery sensor that captures 6-inch (15 cm) photography at over 10,000 ft AGL? What if we can co-collect lidar and imagery in a single flight to further reduce cost? The lidar imager concept based on photon-counting/Geiger-mode technology is not new, but it has suffered in the past decade from early adoption without a focus on accuracy and reliability. What if we can co-collect linear- and Geiger-mode lidar and 4-band imagery in a single flight at 10,000 ft AGL to produce >50 ppsm ground density Geiger-mode lidar with the accuracy and reliability enabled by integrating linear-mode data, combined with 4-band imagery? The opportunities for a high point density lidar are endless, and, with recent advances in technology, the principle of diminishing marginal returns will continue to see a new point of optimal capacity for lidar density, just like the restaurant owner who has the opportunity to increase those other factors (seating area, kitchen efficiency, chefs) to hire additional waiters and continue to increase customer satisfaction and profitability. 
- 1 tinyurl.com/466zasxr