Most familiar lidar applications, such as terrain modeling, land development, and hydrology, focus on the bare-earth model, a digital terrain model (DTM), which is constructed using only the “ground” points from the lidar point cloud. Recently, however, forestry, archaeological, and digital-twin applications moved the focus for lidar applications from the bare-earth model toward enhanced uses of other classes of lidar returns in the point cloud. New and emerging applications, along with the higher pulse density achieved by today’s lidar sensors, have opened new avenues for lidar applications.
Aerial lidar has rapidly evolved from 1–2 pulses per square meter (ppsm) in the early 2000s, to 8–24 ppsm and even higher from uncrewed aerial vehicles. These high-density point clouds have been used to reveal anthropogenic features, sometimes entire cities (Khalil, 2023, 2024) that have been hidden from conventional aerial photogrammetry by dense vegetation. As pulse densities have increased and lidar sensors mounted on uncrewed aerial vehicles have become more common, detailed forestry and corridor transmission-line and transportation applications have also emerged. Most recently, high-density lidar and 3D modeling techniques have been merged to form the basis for constructing digital twins of entire US counties (Rich, 2023). As a result of these technologies coalescing and becoming affordable, municipalities have been eager to construct digital representations of buildings to assist in emergency management, planning, and historic preservation (Marcoux and Leifeste, 2022).

Figure 1: Increasing Levels of Detail (LOD) for 3D buildings from building footprints (LOD0) through photo-realistic modeled buildings (LOD4).
In 2023, Dewberry, an Esri Gold Partner, was tasked by the State of Connecticut to conduct a high-density, high-precision lidar survey of the state. The data, collected at 20 ppsm, is intended to serve multiple purposes, for example as a base layer for the Connecticut Cultural Resources Information System (ConnCris1). This on-line viewer is maintained in conjunction with the Connecticut State Historic Preservation Office (SHPO). To meet these needs, along with the bare-earth model and classified lidar point cloud, Dewberry’s deliverables include 3D building models (Figure 1).
3D building workflow
Dewberry evaluated the Level of Detail (Figure 1) required to meet the needs of SHPO. Following discussions with SHPO, Dewberry determined that LOD2 would meet both the economic and display requirements for the ConnCris viewer. Having focused on LOD2, Dewberry employed the Esri building extraction tools in the 3D Analyst Extension for the initial 3D building construction, using the “standard” workflow of (1) generating a bare-earth DEM, (2) extracting building footprints (LOD0), (3) classifying noise and building returns, (4) some manual clean-up of building footprints, and (5) applying the LAS Building Multipatch tool in ArcGIS Pro/3D Analyst to produce the LOD2 3D buildings.
Typical issues encountered with this workflow that required manual intervention in the automated Esri “standard” 3D building extraction workflow included the expected “donut” holes interior to polygons (Figure 2, top), connected multi-sided buildings (Figure 2, middle) and parked trailers (Figure 2, bottom). These issues were resolved by manual intervention.

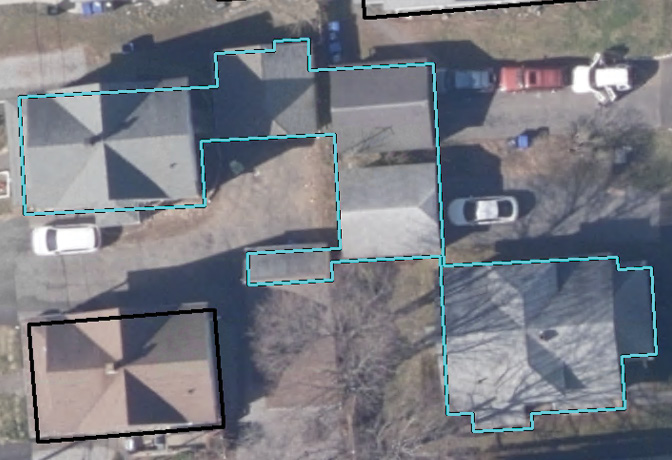
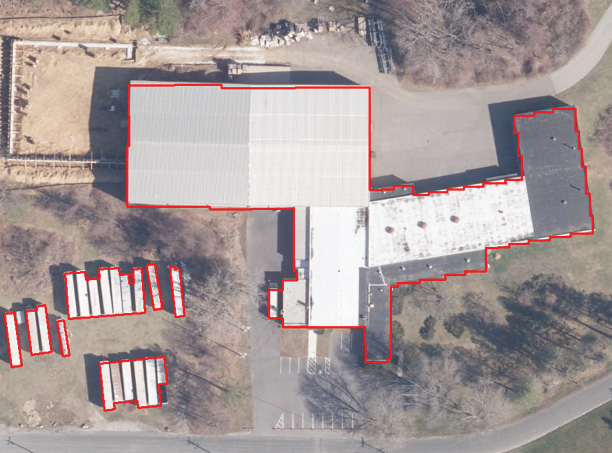
Figure 2: Typical issues requiring manual editing from automated building extraction. From top to bottom: “donut” holes interior to building outlines; multi-sided attached buildings; and parked semi-trailers.
To facilitate and optimize the building extraction process, Dewberry integrated the standard Esri tools into custom toolsets, then constructed a detailed workflow, including the manual quality assurance (QA) steps (Figure 3). This workflow produced 3D buildings with a minimum size of 75 square feet and a roof height of more than 8 feet, to meet the ConnCris criteria. Using this modified workflow, Dewberry identified over 1.2 million buildings.
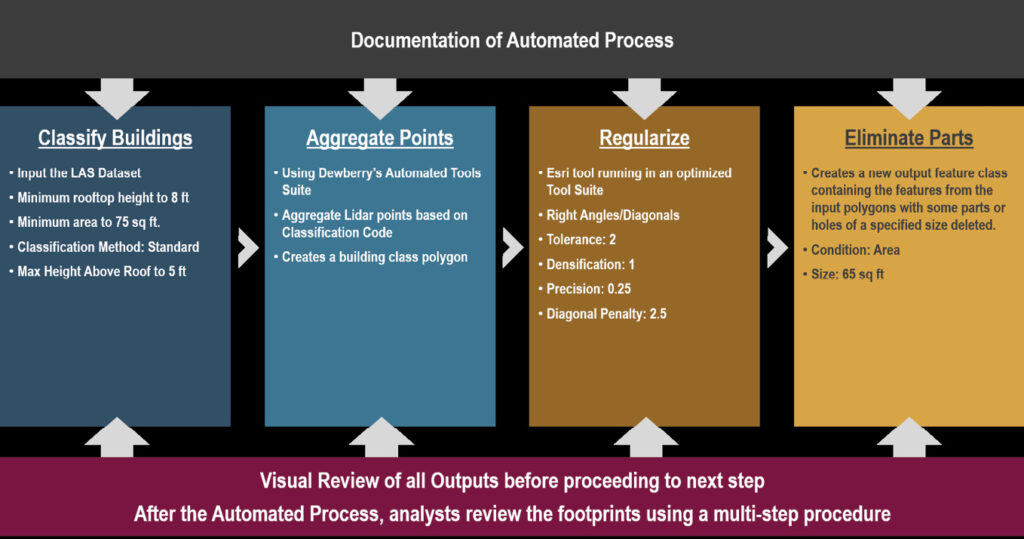
Figure 3: Dewberry’s modified workflow incorporating the Esri 3D Analyst tools and manual editing to produce 3D buildings to the ConnCriss specifications.
Historic buildings
The history of Connecticut predates the Revolutionary War (1775-83) and this is reflected in the cultural artifacts in the State. SHPO maintains the database for historic buildings built prior to 1880. Using the modified Esri 3D building workflow, Dewberry was able to identify the chimney position in the 3D buildings. Using this as the discriminating feature, those houses with central chimneys (Figure 4) were identified as historic structures. Several historic structures were obscured from photogrammetric detection under dense vegetation, but discoverable by lidar. 

Figure 4: Lidar point cloud of an obscured historic building showing central chimney as an indicator of building age.
 Alvan “Al” Karlin, Ph.D., CMS-L, GISP is a senior geospatial scientist at Dewberry, formerly from the Southwest Florida Water Management District (SWFWMD), where he managed lidar-related projects and Geographic Watershed Information System/Arc Hydro database development in cooperation with the Watershed Management Program. With Dewberry, he serves as a consultant on hydrology, topography, and imagery projects. He is currently vice president of ASPRS. In his spare time, he enjoys chasing after salamanders, frogs, lizards, and snakes, as well as growing tomatoes in his garden.
 Andrew Peters, GISP is senior associate, assistant department manager at Dewberry. He has over 15 years of experience in managing and producing more than 30 large scale GIS projects for federal and state clients in 25 states. Andrew regularly blogs on elevation- and lidar-related issues. In addition to his work with GIS asset management, Andrew specializes in using GIS to assess data accuracy by comparing raw lidar data with ground survey data, generating bare-earth models, and developing GIS methods for contour-line creation, flood analysis, and other terrain studies.
References
Khalil, J. 2023. Lidar reveals a hidden Mayan city. GPS World, August 8, 2023. (https://www.gpsworld.com/lidar-reveals-a-hidden-mayan-city/).
Khalil, J. 2024. Lidar reveals lost cities in the Amazon. GPS World, January 22, 2024. (https://www.gpsworld.com/lidar-reveals-lost-cities-in-the-amazon/).
Marcoux, J. and A. Leifeste, 2022. Impact of digital technologies on historic preservation research at multiple scales. Technology|Architecture + Design, 6(1): 22–31. https://doi.org/10.1080/24751448.2022.2040299.
Rich, S. 2023. Digital twin boosts growth, sustainability planning in Maryland county. Esri Blog. https://www.esri.com/about/newsroom/blog/maryland-county-planning-digital-twin/.