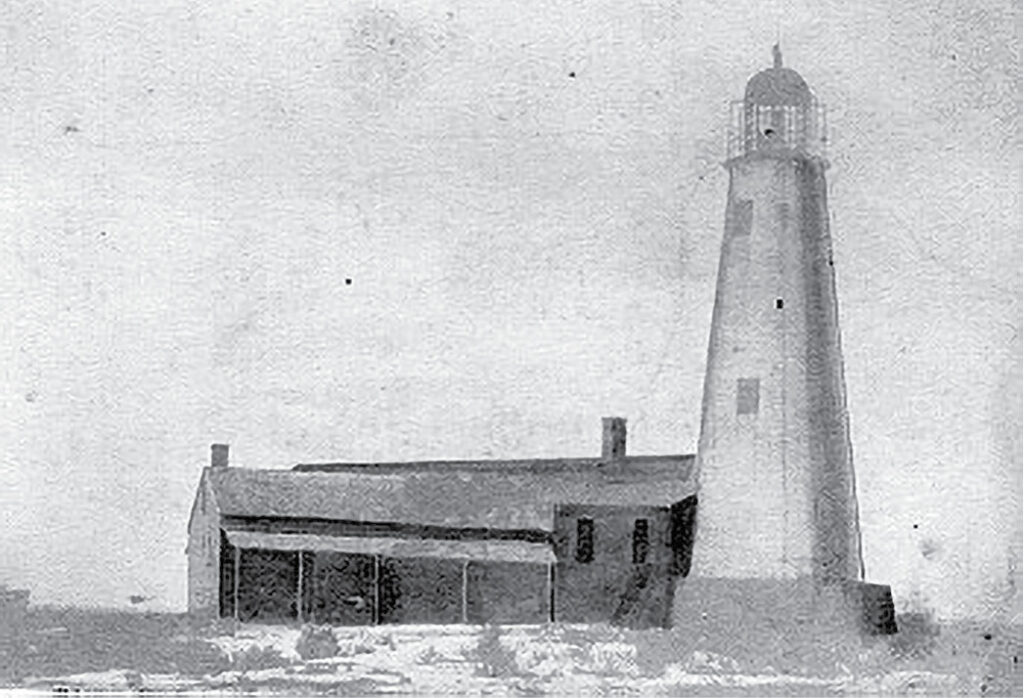
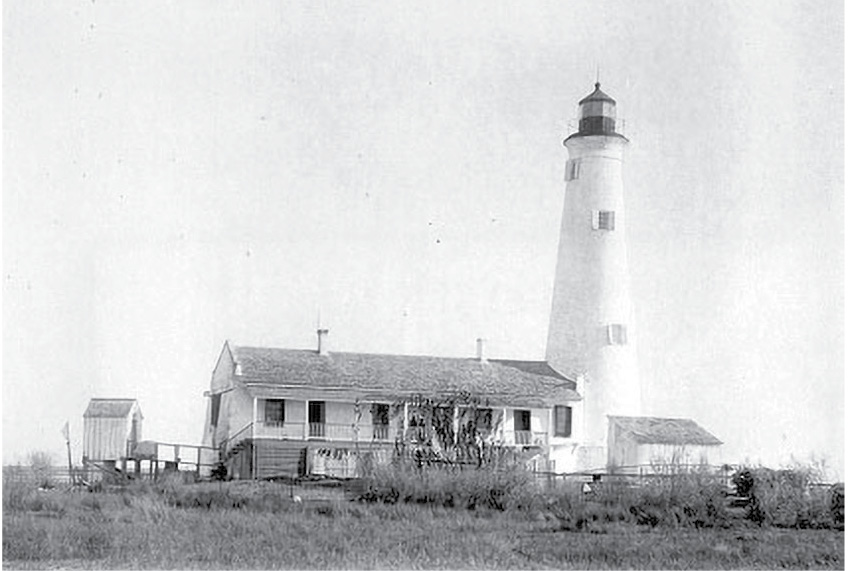
Two historic US Coast Guard photos, from 1831 (top) and 1842 (bottom), showing the St. Marks Lighthouse (the likely landmark used originally to position the Ochlockonee Shoal) as it would appear when viewed from the shoal, approximately 10 miles to the south.
A pronounced shallow area, known as the Ochlockonee Shoal, lies in the Gulf of Mexico about eight miles off the Big Bend of the Florida shoreline. The shoal is located at the confluence of the pre-historic channels of the Ochlockonee, St. Marks, and Aucilla Rivers (Figure 1). The shoal is believed to have been a topographic rise near that confluence during the last glacial maximum when the coastline itself was many miles seaward of its current location (Cole, 2021). As sea level rose during the last 15,000 years, the rise is believed to have become an offshore island. Then, based on the generally accepted rate of post-glacial sea-level rise (Basillie and Donaghue, 2011; Holmes, 2011), the shoal became completely submerged about 8000 years ago. The shoal appears on current National Oceanic and Atmospheric Administration (NOAA) nautical charts as having a least depth of three feet above mean lower low water (Figure 2).
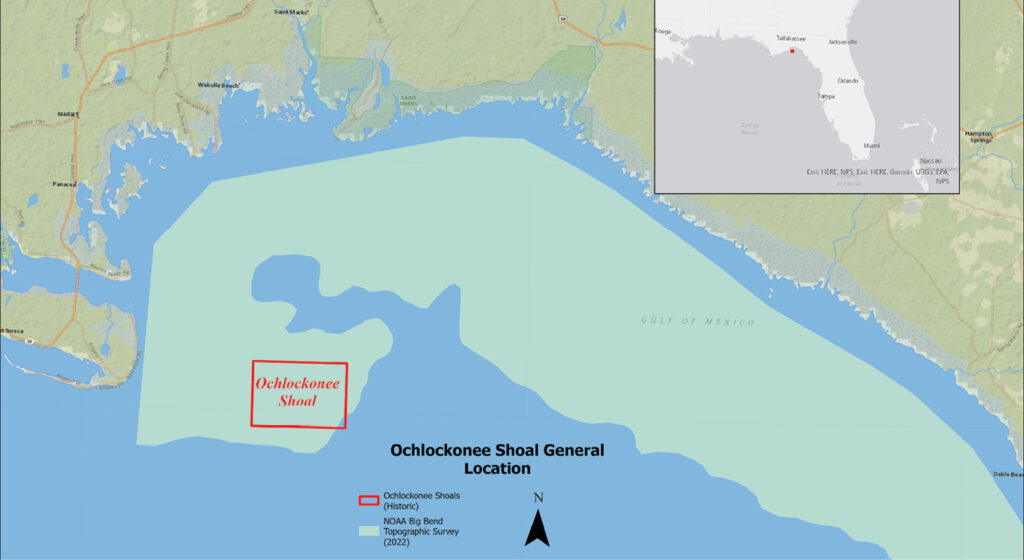
Figure 1: General location map of the Ochlockonee Shoal, east of Alligator Harbor in Franklin County, Florida.
The shoal and similar obstructions along the Gulf Coast have a long history of being a threat to shipping. The Spanish created a mission in the area north of St. Marks about 1633 to exploit the agricultural expertise and labor of the Apalachee Native Americans with the goal of alleviating the chronic food shortage at the St. Augustine colony. The mission soon began producing an abundance of corn and other crops, but the hazardous sea voyage through the shoals near the mission prevented transport to St Augustine on ships. To resolve this, the Spanish governor sent a hydrographic surveyor to the area to map a safe route through the shoals. Unfortunately, no record of that survey work has yet been found. Nevertheless, in 1639, the first Spanish fragata, loaded with corn and other produce from the new mission, successfully made the 800-mile trip, past the Ochlockonee Shoal and around the Florida peninsula, to rescue the starving St. Augustine colonists.
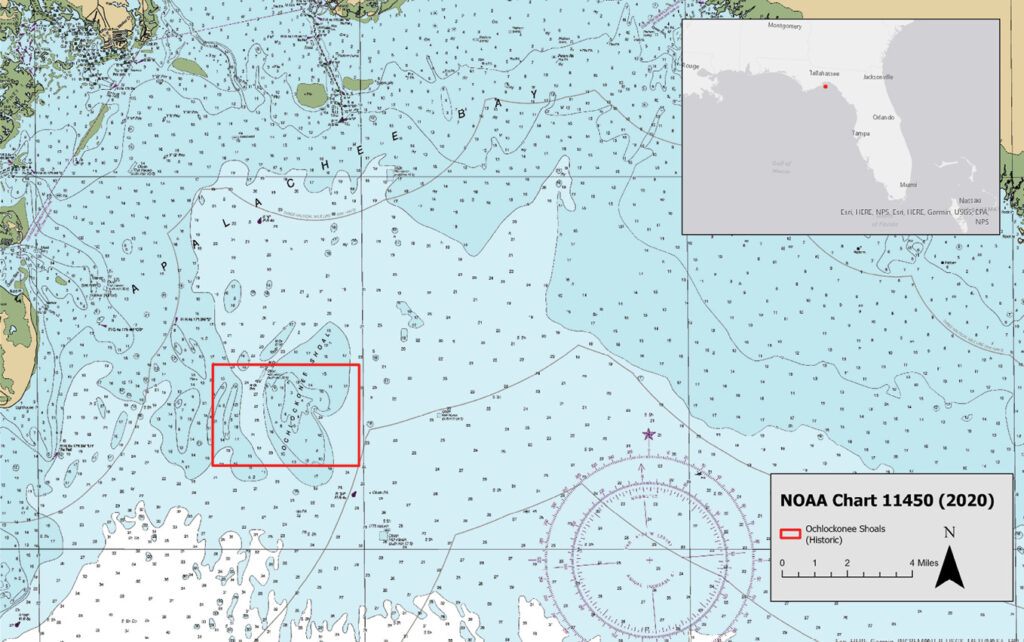
Figure 2: The Ochlockonee Shoal as shown on NOAA Nautical Chart 11450 (2020).
After Spain ceded the Florida Territory to the United States in 1821, the shoal continued to be a hazard to shipping. Prior to the extension of railroads to the area, the shoal was along the shipping route for cotton and other agricultural products from the Red Hills area of North Florida. Then, during the Civil War, when President Abraham Lincoln ordered a blockade of the Confederate coastline, the U.S. Navy squadron guarding the Gulf experienced great difficulty in patrolling the Big Bend area because of shoals (Cole and Ladson, 2020). As a result, the area became a favorite of ships trying to run the blockade, as well as for Confederate salt production.
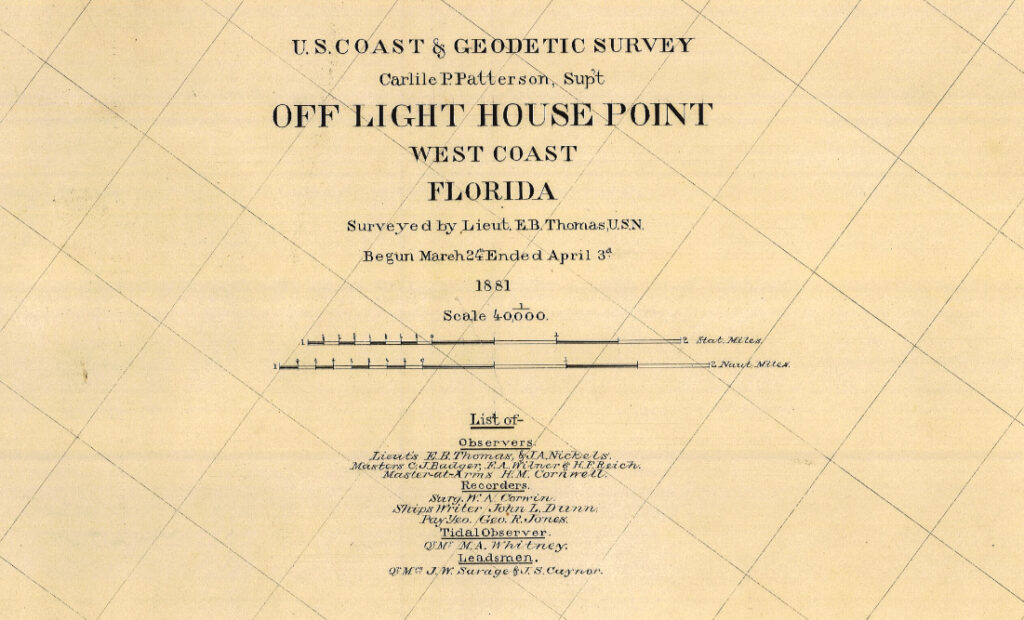
Figure 3: Title caption from 1881 U.S. Coast and Geodetic Survey draft chart (HO1489).
Owing to the problems experienced during the Civil War, Congress requested the Coast and Geodetic Survey (C&GS) unit to map the shoal. As a result, in 1881, C&GS mapped the shoal (Figure 3), under the direction of Lt. E.B. Thomas. The resulting draft chart was eventually published two years later (Chart LC00182; Figure 4.)
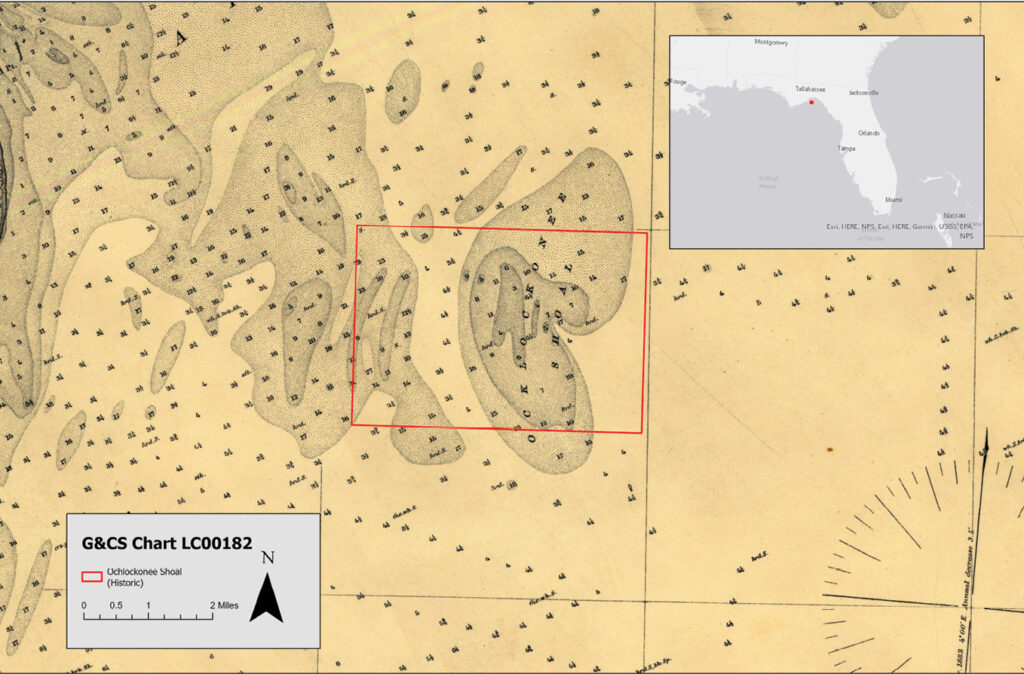
Figure 4: The Ochlockonee Shoal as originally published on NOAA (C&GS) Nautical Chart LC00182 (1883).
Research into the history of the hydrographic data used to compile the current chart (Figure 2) indicates that sounding and depth contours around the shoal were based solely on the hydrographic survey (U.S. Coast & Geodetic Survey HO1489) conducted in 1881 (Figures 3 and 4). Although the descriptive report for the survey is not available, the soundings for that survey would have used a lead-weighted line for measuring depths and some type of visual positioning process, such as horizontal sextant measurements, for establishing the geographic positions of the soundings.
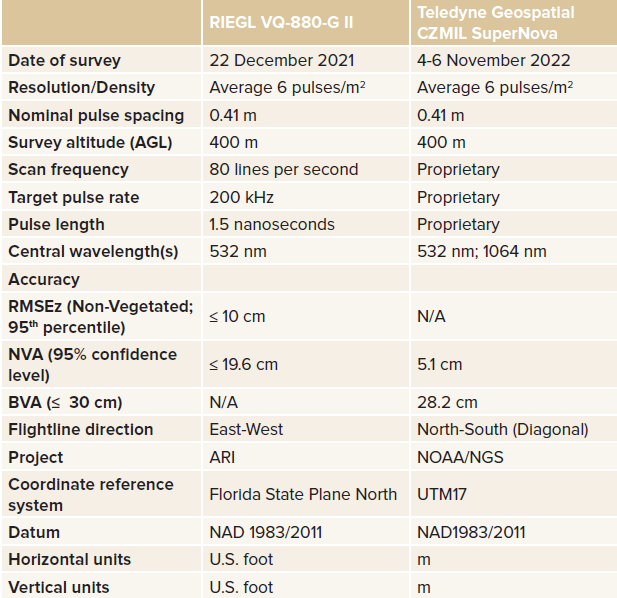
Table 1: Specifications for topobathymetric lidar surveys of the Ochlockonee Shoal area.
From Chart LC00182 (Figure 4), it is clear that the 1881 C&GS survey measured only four sounding lines across the shoal, none of which sampled its apparent geometric center. The sparse survey of the shoal, in combination with the absence of any subsequent and/or newer NOAA records, suggests that very little hydrographic information was collected regarding the shoal during the 140-year span between 1881 and 2021.
Recent topographic lidar surveys
Due to the lack of data for the shoal and the potential for it to contain priceless archaeological, historical and geologic information, the Aucilla Research Institute (ARI), a private non-profit research institute, contracted for a bathymetric lidar mapping of the shoal using grant funding from the Florida Division of Historic Resources and the Ingals Foundation. Unfortunately, the funding was insufficient to map the entire shoal area. NV5 Geospatial was contracted to acquire and process the lidar data. The area of interest (AOI) (Figure 5) was surveyed on December 22, 2021 using a RIEGL VQ-880-G II topobathymetric lidar sensor.
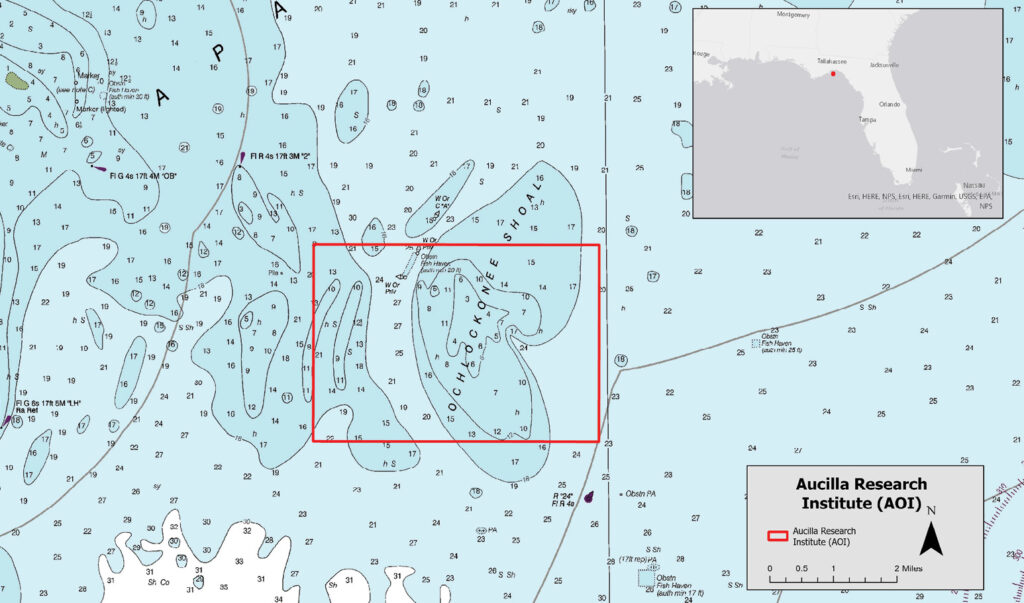
Figure 5: Aucilla Research Institute/NV5 (2021) Ochlockonee Shoal topobathymetric area of interest.
In 2022, however, NOAA/NGS (National Geodetic Survey) tasked Dewberry to map a much larger area in the Big Bend, including the ARI/NV5 lidar footprint (turquoise area in Figure 1). This NOAA/NGS mapping was performed on November 4-6, 2022 using a Teledyne Geospatial Coastal Zone Mapping and Imaging Lidar (CZMIL) SuperNova topobathymetric lidar sensor. Table 1 compares the technical specifications of the two surveys.
Lidar deliverables
In addition to the classified (ASPRS bathymetric classification) lidar point clouds, deliverable products from both the 2021 and 2022 surveys included: topobathymetric bare earth digital elevation models (DEMs), normalized intensity images, and vector representations of the flightlines, project boundary, and ground surveys. One-foot topobathymetric contours were generated from the DEMs. Portions of the 2021 survey are available directly from ARI; the 2022 survey products are available on the NOAA Digital Coast data viewer (https://www.coast.noaa.gov/dataviewer/#/).
Comparison between the two lidar sensors
Both the RIEGL VQ-880-G II and the Teledyne Optech CZMIL SuperNova are considered to be state-of-the-art topobathymetric sensors by the airborne lidar community. While the VQ-880-G II is a single frequency sensor with a 532 nm laser rated at 1.5 secchi depth, the CZMIL SuperNova is a dual frequency sensor with both a 532 nm and 1064 nm laser rated at 3.5 secchi depth.
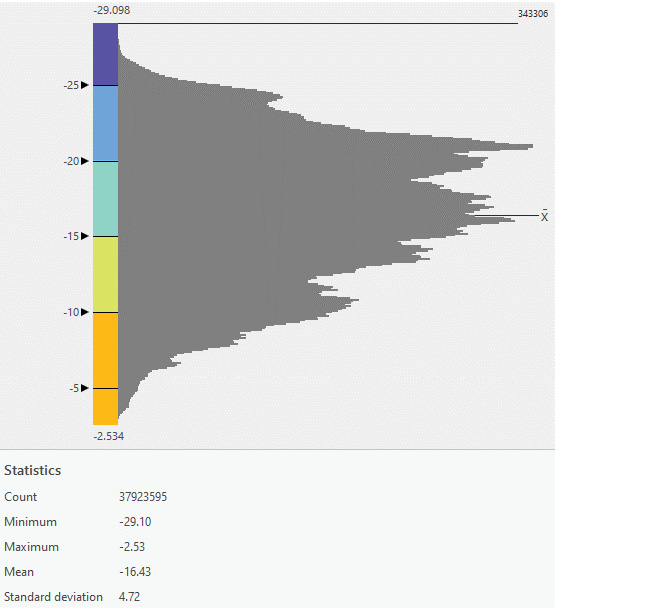
Figure 6: Depth response distribution from the VQ-880-G II sensor.
Despite these differences, both sensors performed well in the relatively clear waters off the Aucilla River. Figure 6 shows the depth response distribution for the ARI AOI derived from the VQ-880-G II and Figure 7, from the CZMIL SuperNova. It is apparent that the response was very comparable between the sensors, with mean depths of -16.43’ and -17.32’ respectively. Similarly, the standard deviation in depth response was also comparable, 4.72’ and 5.79’ respectively. However, the range of depths recorded by the CZMIL SuperNova extended both higher (-1.94’ vs -2.53’) and lower (-34.21’ vs. -29.1’) into the water column than those recorded by the VQ-880-G II. The excess number of recordings for the CZMIL SuperNova resulted from the increased coverage in deeper water (see Figure 8).
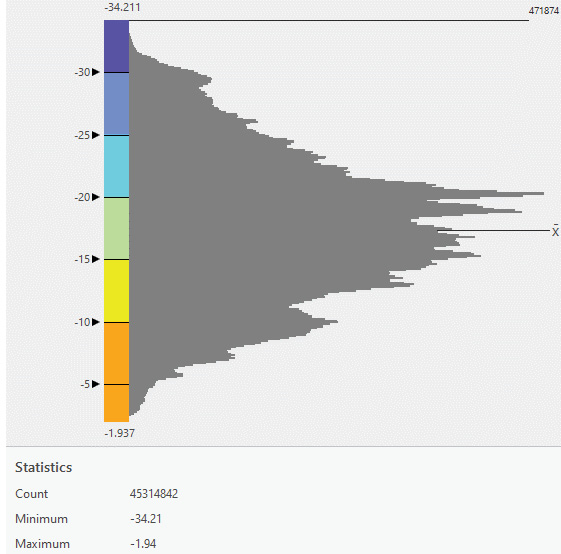
Figure 7: Depth response distribution from the CZMIL SuperNova sensor.
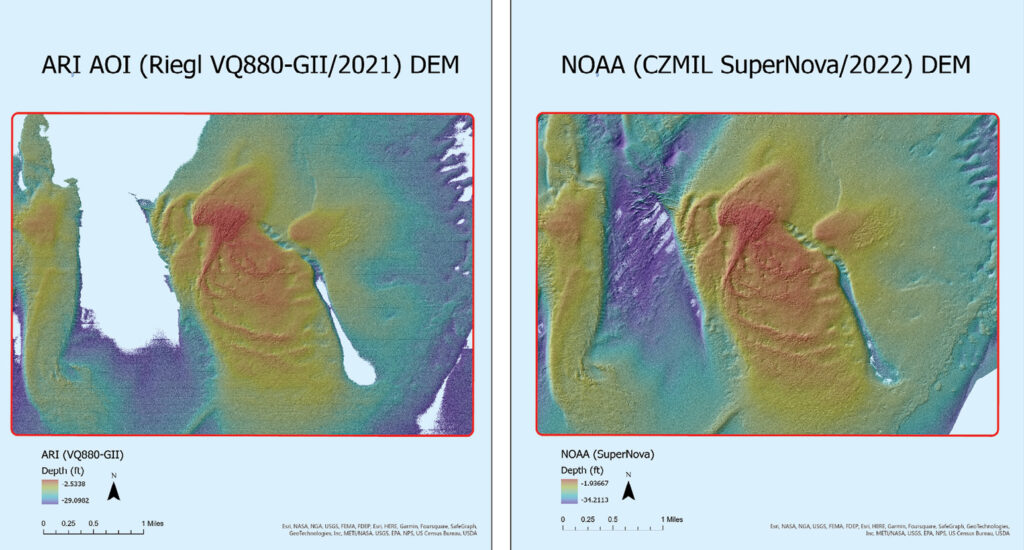
Figure 8: Comparison of the ARI/VQ-880-G II DEM (left) and the NOAA/CZMIL SuperNova DEM (right). Both DEMs are shown as a 5X exaggerated hillshade raster.
DEM comparison
Bare-earth topobathymetric DEMs were constructed by NV5 and Dewberry from the Riegl VQ-880-G II and CZMIL SuperNova lidar data, respectively. Esri ArcGIS Pro v3.1 was used to extract the CZMIL SuperNova/NOAA DEM to the extents of the ARI AOI, and to project (bilinear interpolation) and scale the CZMIL SuperNova/NOAA DEM to the coordinate reference system of the ARI AOI DEM.
Figure 8 shows the unprocessed bathymetric DEMs as a hillshaded (5X exaggeration) raster. There are noticeable differences in coverage between the two DEMs. While the ARI/VQ-880-G II DEM shows depths to -29.1’, the NOAA/SuperNova DEM shows depths down to -34.2’; a full five feet lower. This depth range results in several void areas in the ARI/VQ-880-G II DEM, particularly to the west of the shoal, and along the finger to the east of the shoal. The higher elevations (in red) on the Ochlockonee Shoal and the smaller shoal to the west are also slightly better defined in the NOAA/CZMIL SuperNova DEM.
Comparison between the two lidar sensors and NOAA Nautical Chart 11450 (2020)
As previously noted, the NOAA Nautical Chart 11450 mapping the Ochlockonee Shoal has remained unchanged since the 1881 C&GS work. We digitized the 6’, 12’ and 18’ isobaths from Chart 11450 and present those contours over the topobathymetric lidar-derived DEMs (Figure 9, top). Then we constructed three longitudinal profiles through the shoal and plotted the elevations along the profiles (Figure 9, bottom) for each topobathymetric lidar-derived DEM.
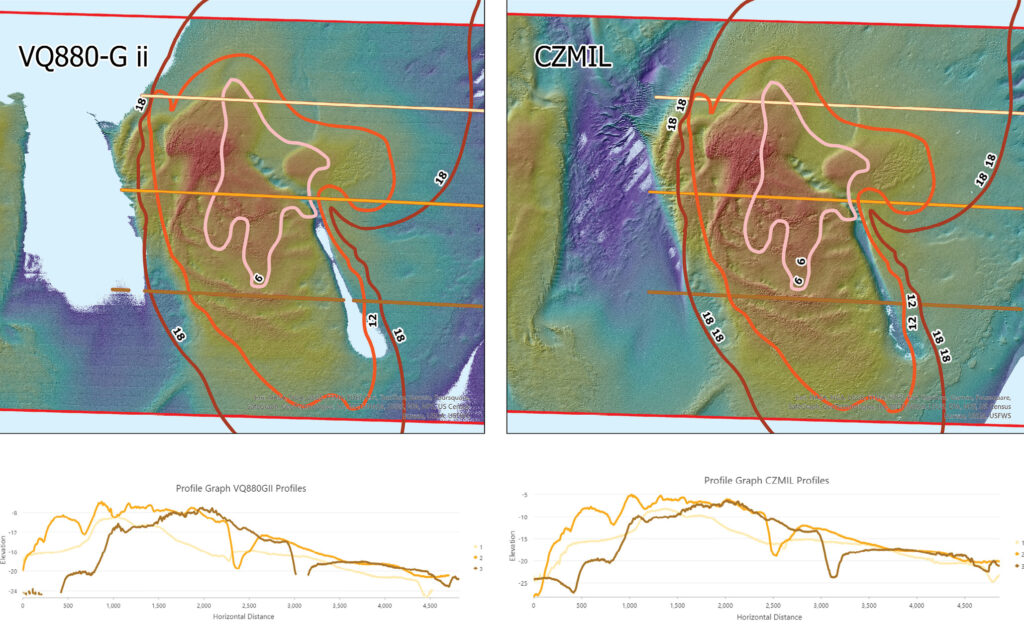
Figure 9: Topobathymetric lidar-derived DEMs with NOAA Nautical Chart 11450 contours and longitudinal profiles (top). Under each DEM is the color-coded plot of the profile elevations.
In general, the profile elevations are very similar to each other and bear little resemblance to the contours from NOAA Nautical Chart 11450. The center profile, in orange, shows a very gradual, but steady, slope to the east and the southern profile, in dark orange, shows a very steep rise to the shoal area. Neither of the profiles shows close agreement to the NOAA Chart 11450 contours.
Summary
Both sensors, the RIEGL VQ-880-G II and the Teledyne Geospatial CZMIL SuperNova, performed very well in the near-shore waters off the Aucilla River in the Big Bend region of Florida. The CZMIL SuperNova achieved returns from water depths to over 34 feet while the VQ-880-G II achieved returns to a little over 29 feet of water. This difference results in void areas in the DEM derived from the VQ-880-G II data that were not void in the DEM from the CZMIL SuperNova data.
There was little congruence between NOAA Nautical Chart 11450 Ochlockonee Shoal isobaths and either of the DEMs constructed from topobathymetric lidar. While the topobathymetric lidar data was collected more than 140 years after the hydrographic survey that was used to produce the NOAA Nautical Chart, the utility of topobathymetric lidar data for updating bathymetric data in the area of the Ochlockonee Shoal, and most likely the entire area of NOAA Nautical Chart 11450, is clearly demonstrated.
References
Basillie, J.H. and J.F. Donaghue, 2011. Northern Gulf of Mexico sea-level history for the past 20,000 years. In Buster, N.A. and C.W. Holmes (eds.), Gulf of Mexico: Origin, Water, and Biota. Volume 3: Geology, Texas A&M Press, College Station, Texas, 446 pp, 53-72.
Cole, G.M., 2021. Mapping the Ochlockonee Shoal, Monticello News, November 24, 2021. https://ecbpublishing.com/mapping-the-ochlocknee-shoal-george-m-cole-aucilla-research-institute/.
Cole, G.M. and J.E. Ladson, 2020. The Aucilla in the Civil War, Monticello News, September 3, 2020. https://ecbpublishing.com/the-aucilla-in-the-civil-war/.
Holmes, C.W., 2011. Development of the northwestern Gulf of Mexico continental shelf and coastal zone as a result of the Late Pleistocene-Holocene sea-level rise. In Buster, N.A. and C.W. Holmes (eds.), Gulf of Mexico: Origin, Water, and Biota. Volume 3: Geology, Texas A&M Press, College Station, Texas, 446 pp, 195-208.