Since the beginning of the 21st century, airborne lidar (light detection and ranging) has entirely revolutionized topographic data acquisition. National mapping agencies around the globe have quickly adopted this active remote sensing technology and gradually changed their production workflows for the generation of national and transnational digital terrain models (DTMs). Over the last 25 years, enormous progress has been made in both sensor technology and data processing strategies. The weight and size of sensors has decreased significantly, and this now allows the integration of survey-grade laser scanners on UAVs (uncrewed aerial vehicles). Scan rates, in turn, have increased dramatically, enabling point densities beyond 20 points/m2 (ppsm) and, consequently, derived products with sub-meter resolution. While the precise geometry and the capability to penetrate vegetation are highlights of airborne lidar, the radiometric content is increasingly used, e.g., for improved semantic labeling of the captured 3D point cloud. The aim of this four-part tutorial is to revisit the principles of airborne lidar and to discuss current trends. While Part I covers the basics, Parts II-IV provide details about integrated sensor concepts, laser bathymetry and UAV-lidar.
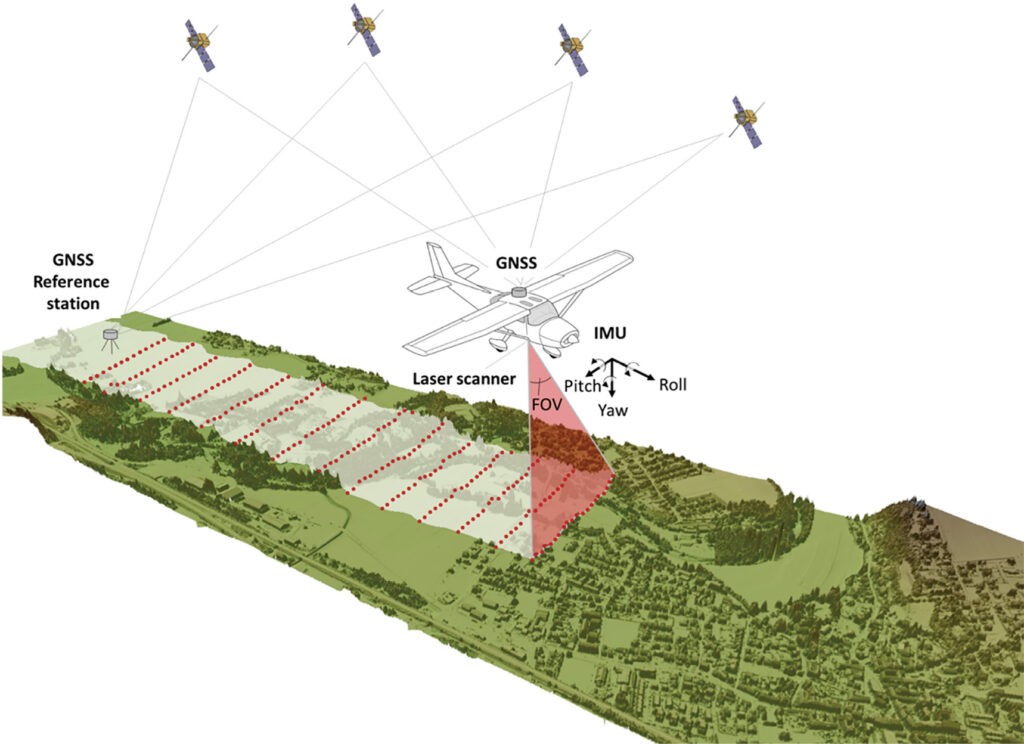
Figure 1: Schematic diagram of airborne lidar.
The underlying concept
Airborne lidar is a kinematic 3D data acquisition method delivering 3D point clouds of the Earth’s surface and objects thereon like buildings, infrastructure, and vegetation. The three main components are: (i) the laser scanner consisting of the lidar unit (ranging) and the beam deflection unit (scanning), (ii) a Global Navigation Satellite System (GNSS) for measuring the platform’s position in a Cartesian, georeferenced coordinate system, and (iii) the Inertial Navigation System (INS) delivering the platform’s attitude.
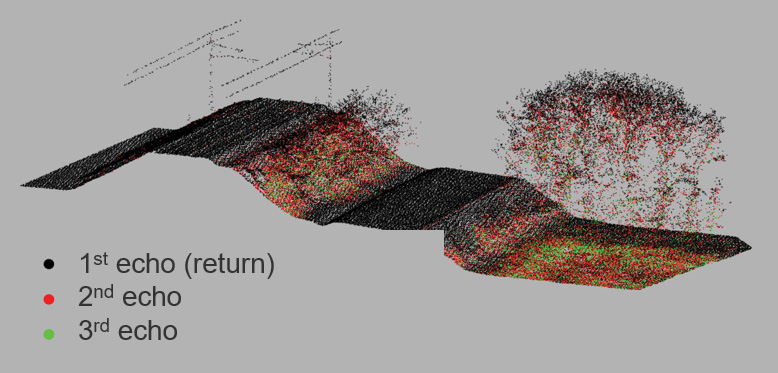
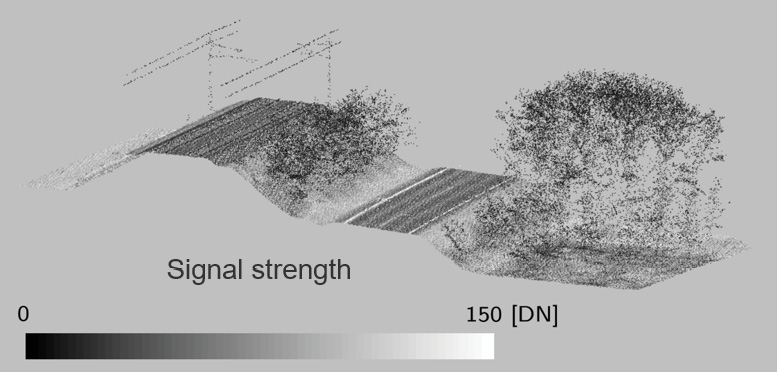
Figure 2: 3D airborne lidar point cloud: colored by echo number (top); colored by reflectance (bottom).
For the sensor system depicted in Figure 1, the laser beams are continuously sweeping in the lateral direction and, because of the forward motion of the platform, a swath of the terrain below the aircraft is captured. The distances between the sensor and targets on the ground are determined by measuring the roundtrip time of an outgoing laser pulse and the portion of the signal scattered back from the illuminated targets into the receiver’s field of view (FoV). This is commonly referred to as the time-of-flight (ToF) measurement principle. To obtain 3D coordinates of an object in a georeferenced coordinate system (e.g., WGS84), the position and attitude of the platform and the scan angle need to be measured continuously in addition to the ranges. Thus, airborne lidar is a time-synchronized multi-sensor system, and the 3D points are calculated via direct georeferencing. For obtaining a positional accuracy of the flight path (trajectory) in the centimeter range, it is indispensable to use a GNSS base station located in the survey area. This could be either a permanent or virtual station of a GNSS service provider or a GNSS receiver installed on a tripod at a reference point with known coordinates.
The ideal laser ray is infinitely small, but in practice the actual laser beams can be thought of as light cones with a narrow opening angle. The typical diameter of the illuminated spot on the ground (footprint) is in the cm- to dm-range depending on the flying altitude and the sensor’s beam divergence. Representative specifications of state-of-the-art airborne lidar sensors are summarized in Table 1.

Table 1: Specifications of modern airborne lidar sensors.
Due to the finite footprint, multiple objects along the laser line-of-sight are illuminated by a single pulse and ToF sensors can return multiple points for a single laser pulse. In addition, airborne lidar sensors typically deliver additional attributes for each detected laser point, such as signal strength (intensity) or reflectance (calibrated radiometry). An example is depicted in Figure 2, highlighting both the penetration capability of airborne lidar and its ability to capture radiometric information. The scene shown has complete ground point coverage with 1st echoes (black) in the open areas and 2nd and 3rd echoes (red, green respectively) in the overgrown parts (Figure 2a). Figure 2b shows the radiometric content where, for example, the road boundary lines stand out in white (i.e. with high reflectance).
Laser ranging
The core component of each laser scanning system is the ranging unit. The distance from the sensor to an object is generally estimated by measuring the round trip time of a short laser pulse (ToF). Given the speed of light c, the pulse emission time t0, and the arrival time of the return pulse t1, the sensor-to-target distance R can be calculated as:

The phase-shift method, which constitutes an alternative to the ToF approach, is specifically used in terrestrial laser scanning. In this case, a continuous laser signal is imprinted on to a carrier wave and the offset between the phases of the emitted and returned (modulated) signals is measured. The main advantage of the ToF principle is its inherent multi-target capability, i.e., multiple returns along the laser line of sight can be extracted from a single laser pulse (cf. Figure 2a). This is particularly useful for surveys in vegetated areas. The phase-shift technique, in contrast, only delivers a single return per pulse.
Scanning
In airborne lidar, sampling of the Earth’s surface is carried out based on flight strips (cf. Figure 1). Areal coverage with 3D points requires (i) the forward motion of the aircraft and (ii) a beam deflection unit systematically steering the laser rays below or around the sensor. Figure 3 shows typical beam deflection mechanisms and their resulting point patterns on the ground.
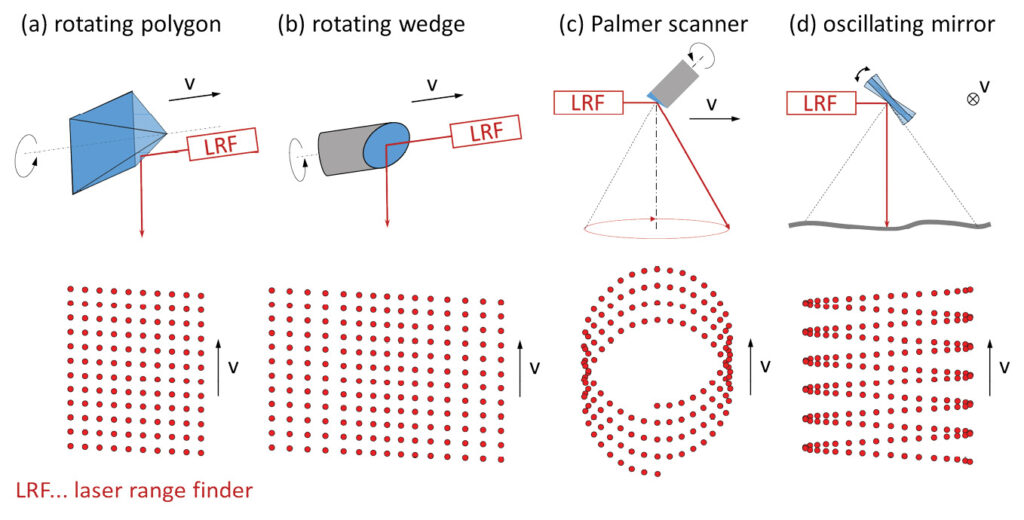
Figure 3: Laser beam deflection with rotating and oscillating mirrors.
Rotating, multi-faced polygonal wheels create parallel scan lines on the ground approximately perpendicular to the flight path. By adjusting the rotation speed, flying velocity, and pulse repetition rate, a homogenous point distribution on the ground can be achieved within a ±30° FoV around the nadir. A scan wedge with a single mirror tilted by 45° allows for scanning the full vertical plane (360° panoramas). Palmer scanners use a tilted rotational axis of the mirror and produce a spiral scan pattern on the ground. Such a conical scanning yields a constant incidence angle of the laser beam with respect to a horizontal ground plane, which is specifically useful for laser bathymetry to keep the angle between laser beam and water surface constant. Palmer scanners are also used in topographic laser scanning to enable views under bridges and to capture terrain and buildings from different angles. The point density is less homogeneous, however, as significantly higher densities are achieved at the strip boundary than in the center of the strip. A further disadvantage is the lack of nadir views. Finally, oscillating mirrors swing repeatedly between two positions. This scanning mechanism also leads to a higher point density at the edge of the strip due to the necessary deceleration and re-acceleration of the mirror in the opposite direction.
Signal detection
In conventional ToF laser ranging, the return signal of a highly collimated laser pulse is received by a single detector. For the conversion of the optical power into digital radiometric information, a two-stage procedure is employed. First, an avalanche photo diode (APD) converts the received laser radiation into an analog signal, and subsequently an analog-to-digital converter (ADC) generates the final measurement in digital form. APDs used for airborne laser scanning operate in linear-mode, i.e. within the dynamic range of the APD the optical power and the analog output are linearly related. Such APDs deliver measures of the received signal strength and provide object reflectance and/or material properties of the illuminated objects via radiometric calibration.
The actual range detection is implemented either by hardware components of the laser scanner (discrete echo systems) or by high-frequency discretization of the entire backscattered echo waveform (full waveform). In the latter case, the captured waveforms are either processed online by the firmware of the sensor or stored for detailed analysis in post-processing. Storing the full waveforms enables the application of sophisticated signal post-processing, e.g., Gaussian decomposition offers advantages with respect to ranging precision, target separability, and object characterization (amplitude, echo width, reflectance, etc.). Nevertheless, at least several hundred photons are required for a reliable detection of a single object.
A different approach is Geiger-mode lidar (Gmlidar), where a divergent laser pulse is emitted, resulting in a large laser footprint on the ground. The return signal is captured by a Geiger-mode avalanche photo diode (GmAPD) array, i.e., a matrix of single-photon-sensitive receiver elements. The APD of each single matrix element is operated in Geiger-mode, whereby an additional bias above the break-through voltage brings the detector into a state where the arrival of a single or a few photons is sufficient to trigger the avalanche effect, leading to an abrupt rise of voltage at the receiver’s output. The break-through event of the photodiode triggers the stop impulse for the range estimation via a time-to-digital convert (TDC). After a break-through event, the respective cell is inactive for a period, so only a single echo can be measured per APD cell from the same laser pulse.
In contrast, the technology referred to as single-photon lidar (SPL) utilizes a short laser pulse, which is split into a grid of 10×10 sub-beams (beamlets) by a diffractive optical element (DOE). The 100 beamlets are highly collimated, thus their footprints on the ground do not overlap. For each beamlet, the backscattered signal is received by an individual detector, which is aligned to the laser beam direction. Each detector, in turn, consists of a matrix of several hundred single-photon-sensitive cells, each operating in Geiger-mode. Possible implementations of this technique include micro channel plate photomultiplier tubes or silicon photomultipliers. Within a restricted dynamic range, each beamlet detector acts like an APD operated in linear-mode, which enables moderate multi-target capabilities. For both SPL and Gmlidar, the receiver’s single photon sensitivity enables higher flying altitudes and consequently a potentially higher area performance. This is especially relevant for nationwide topographic mapping. A schematic diagram illustrating the three different options (linear-mode lidar, Gmlidar, SPL) is sketched in Figure 4.
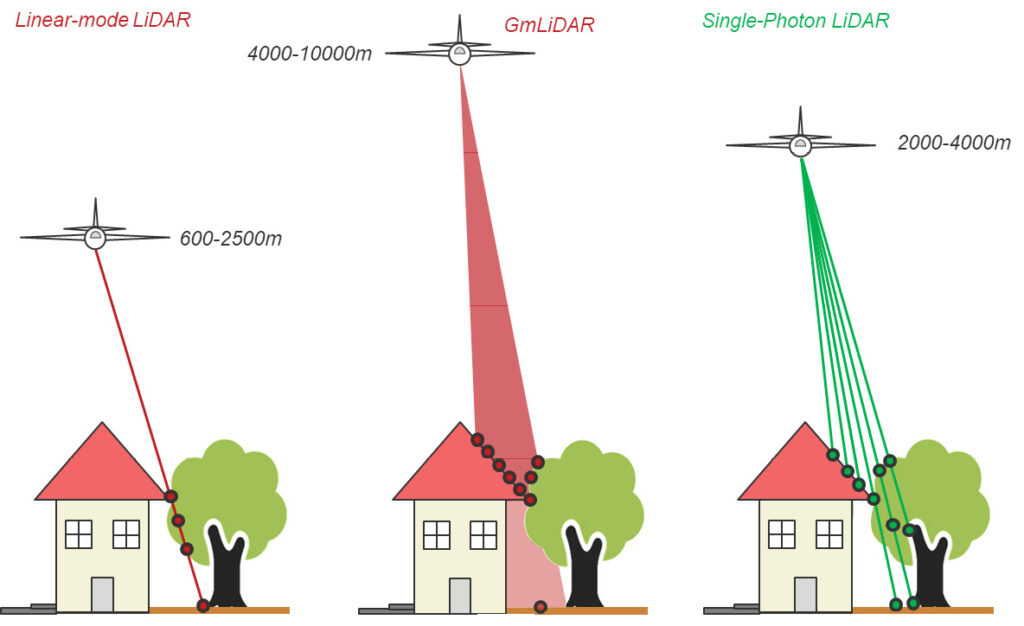
Figure 4: Schematic diagram of the three lidar modes.
Geometric sensor model
As stated above, airborne lidar is a kinematic measurement process based on a tightly synchronized multi-sensor system consisting of a GNSS receiver, an INS, and the laser scanner itself. The computation of georeferenced 3D points is called direct georeferencing and is illustrated in Figure 5.
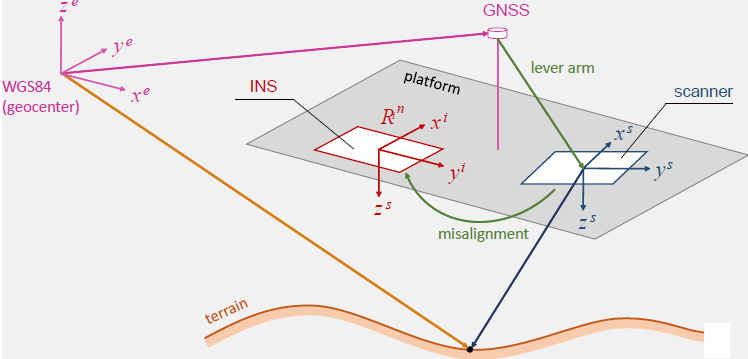
Figure 5: Schematic diagram of the geometric airborne lidar sensor model.
The standard airborne lidar data processing pipeline starts with calculating the platform’s trajectory using Kalman filtering of the GNSS and INS observations. This results in a so-called smoothed best estimate of trajectory (SBET), constituting the absolute 3D positions (X, Y, Z) of the measurement platform in a geocentric, Cartesian (Earth-centered, Earth-fixed: ECEF) coordinate frame as well as the attitude of the measurement platform with respect to the local horizon (navigation angles: roll, pitch, yaw). In the next step, the trajectory data are combined with the time-stamped laser scanner measurements. Here, the manufacturers typically compensate small systematic instrument effects of the ranging and scanning unit based on laboratory calibration and directly provide corrected 3D coordinates of the detected objects (i.e. laser echoes) in the sensor coordinate system. These constitute the basis for the calculation of 3D object coordinates in an ECEF coordinate system according to Equation 2:
![]()
The transformation chain in Equation 2 transforms between the following coordinate systems (CS), each denoted by a specific index and highlighted by a specific color in Figure 5.
- s/blue: scanner CS
- i/red: INS CS
- n/no color: navigation or platform CS (i.e. local horizon CS: north/east/down)
- e/magenta: ECEF (Earth-centered, Earth-fixed) CS
Reading Equation 2 from right to left, xs (xs, ys, zs), the 3D point in the local scanner CS, is rotated by the boresight angles into the INS system (Ris) and shifted by the lever arm (ai). The lever arm is the offset vector between the phase center of the GNSS antenna and the origin of scanner system, and the boresight angles denote the small angular differences (Δroll, Δpitch, Δyaw) between the reference planes of the scanner and the INS, respectively (cf. green elements in Figure 5). Rni transforms the resulting vector from the INS CS to the navigation CS (local horizon CS) based on the roll, pitch, and yaw angles measured by the INS, and Ren rotates to the Cartesian ECEF system. The latter rotation depends on the geographical position (latitude/longitude) of the INS origin. The 3D coordinates of the laser point xe(t) are finally obtained by adding the ECEF coordinates of the GNSS antenna (ge).
The total positional and vertical uncertainty (TPU/TVU) of the 3D laser points depend on the accuracy of both the laser scanner and the trajectory, as well as on the synchronization of all sensor components (GNSS, INS, scanner). Modern laser scanners provide a ranging accuracy of 1-3 cm. Integrating the GNSS observation of both the base station and the lidar sensor system in post-processing yields an accuracy of 3-5 cm. Typical accuracies for INS employed for airborne lidar are 0.0025° for roll/pitch and 0.005° for the heading (yaw) angle. Overall, state-of-the-art airborne lidar sensors deliver sub-dm 3D coordinate accuracy.
Radiometric sensor model
Information about the radiometric properties of illuminated objects is of high importance, e.g., for semantic point cloud labelling and for many follow-up applications. The laser-radar equation describes the fundamental relationship between the transmitted and the received optical power:

The received power PR depends on the transmitted power PT, the measurement range R, the laser beam divergence γ, the size of the receiver aperture D , the backscattering cross-section σ, as well as factors related to system losses ηSYS and ηATM. PBK, finally, indicates solar background radiation that deteriorates the signal-to-noise ratio.
The backscattering cross-section σ incorporates all target properties and can be separated into the illuminated target area (A), the object’s reflectance (ρ) , and the backscattering solid angle (Ω).

Small values of Ω relate to specular reflection (e.g., on water or glass surfaces). In turn, most of the natural targets (soil, grass, trees, etc.) as well as sealed surfaces (asphalt, concrete) are diffuse scatterers. For ideal diffusely reflecting targets (Ω = 180o), Lambert’s cosine law is applicable. The cross-section further depends on the illuminated area A, which is a function of the measurement range R, the beam opening angle γ, and the incidence angle between the laser beam and the normal direction of the illuminated surface. While the most generic formulation of the laser-radar equation reveals a decay of the received power with R4, the signal loss for targets that are fully covered by a single laser footprint is limited to R2 as written in Equation 3. Typical examples of such extended targets include points on open terrain, roads or building roofs.
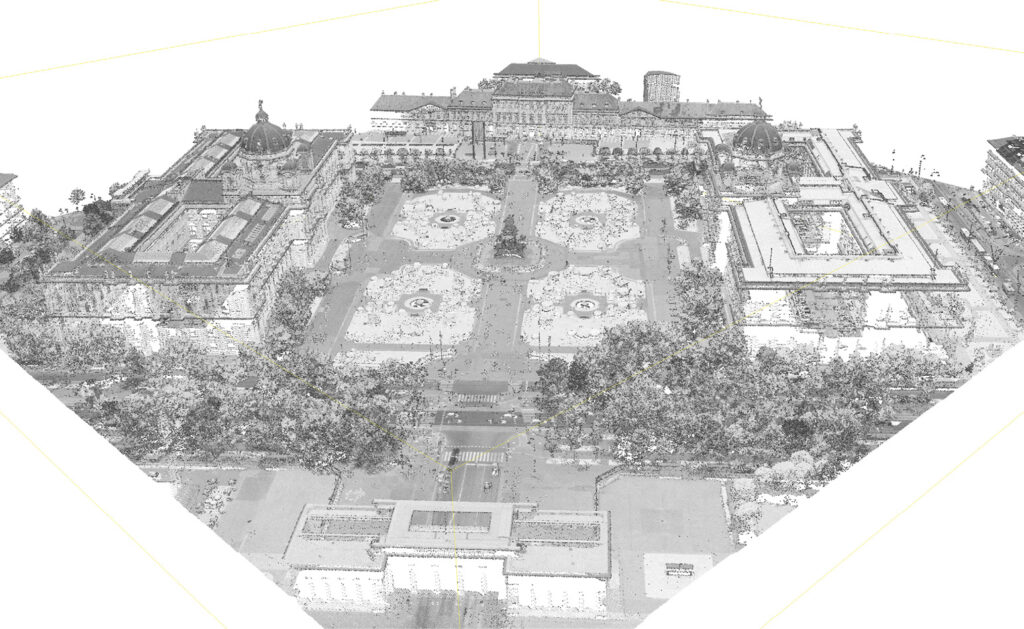
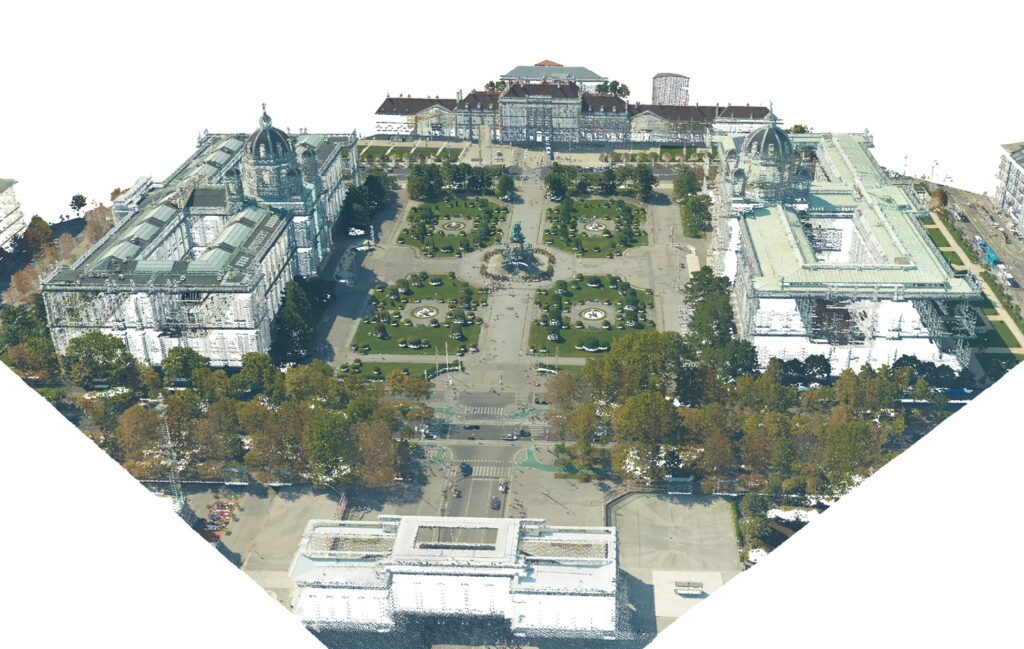
Figure 6: 3D airborne lidar point cloud of downtown Vienna: colored by reflectance (top); colored by true-color RGB (botttom).
In summary, the received total power (intensity) measured by airborne lidar sensors strongly depends on the measurement range and other factors. To make the radiometric content comparable among different flight strips and, beyond that, among different flight missions, homogenization of the measured raw intensities is inevitable. Simple correction strategies account for the dominating range effect to correct the received signal strength measurements, and more rigorous approaches apply radiometric calibration based on external radiometric reference measurements to obtain object properties such as backscattering cross-section or object reflectance. Figure 6 shows an example from an airborne lidar campaign in Vienna. The scene depicts the square of empress Maria-Theresia (Maria-Theresien-Platz) between the Museums of Fine Arts and Natural History. The 3D point cloud is greyscale-colored by calibrated reflectance and by true-color RGB. The latter requires the integration of a laser scanner and a camera. Such integrated sensor systems are the main topic of Part II of this tutorial, which will appear in the next issue of LIDAR Magazine.
Further reading
Mallet, C. and F. Bretar, 2009. Full-waveform topographic lidar: State-of-the-art, ISPRS Journal of Photogrammetry and Remote Sensing, 64(1): 1–16.
Shan, J. and C.K. Toth, 2018. Topographic Laser Ranging and Scanning: Principles and Processing, Second Edition, Taylor & Francis, Boca Raton, Florida, 637 pp.
Vosselman, G. and Maas, H.-G. (eds.), 2010. Airborne and Terrestrial Laser Scanning, Whittles Publishing, Dunbeath, Caithness, Scotland, 336 pp.
Wagner, W., 2010. Radiometric calibration of small-footprint full-waveform airborne laser scanner measurements: Basic physical concepts, ISPRS Journal of Photogrammetry and Remote Sensing, 65(6): 505–513.