Coastal Zone Mapping and Imaging Lidar (CZMIL) SuperNova nearshore topobathymetric lidar along the Gulf Coast of Florida.
Florida boasts the longest coastline of any state in the contiguous U.S., with over 8400 linear miles (NOAA method)1. Florida also has the largest submerged shallow shelf on the Gulf of Mexico/Atlantic Ocean and the only coral reef system (Figure 1) in the contiguous U.S. (Florida Department of Environmental Protection’s Office of Resilience and Coastal Protection).
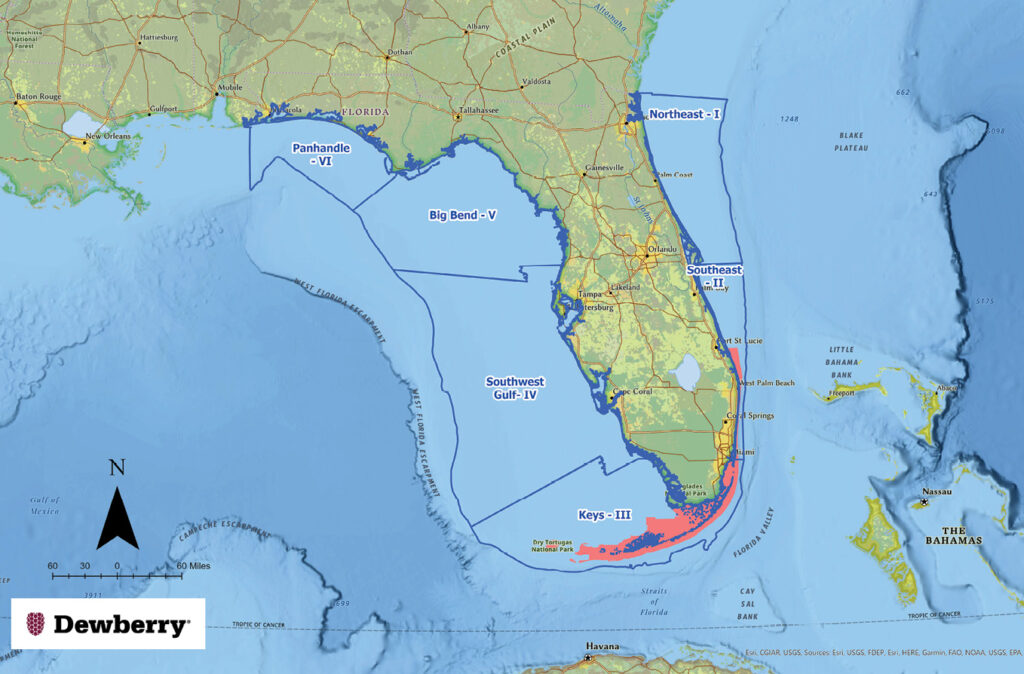
Figure 1: The six regions identified by FCMaP and subsequently adopted by FSMI. Coral reef area shown in pink.
As about two-thirds of Florida forms a peninsula between the Gulf of Mexico and the Atlantic Ocean, the state is especially prone to tropical storms and cyclones/hurricanes. Since 1851, 121 named and unnamed hurricanes have hit Florida, more than any other state2, and since 2017, four storms have made landfall along the Gulf Coast, including hurricanes Irma (2017), Michael (2018), Ian (2022), and Idalia (2023). Hurricane Ian was the third most costly hurricane to hit the U.S., on record with a price tag of more than $113 billion. Losses resulting from Hurricane Idalia, still being tallied, are also considerable. With increasing ocean temperatures fueling tropical storms, we can expect hurricane intensity and frequency to increase into the future.
In response to the compounding effects of sea-level rise, coastal subsidence, and growing population pressure on the coastline, Florida has been placing increased importance on coastal resilience and sustainability. In 2019, the Florida Department of Environmental Protection (FDEP) created the Office of Resilience and Coastal Protection (ORCP)3 to guide its efforts. FDEP/ORCP has a multi-faceted approach to resilience, including coral reef protection, preservation of coastal and aquatic management areas, beach and inlet management, and the implementation of ecosystem restoration projects to prepare Florida’s coastal communities and state-managed lands for the effects of sea level rise, coastal flooding, erosion, and storms.
In 2022, the Florida Legislature allocated $100 million in general revenue funds to FDEP/ORCP for the Florida Seafloor Mapping Initiative (FSMI), to capture statewide topobathymetric lidar to the 20-meter isobath and acoustic/sonar soundings from the 20-meter isobath to the 200-meter isobath. FDEP/ORCP and the Florida Geographic Information Office (FGIO) constructed timelines and published anticipated schedules on respective program webpages. FGIO produced a dashboard4 to share the collection regions, progress updates, and data processing status.
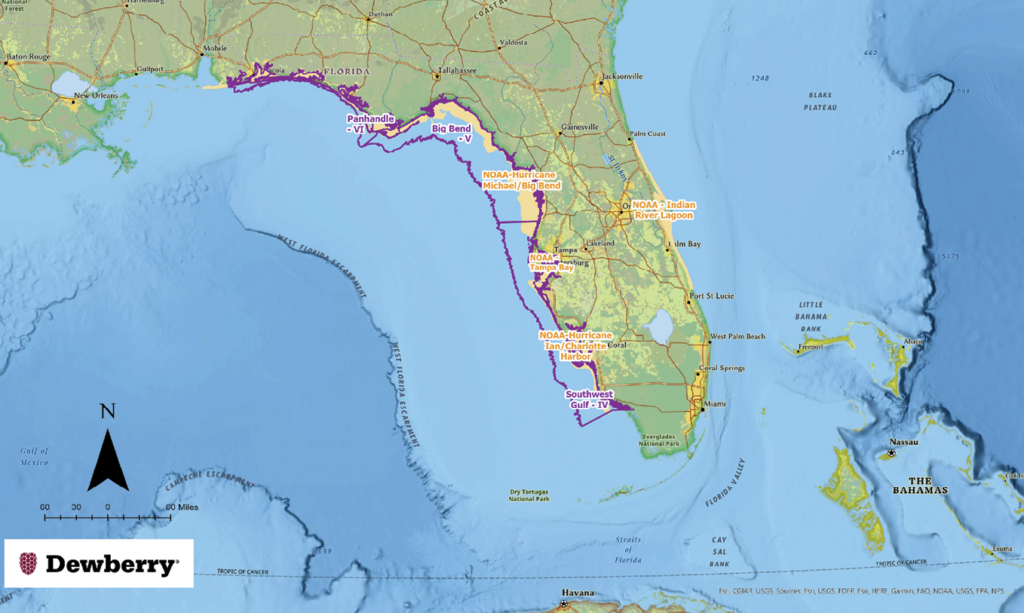
Figure 2: Dewberry/NOAA topobathymetric and shoreline mapping projects in Florida along the Gulf Coast: the panhandle of Florida through the Anclote River (Hurricane Michael/Big Bend); Tampa Bay; the Manatee River outlet through Naples (Hurricane Ian/Charlotte Harbor); and, along the Atlantic Coast, the Indian River Lagoon. Areas in purple are FSMI regions assigned to Dewberry for CZMIL SuperNova mapping.
For many of the reasons indicated above, the Office of Coastal Management (OCM) of the National Oceanic and Atmospheric Administration’s (NOAA) has been updating navigation charts and coastal surveys along Florida’s coastline. Since 2018, Dewberry has been updating large segments of the coastline and mapping the bathymetry using topobathymetric lidar (Figure 2). Some of these efforts preceded FSMI; while some areas of interest coincide with FSMI, and some are being collected simultaneously with and complement the FSMI project. This article discusses the first phase of FSMI, specifically updates to the bathymetry and shoreline mapping along the Gulf Coast of Florida.
The FSMI project area
In 2017, the Florida Coastal Mapping Program (FCMaP)5 designated six regions of Florida as the basis for studying the quality of available bathymetric data. FDEP/ORCP adopted those six regions (Figure 1) as the basis for awarding contracts to topobathymetric lidar and multi-beam sonar providers. Each region was identified with a name and a region number, starting in northeastern Florida and proceeding clockwise through the Florida panhandle:
- Northeast-Region I
- Southeast-Region II
- Keys-Region III
- Southwest Gulf-Region IV
- Big Bend-Region V
- Panhandle-Region VI
The project is separated into two phases. Phase one focuses on using topobathymetric lidar to collect bathymetry to the 20-meter isobath. This topobathymetric lidar phase spans approximately 58,000 km2 as illustrated in Figure 2. Phase two will focus on collecting acoustic, multi-beam sonar data for water depths between 20 meters and 200 meters.
Dewberry’s role
Dewberry was awarded approximately 25,000 km2 of the project for topobathymetric lidar mapping, including the entire Gulf Coast of Florida, from Pensacola in the western panhandle south through Naples (Figure 3). This includes Southwest Gulf–Region IV, Big Bend–Region V, and Panhandle–Region VI. Dewberry is deploying three CZMIL SuperNova topobathymetric lidar sensors for data collection, which were chosen based on their ability to measure up to 3.5 secchi disk depth through the water and to the 20-meter isobath. The sensors are mounted in Cessna Caravan airframes operating from bases throughout the project area (Figure 4).
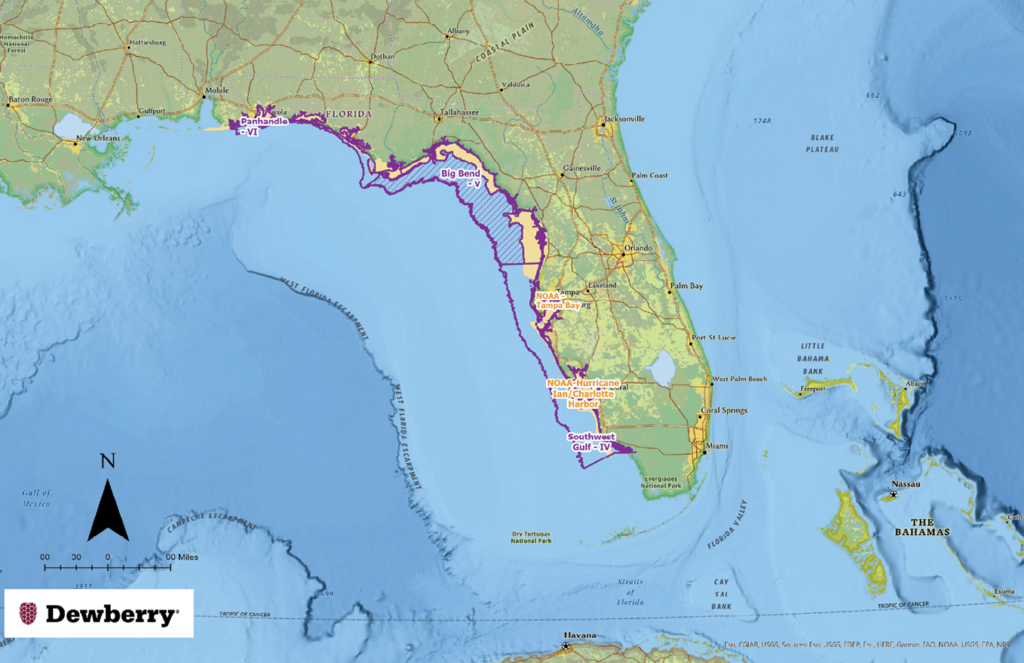
Figure 3: FSMI regions for topobathymetric lidar mapping; water depths to the 20-meter isobath in purple. Dewberry was tasked by NOAA to collect near-shore lidar bathymetry in the Big Bend-Region V area (see tan areas in Figure 2) for the NOAA/Hurricane Michael Relief Program. The FSMI area of interest was refined to include only the hatched area.
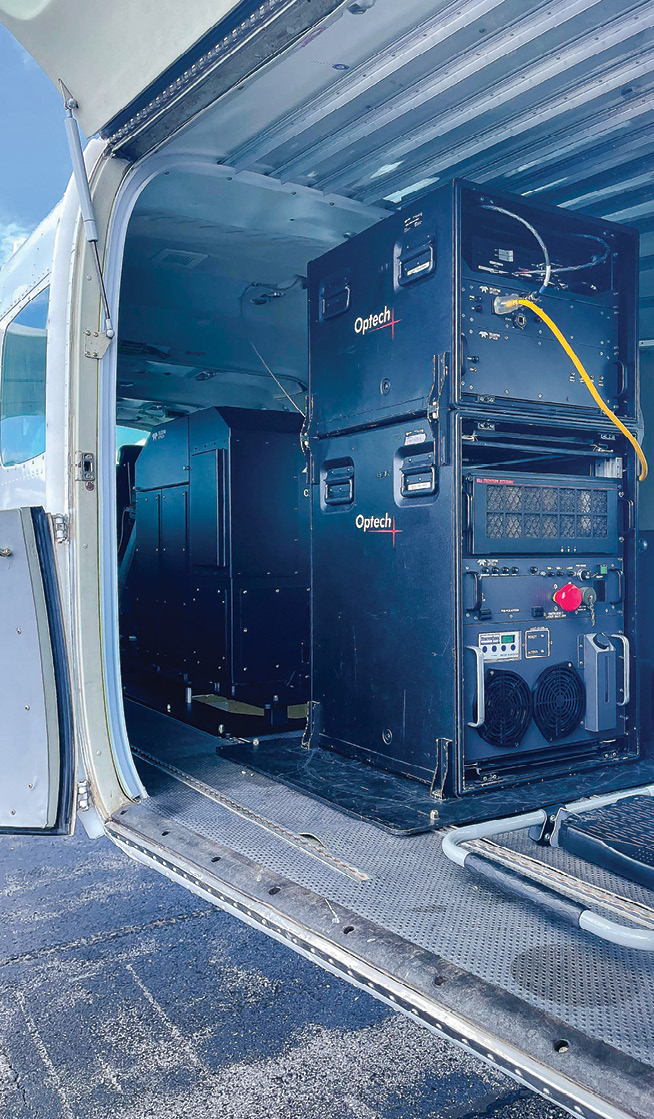
Figure 4: Dewberry’s CZMIL SuperNova sensor mounted in a Cessna Caravan. This sensor is housed at the Peter O. Knight Airport in Tampa, Florida.
Current progress
Dewberry started collecting lidar bathymetry in Big Bend–Region V in July 2023 and continued through the end of August 2023, when Hurricane Idalia made landfall in the Big Bend region near Steinhatchee. By late August, Dewberry had collected approximately 31% (~3500 km2) of the area of interest in Big Bend-Region V (Figure 5), and almost 20% (~600 km2) in Panhandle-Region VI (Figure 6).
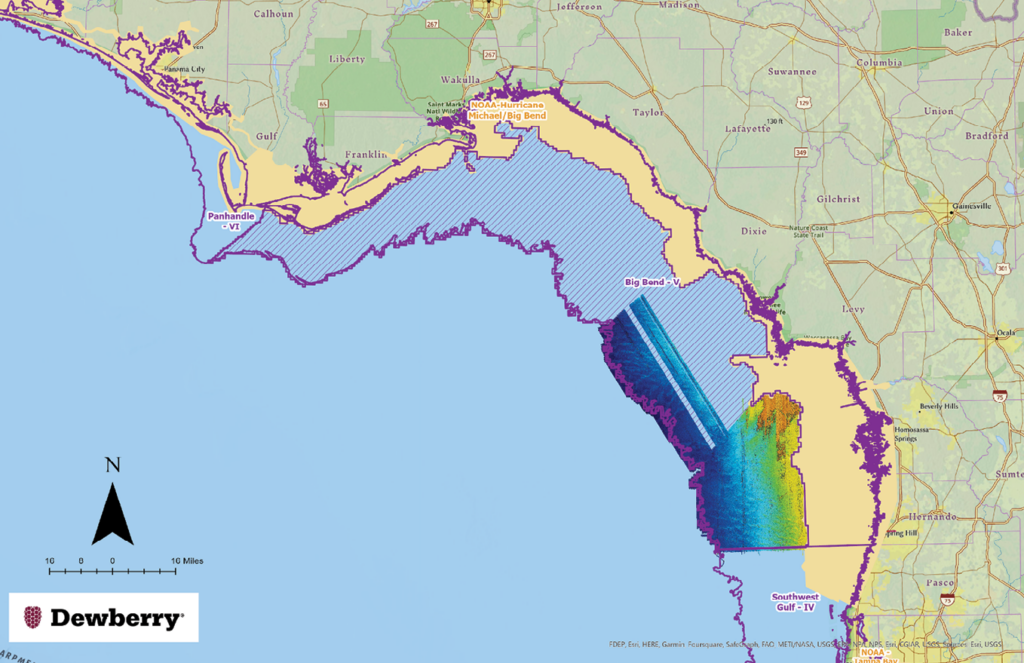
Figure 5: Quicklook showing CZMIL SuperNova topobathymetric lidar coverage collected prior to Hurricane Idalia, August 2023, in the Big Bend-Region V of the FSMI. Data coverage extends to the 20-meter isobath on the west, and approximately 30% of the Region V area. The tan area was collected for the NOAA/Hurricane Michael Relief Program.
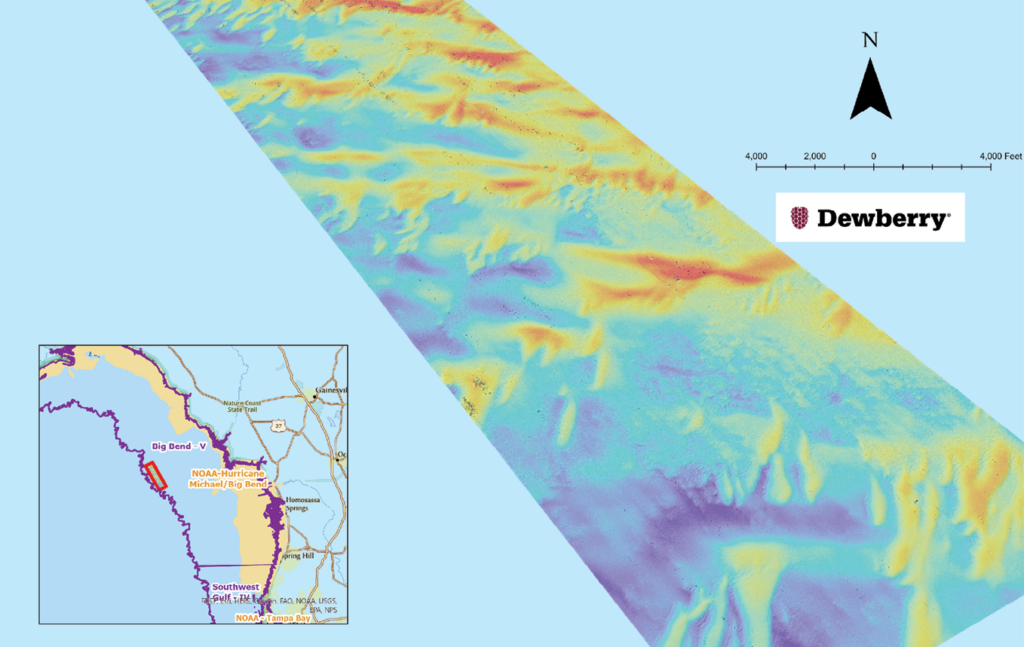
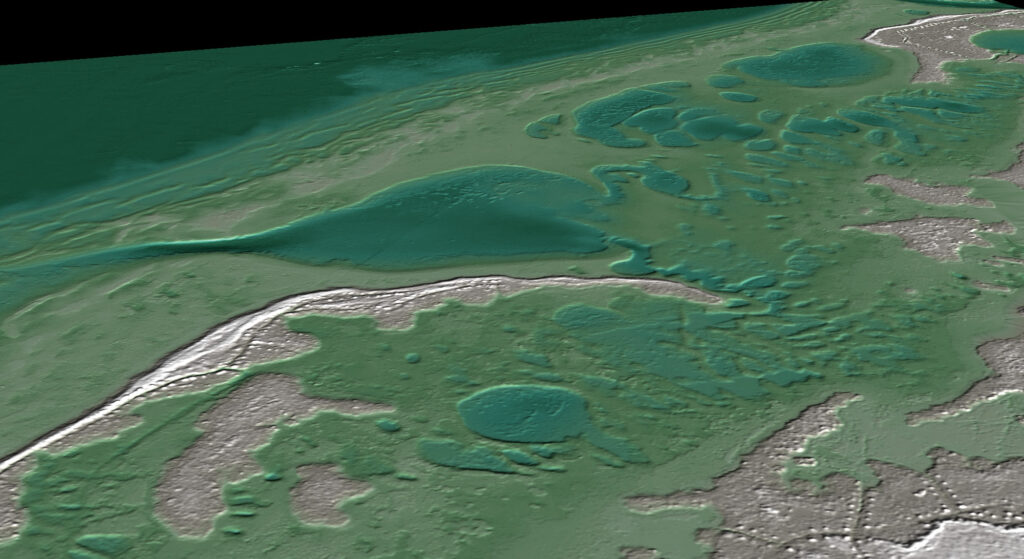
Figure 6: Detailed digital elevation model derived from CZMIL SuperNova returns near the 20-meter isobath in the Big Bend-Region V.
Preliminary results
Dewberry is currently processing and calibrating the initial CZMIL SuperNova data from August 2023 using the Teledyne CARIS software. Dewberry has also developed a custom process to create “Quicklook” products that allows visualization of the topobathymetric lidar without expending considerable processing time and expense. Figure 5 shows the extent of the CZMIL SuperNova data collected prior to Hurricane Idalia for the southern portion of Big Bend-Region V. The preliminary results of the topobathymetric data reveal features and bathymetry extending out to the 20-meter isobath and completely within the near-shore area of interest (Figures 5 and 7).
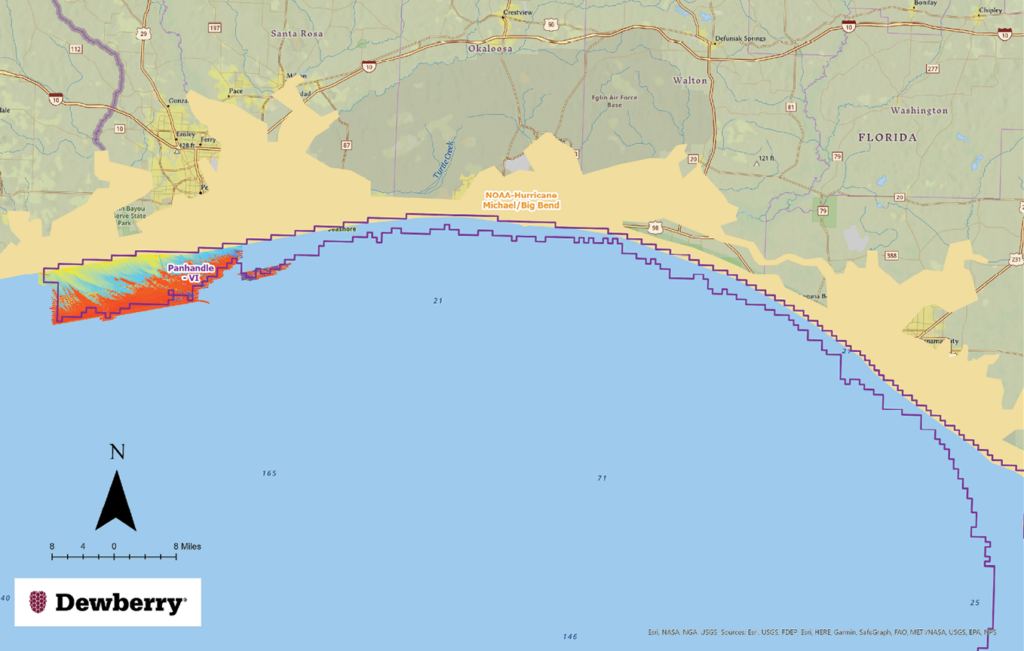
Figure 7: Quicklook showing CZMIL SuperNova topobathymetric lidar coverage collected prior to Hurricane Idalia, August 2023, in the Panhandle-Region VI. Data coverage extends to the 20-meter isobath on the south, and approximately 18% of the Region VI area. The tan area was collected for the NOAA/Hurricane Michael Relief Program.
Further investigation of the Quicklook data in the Big Bend area revealed that the CZMIL SuperNova sensor was recording highly detailed bathymetric returns near the 20-meter isobath (Figure 6), which led the FDEP/ORCP to modify the task orders to include lidar bathymetry past the 20- meter isobath.
Innovative planning methodology
Planning aerial acquisition missions, and particularly topobathymetric missions in Florida, presents unique challenges. With the flat inland and coastal topography, even low-yield, inland rain events can result in large amounts of particulate runoff into the Gulf of Mexico. Combining the runoff with tannic components, such as those in the Suwannee River system in Big Bend, can result in poor water quality and unfavorable conditions for lidar bathymetry.
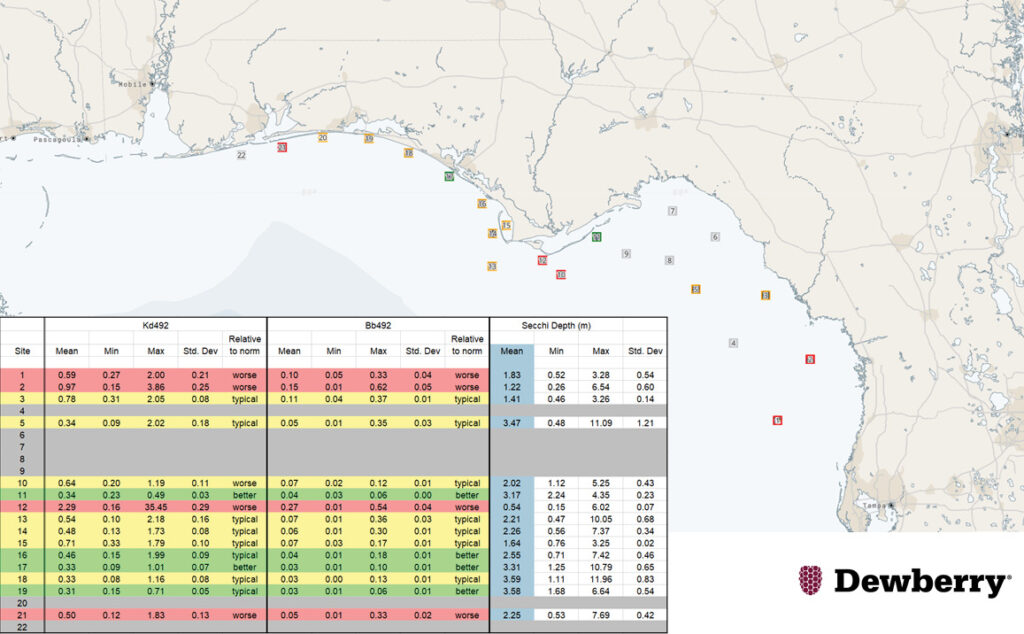
Figure 8: A daily water condition report for 16 October 2023 for 22 locations distributed in the Big Bend and Panhandle Regions, showing three (Kd492, Bb592, and Secchi Depth) metrics. Gray sample locations were clouded over on the date indicated and no data was generated; pink were below normal expected values; yellow, within normal expected values; green, better than normal expected values.
To help avoid collecting lidar during sub-optimum water clarity conditions, Dewberry has partnered with TCarta to provide satellite-derived bathymetry (SDB) for 22 selected sites dispersed throughout the regions. TCarta delivers the water clarity estimates daily based on several metrics, including the diffusion coefficient (Kd492), the backscatter coefficient (Bb492), and secchi disk depth (Figure 8) to help evaluate the water clarity and interpret current water conditions relative to historic norms. This methodology has helped Dewberry minimize non-productive flights, therefore increasing efficiency and decreasing environmental carbon dioxide loading.
Reference
Florida Department of Environmental Protection, 2023. Florida’s Coral Reefs, https://floridadep.gov/rcp/rcp/content/floridas-coral-reefs (accessed 20 October 2023).
1 coast.noaa.gov/czm/mystate/
2 cnn.com/2017/09/11/us/hurricanes-landfall-by-state-trnd/index.html
3 floridadep.gov/orcp
4 floridagio.gov/pages/FSMI
5 fcmap-myfwc.hub.arcgis.com
6 Maune, D.F. and A. Nayegandhi (eds.), 2018. Digital Elevation Model Technologies and Applications: The DEM Users Manual, 3rd Edition, ASPRS, Bethesda, Maryland, 652 pp.