When a serious car accident results in significant damages to one or more parties, an insurance or legal case is opened to determine who was “negligent” and therefore responsible for restitution. Cornell Law School defines negligence as “a failure to behave with the level of care that someone of ordinary prudence would have exercised under the same circumstances.”1 Demonstrating that someone could and did or didn’t act within a reasonable standard of care for someone else in a complex accident, however, can be a major task, as this requires uncovering the truth of the incident and the person’s perception/perspective during the incident.
Forensic experts have employed a myriad of tools to analyze and communicate a driver’s perspective throughout these chaotic situations. Some of these tools include 2D diagrams or video reconstructions. Each of these formats, however, face unique demonstrative challenges: diagrams can’t provide first-person perspectives and video reconstructions can’t truly capture the details of a traumatic accident where it happened.
With the advancement of 3D reconstruction through lidar technology, however, forensic specialists are employing modern visual technology to demonstrate their accident analyses. Particularly useful tools include 3D animation and virtual reality productions (Figure 1). Lidar’s infusion with forensic recreation now allows experts to accurately blend a driver’s perspective, external obstructions and time-space relationships with efficiency and persuasiveness.
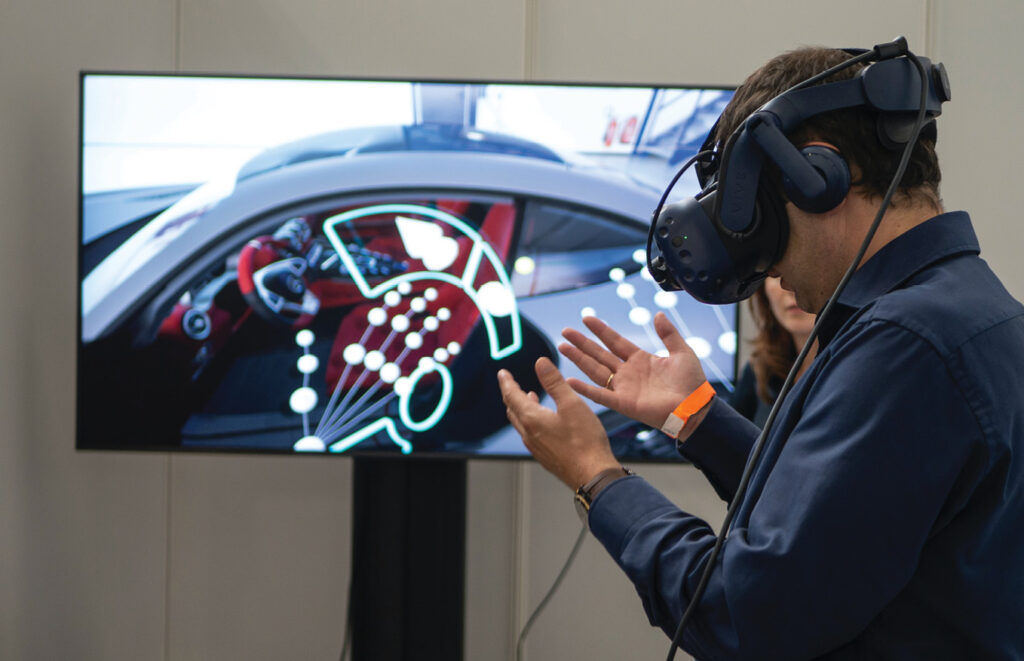
Figure 1: Virtual reality exhibits are becoming increasingly popular tools to demonstrate perspective in an accident reconstruction.
Process
The process to capture the data necessary for a forensic line-of-sight and perspective reconstruction involves capturing environmental 3D data, the vehicle and driver’s 3D data and then reconstructing the incident in 3D software.
The primary task is understanding and scanning the environmental setting of the accident (Figure 2). Scan data provides experts with an accurate, measurable 3D point-cloud blueprint for a 3D reconstruction. It also sets the stage for the influence of specific conditions or factors that may have led to the accident’s outcome, which can be implemented in 3D production.
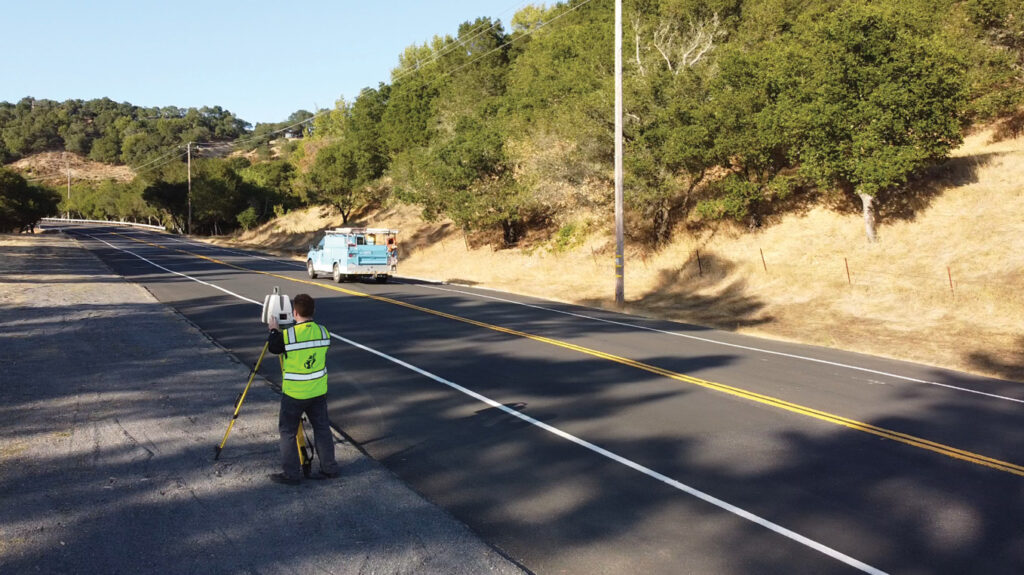
Figure 2: Lidar scanning of accident scenes accurately and efficiently captures millions of 3D measurement points for forensic-standard reconstructions.
At this stage, it’s important to understand the effect any obstruction may have played in the accident. Vehicles, foot traffic, or other factors may impede the driver’s line-of-sight of the road, so it is critical to capture enough data to logically demonstrate potential obstructions in the 3D reconstruction. Pertinent obstructions are often discovered in driver testimony, police reports or from accident reconstruction analyses.
It is also necessary to scan not only the impact area, but also the lead-up to the impact. Depending on the speed leading up to the accident, several hundred feet should be scanned to capture a contextual lead-up to an accident.
The next step, capturing vehicle and driver data, enables the reconstruction of a true driver’s eye-level perspective.
To develop an accurate 3D model of a car, scan the inside and outside of the true vehicle(s) involved (if they survived) or an exemplar model for a foundation of the vehicle’s structure. Scanning the inside of a vehicle is especially important when considering the influence of a car’s interior on a driver’s perspective, whether from the dashboard, hood, doors or A/B pillars. Numerous studies and cases have shown that pedestrians can fit within a vehicle’s A or B pillar’s visual shadow right up to the point of impact.
Then, to verify where the driver’s eye-level perspective would be, reference the perspective driver’s height. This number will be used in the next step of modelling and animating the accident.
Finally, with the forementioned data, a 3D artist can animate the environment, vehicle(s), and additional key factors to produce a realistic, evidence-based reconstruction of an accident. By working with evidence or other experts, speeds and additional factors can be fine-tuned to ensure accuracy. This stage is also the best time to model and animate any additional obstructions or unique factors that affected the incident but weren’t captured during the scan process.
Once the incident has been animated, placing a perspective camera in the driver’s seat will allow an audience to see this accident reconstruction through the eyes of the driver (Figure 3). To maintain forensic accuracy, reference the actual driver’s height, place a representative 3D model in the seat, then place the perspective camera at the eye-level height of this character.
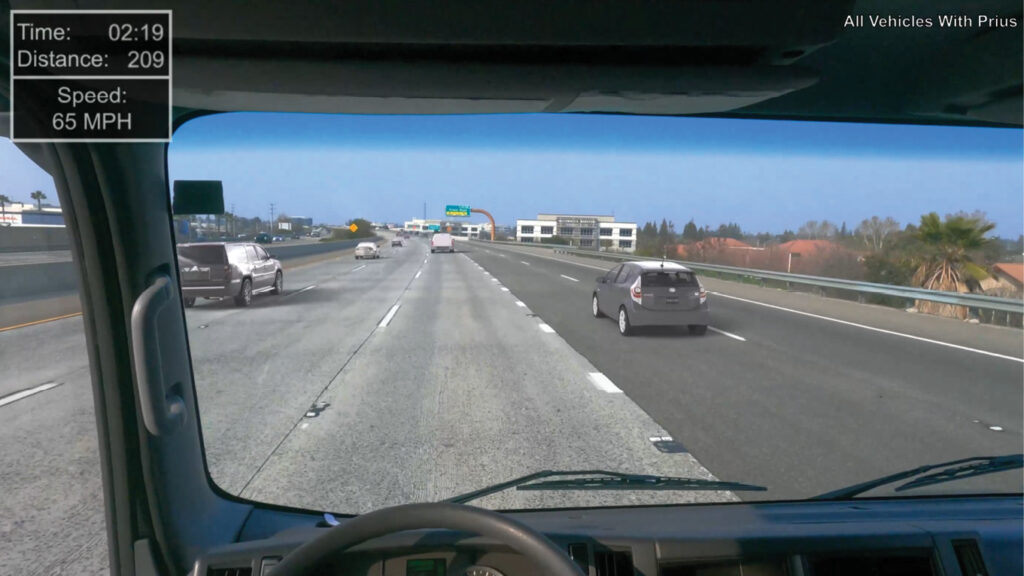
Figure 3: Driver’s perspective reconstructions put the audience in the driver’s eye.
Finally, rendering the production from this perspective and verifying with a case’s experts will yield a 3D accident reconstruction with a truly verified environment and driver perspective. At this stage, an expert can decide whether the 3D animated driver’s perspective stands best as a video animation or as an interactive virtual reality exhibit. With technical guidance, virtual reality exhibits can very effectively demonstrate 360-degree perspectives as well as a demonstration of the user’s decision-making in an accident reconstruction.
Once completed and rendered, a lidar-based accident perspective reconstruction can be used as several types of key analyses. Below are some very common visual accident analyses:
Line-of-sight analysis
Often, an object’s three-dimensional placement can prevent the driver from seeing an impending danger or warning in their path of travel. Some examples of internal obstructions can include A/B pillars, vehicle hoods, or blind spots. Common external obstructions can include other vehicles, foot traffic, roadblocks, and tree branches.
Lidar-based reconstruction is an excellent method for verifying whether an obstruction blocked a driver’s view. Knowing that the placement and size of each on-screen element and the driver’s eye-level perspective have been verified through lidar-scanning ensures that the animation accurately reflects true line-of-sight issues (Figure 4). This method is also the safest way to demonstrate these perspectives without physically recreating an accident.
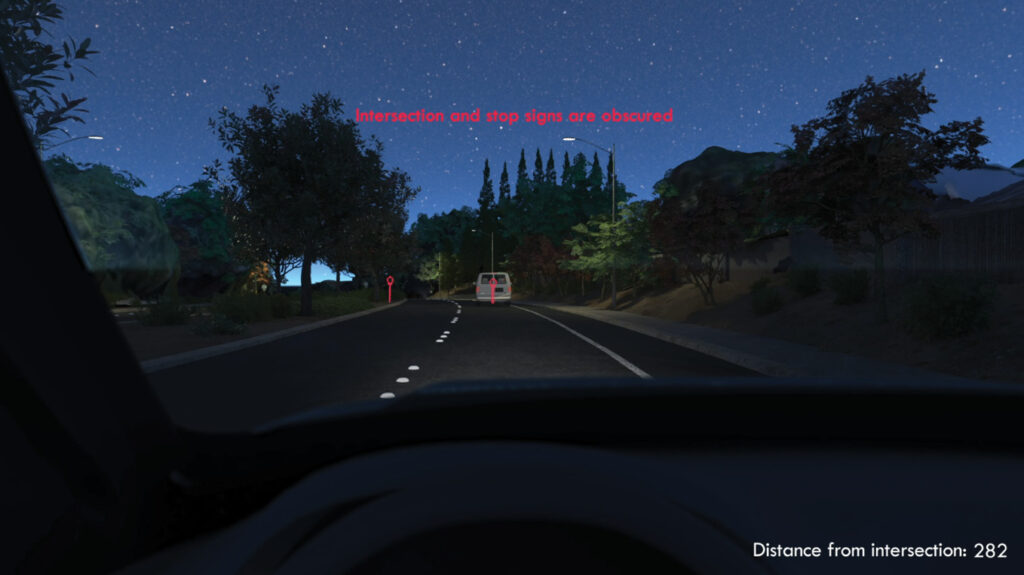
Figure 4: Animated line-of-sight demonstrative.
Perception-reaction analysis
The average healthy human’s perception-reaction time to potential stimuli is 1 to 1.5 seconds. Because the transmission of information from our brain (perception) to our muscles (reaction) takes this time, one’s reaction to an unexpected stimulus may not be in time to avoid disaster. Think of a baseball player swinging at a 100 mph fastball or a deer jumping into a car’s path in the woods; just because one sees a potential hazard does not always mean one can reasonably react in time.
This scientific theory is commonly applied to all kinds of forensic cases to audit a reaction to a stimulus. This analysis can be especially useful to analyze the timing and extent of a driver’s reaction or lack thereof that led to an accident. By recreating an accident with forensically based space-time demonstrations, a jury or judge can better understand why a driver made a specific decision in the heat of the moment.
“What if?” analysis
When one or two conditions become the primary culprit for an accident case, there is no better tool than 3D reconstruction to answer this case’s hypotheticals. For example, if one side wonders, “Could an accident have been avoided if a traffic sign was more visible,” it would be easy for a 3D artist to make the traffic sign much more prominent through relocation or by increasing its visibility (Figure 5). The same process can be applied to any number of conditions, including, “What if the obstructing tree branch had been removed?”, “What if the pedestrian had walked within the crosswalk?”, or “What if the driver’s headlights worked properly?”
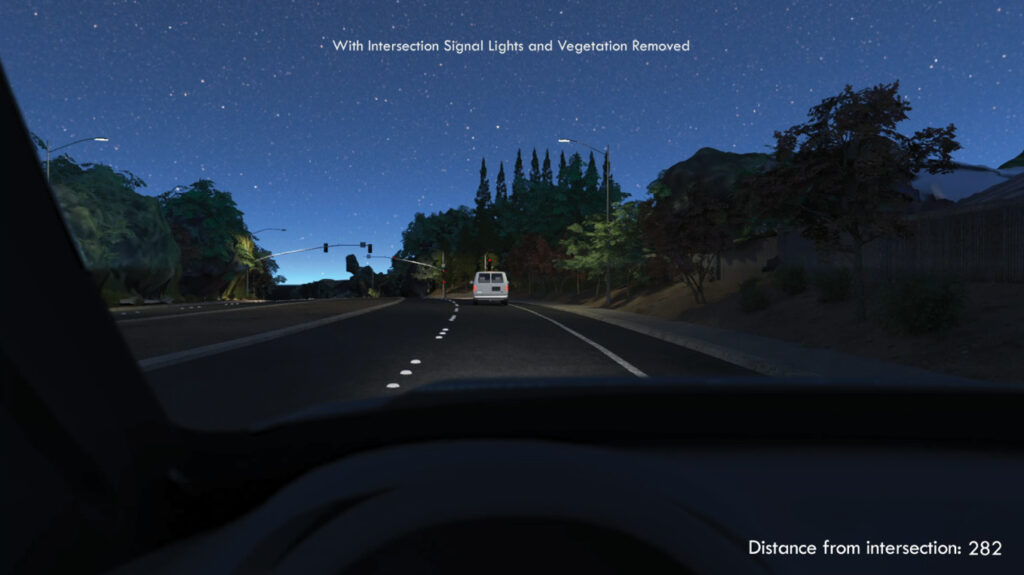
Figure 5: “What if?” analyses are effective demonstratives to showing an alternate context.
Ultimately, through “What If?” analysis, an audience can view the accident with said modifications then verify whether it would have prevented the drivers from avoiding the accident themselves.
Jason C. Fries is a 25+ year forensic scientist and the founder of 3D Forensic, Inc. He graduated from San Diego State University in 1996 with a BS in biology and focus areas in physics and chemistry. He has been a pioneer in developing modern standards in forensic laser scanning, forensic animation, nighttime visibility, and OIS reconstruction, molding the industry’s methods and growth since its inception. www.3D-forensic.com
1 law.cornell.edu/wex/negligence