FL-ASPRS/UF Spring 2022 Virtual Lidar Workshop
The temporal dynamics of creeks are important for understanding the hydrologic processes, predicting floods, and assessing climate-change impacts. At the watershed scale, the understanding of river form, process and function is largely based on locally intensive mapping of river reaches, or on spatially extensive but low-density data scattered throughout a watershed (e.g., cross-sections). In the 1960s, researchers began to use early forms of remote sensing (e.g., aerial photos) (Leopold and Langbein, 1966) to investigate morphology and the driving processes involved. The Landsat program in 1972 led to a rapid uptake in spaceborne remote sensing for detection of former river channels (Ghose et al., 1979), investigation of water quality and suspended sediment (Aranuvachapun and Walling, 1988), and mapping of flood hazards (Rango and Anderson, 1974). Although satellite images can provide data for large areas (e.g., 10×10 km2), most of them are of low spatial resolution. Therefore, from a satellite-based survey, water surface area can only be determined for rivers more than 100 m wide. It was considered that data with a resolution of 1 m were high-resolution (Mertes, 2002), which is no longer the case. Development of airborne laser scanning (ALS) facilitated high-resolution collection of topographic data over large areas. Subsurface techniques more traditionally reserved for oceanic studies began to be used on fluvial systems for research in the early 2000s, with the deployment of acoustic doppler current profiling (ADCP) (Muste et al., 2004) and multibeam echo sounding (MBES) (Fonstad et al., 2013). Further improvements in resolution, but with limited spatial extent, came through the use of terrestrial laser scanning (TLS) (Heritage and Milan, 2009) in the late 2000s.
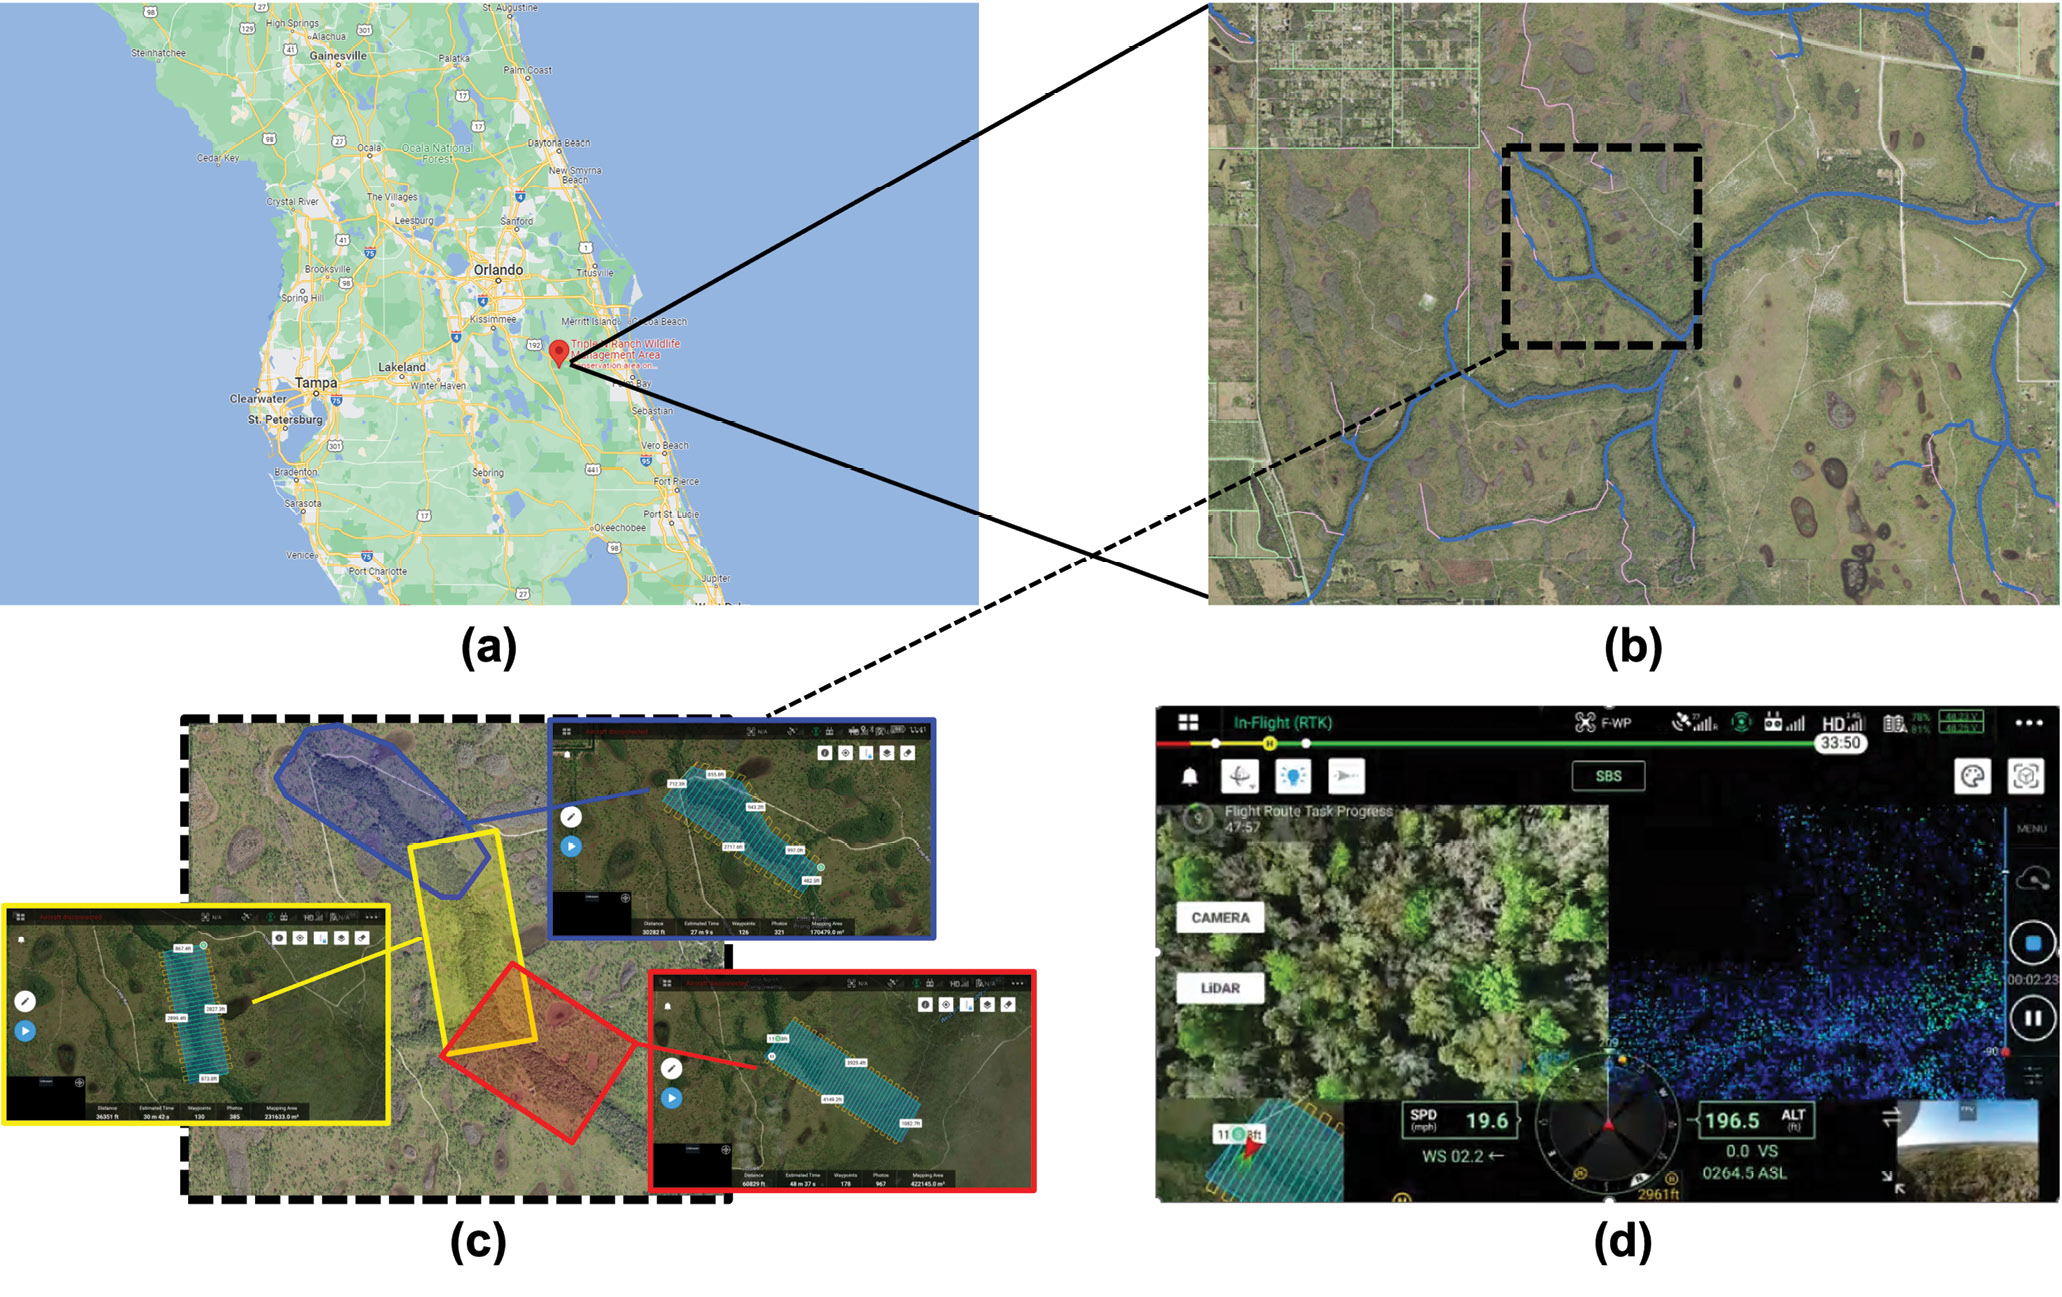
Figure 1: (a) Google map of the central Florida area and the location of the study area (Triple N Ranch Wildlife Management Area, St. Cloud, Florida); (b) enlarged map of case study area (black rectangle) marked with blue lines of perennial stream from USGS; (c) map of Little North Prong and plans of three UAV flight routes; (d) example of lidar data collection from UAV.
In the last few years, the use of unmanned aerial vehicles (UAVs) has allowed the collection of high-resolution imagery from which dense models of the earth’s surface are created (Fonstad et al., 2013). Many of the aforementioned methods have been used for a range of sensing applications in river science, as well as newly emerging bathymetric lidar sensing (Mandlburger et al., 2020). The remote sensing measurement for watershed mapping consists mainly of two categories based on the light sources: with passive illumination (e.g., optical photogrammetry, multispectral imaging) and with active illumination (e.g., lidar). The advances in optical remote sensing (with passive illumination) of rivers can generate accurate and continuous maps of features at sub-meter resolutions across entire watersheds as long as the aerial view is unobstructed. Obstacles to achieving the task include shadows, water clarity, illumination condition, and occlusion. In addition to the obstacles, the reflective and refractive nature of transparent water makes it hard to obtain the shared imagery features (between overlapping images) which are needed for 3D object reconstruction. Hence, although the photogrammetry-based methods (e.g., orthomosaic map, photogrammetric ranging) are used only for river corridor sensing on open water areas, it is challenging for them to provide 3D reconstruction of the water surface, especially when rivers are narrow with dense canopies above (e.g., in Florida forests).
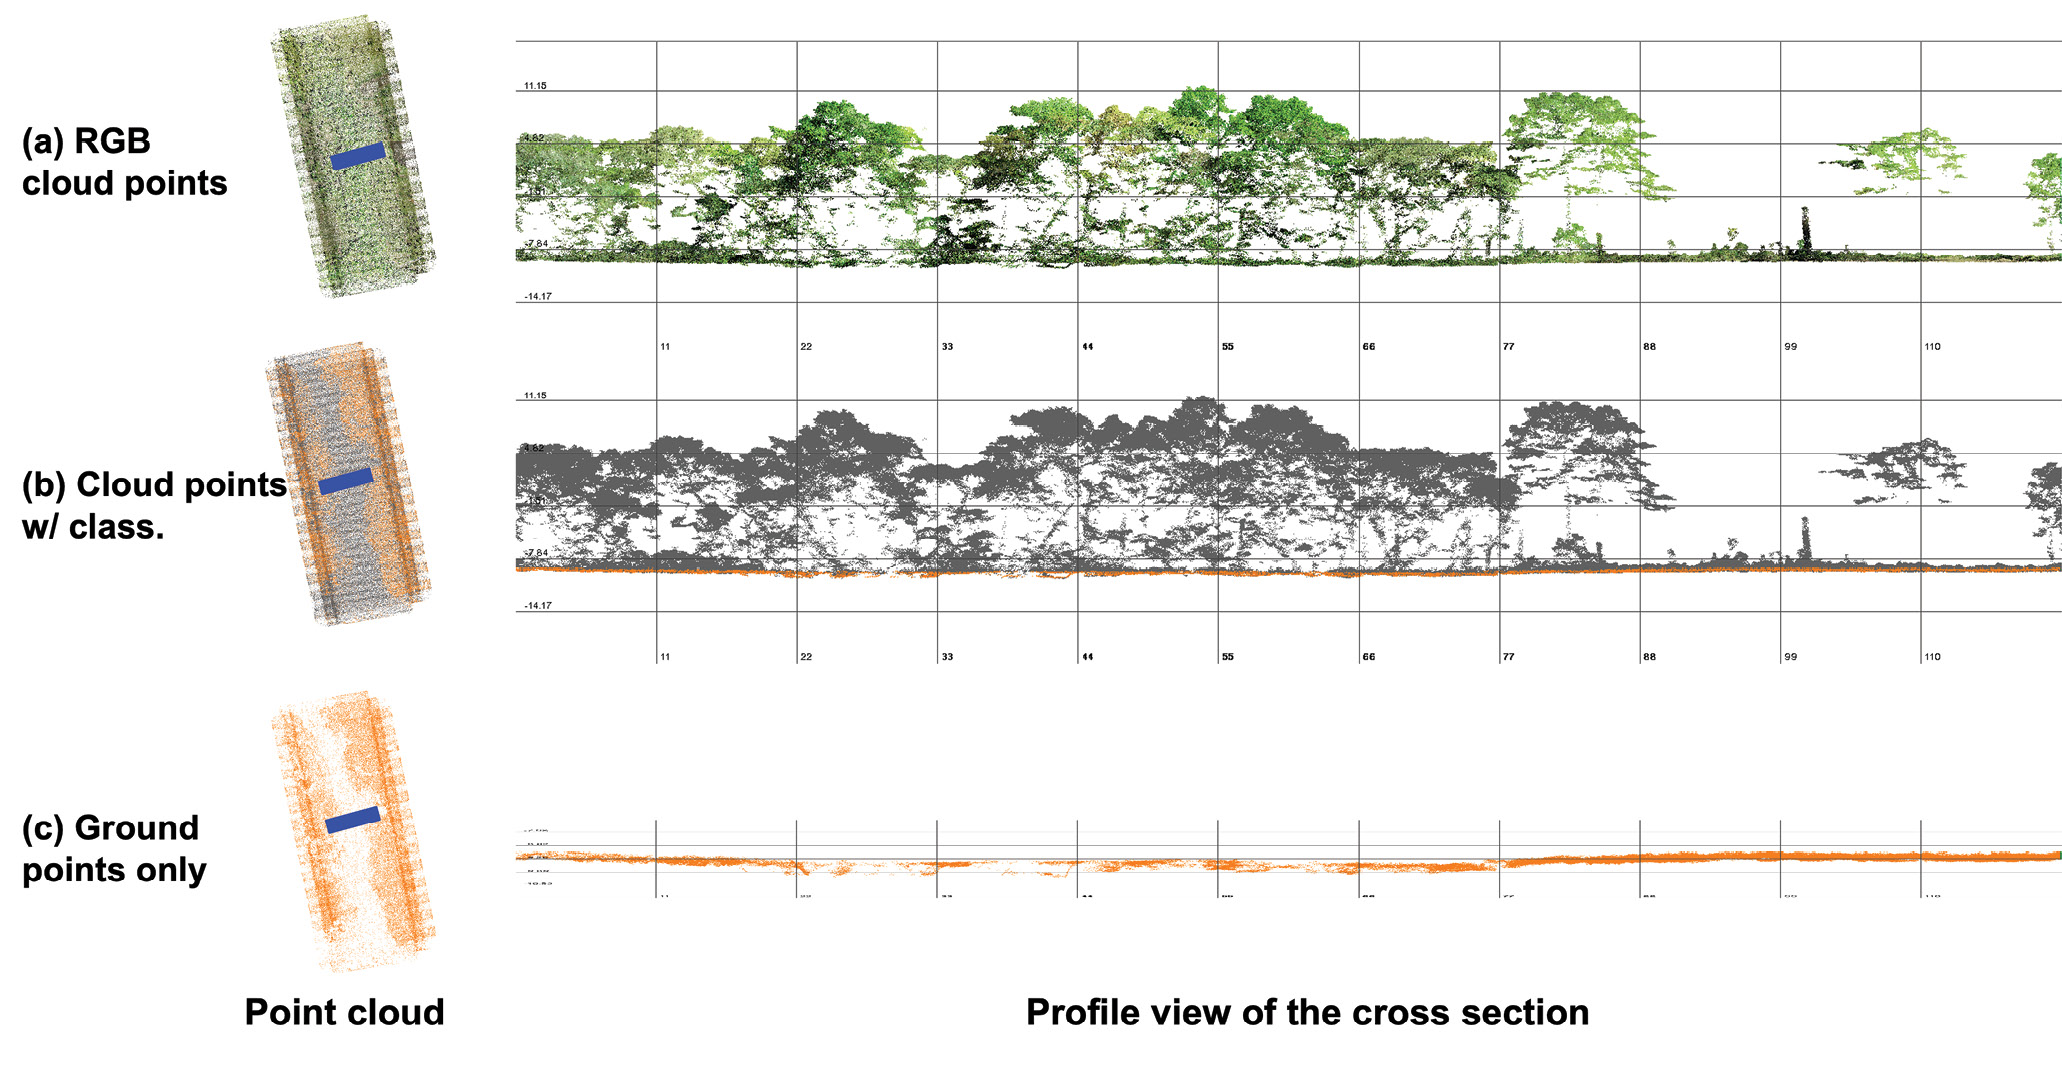
Figure 2: The point-cloud classification process of lidar data of the forest (mid-stream of the North Little Prong in Triple N Ranch) with narrow creeks with profile view of the cross-section (denoted in blue): (a) raw 3D point clouds collected from lidar with true color rendering, (b) ground point classification (ground points in orange and other classes in gray), and (c) processed ground return points.
UAVs can take high-resolution images during both wet and dry seasons within a short survey time and UAV-based sensing methods can provide information on the temporal dynamics of wet channel networks. In this study, we investigate the application of UAV-based lidar to reveal the topography and channel network in a Florida watershed with forest. Dense vegetation (e.g., bushes, trees) along the two banks of a channel can block views for imaging systems mounted on satellites and planes. The study wants to measure the water surface area (especially small creeks) in a more accurate and robust fashion. An affordable and efficient UAV-based sensing solution will generate high-resolution topographical and remote sensing data of the ground surface and stream water surface, offering considerable functionality, particularly for the locations that are relatively inaccessible from low-resolution data acquired from space. The UAV system includes an industrial quadcopter mobile platform equipped with a robust control system, UAV-compatible sensing devices (e.g., lidar), and a real-time kinematic (RTK) positioning unit. Laser pulses emitted from a lidar system reflect from the objects both on and above the ground surface (e.g., tree canopy, vegetation, building, ground), causing different returns. Lidar is used to generate a digital 3D topographical model of the surface due to differences in laser return times.

Figure 3: (a) Orthomosaic map of upper-stream of Little North Prong with RGB color, (b) digital elevation model from classified ground points, (c) distribution map of lidar pulse intensity, and (d) digital elevation model (with 1-m topographic contour lines) from ground points on GIS base maps.
We have performed a preliminary study of Triple N Ranch Wildlife Management Area at St. Cloud, Florida (Figure 1a) using UAV-based lidar sensing. Owing to the large area of the Triple N Ranch, a small portion, the North Little Prong (Figure 1b), was selected for the UAV surveying. The UAV mission was divided into three parts as shown in Figure 1c: upstream with a coverage 42 acres, midstream, 57 acres, and downstream, 104 acres (in red box). The times for the three routes with dense mapping were 27, 30 and 48 minutes, respectively. With a flying height of ~200 feet above the forest (Figure 1d), both the RGB imagery and the lidar 3D point clouds could be collected together.
Field tests will be performed on a quarterly basis to investigate the seasonal change in water surface evaluation (e.g., wet channel, ponded water). In addition to the UAV-based surveying method, conventional surveying (e.g., manual GNSS, tape measurement, ground reference points) will be used to provide ground control points. In order to derive the DEM (digital elevation model), the following data processing steps are carried out: the raw lidar 3D point cloud is collected (with color rendering) (Figure 2a); 3D point clouds are then classified into ground returns (e.g., ground, river banks) and other returns (e.g., trees, bushes) (Figure 2b); the points with ground returns are filtered out to show land cover (Figure 2c); and elevation contours are overlaid on the DEM to show the topographic features of the ground. Along the channels, repeated runs will be performed in areas with different forest systems and over time to detect seasonal variations’ effect on the water elevation dynamics.
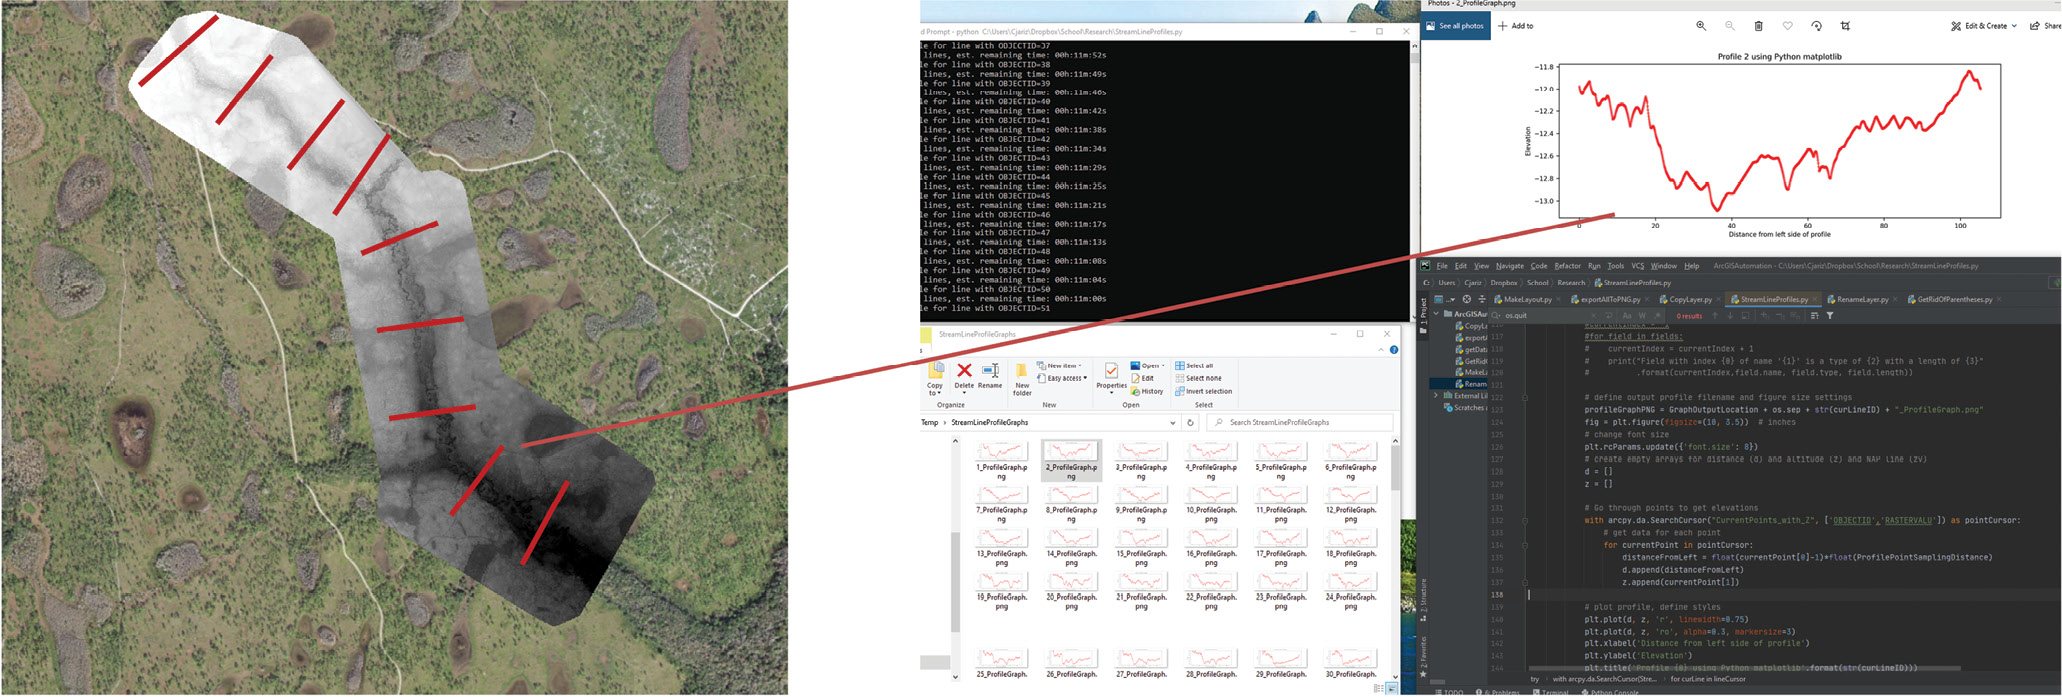
Figure 4: Water network extraction using profiles along a creek.
In addition, we are studying how to obtain accurate surface topographic information in a watershed by combining different data features (e.g., RGB imaging system, laser pulse intensity features from lidar). This data can be used to extract topographic information for a watershed and we expect to reveal and detect concave shapes on the ground even under heavy vegetation conditions, which is common in Florida. We will use a data fusion algorithm to enhance topographic mapping in forest areas, such as DEM (Figure 3b) used for topographic and hydrologic mapping (Figure 3d). We can also measure the settlement of the study area and identify potential ponding locations or creek locations at a high spatial resolution (e.g., 10 cm x 10 cm), using a DEM. In addition to the DEM generation, we found that moisture mapping over a natural or built environment could be achieved by using multispectral sensing (Hassan et al., 2022). Based on the different indices computed from multispectral bands, different sensing tasks could be fulfilled (e.g., vegetation sensing, moisture sensing). We will explore the fusion of other imagery data (e.g., thermal infrared, multispectral) into the DEM for watershed mapping in the future. ArcGIS tools may not be able to extract the channel network from the DEM with small elevation changes, such as the flat topography in Florida. Hence, we are trying other algorithms (Hooshyar et al., 2016), for example, firstly extract the profiles from DEM at different locations of creeks (Figure 4) and then try to connect them into a creek line. An algorithm to extract channel networks in Florida forests using UAV-based remote sensing data is still under development and will be published in a future article.
References
Aranuvachapun, S. and D.E. Walling, 1988. Landsat-MSS radiance as a measure of suspended sediment in the Lower Yellow River (Hwang Ho), Remote Sensing of Environment, 25(2): 145-165. https://doi.org/10.1016/0034-4257(88)90098-3.
Fonstad, M. A., J.T. Dietrich, B.C. Courville, J.L. Jensen and P.E. Carbonneau, 2013. Topographic structure from motion: a new development in photogrammetric measurement, Earth Surface Processes and Landforms, 38(4): 421-430. https://doi.org/10.1002/esp.3366.
Ghose, B., A. Kar and Z. Husain, 1979. Lost courses of the Saraswati River in the Great Indian Desert: new evidence from Landsat imagery, Geographical Journal, 145(3): 446-451. https://doi.org/10.2307/633213.
Hassan, S.Z., M. Gokgoz, P. Sun, J.N. Chen, B. Nam and S. Gustitus-Graham, 2022. A cost-effective UAV-based sensing system for waste landfill management, 9th International Conference on Water Resources and Environment Research, 296-299.
Heritage, G.L. and D.J. Milan, 2009. Terrestrial laser scanning of grain roughness in a gravel-bed river, Geomorphology, 113(1-2): 4-11. https://doi.org/10.1016/j.geomorph.2009.03.021.
Hooshyar, M., D. Wang, S. Kim, S.C. Medeiros and S.C. Hagen, 2016. Valley and channel networks extraction based on local topographic curvature and K-means clustering of contours. Water Resources Research, 52(10): 8081-8102. https://doi.org/10.1002/2015wr018479.
Leopold, L. B. and W.B. Langbein, 1966. River meanders. Scientific American, 214(6): 60-70. http://dx.doi.org/10.1038/scientificamerican0666-60.
Mandlburger, G., M. Pfennigbauer, M. Schwarz, S. Mikolka-Flöry and L. Nussbaumer, 2020. Concept and performance evaluation of a novel UAV-borne topo-bathymetric LiDAR sensor. Remote Sensing, 12(6): 986. https://doi.org/10.3390/rs12060986/.
Mertes, L. A. K., 2002. Remote sensing of riverine landscapes, Freshwater Biology, 47(4): 799-816. https://doi.org/10.1046/j.1365-2427.2002.00909.x.
Muste, M., K. Yu and M. Spasojevic, 2004. Practical aspects of ADCP data use for quantification of mean river flow characteristics; Part 1: moving-vessel measurements. Flow Measurement and Instrumentation, 15(1): 1-16. https://doi.org/10.1016/j.flowmeasinst.2003.09.001.
Rango, A. and A.T. Anderson, 1974. Flood hazard studies in the Mississippi river basin using remote sensing. JAWRA Journal of the American Water Resources Association, 10(5): 1060-1081. https://doi.org/10.1111/j.1752-1688.1974.tb00625.x.