The United States Geological Survey (USGS) has been actively engaged in collecting and publishing high-quality, lidar-derived elevation data through the 3D Elevation Program (3DEP) since 2016. The USGS Base Lidar Specification1 identifies Quality Level 2 [QL2: 2 pulses/m2 (ppsm); fundamental vertical accuracy = 10 cm RMSEZ] as the minimum for lidar elevation in the contiguous US (CONUS). With continuously improving lidar technology, however, achievable pulse densities and vertical accuracies are increasing well beyond QL2 and the cost to increase lidar quality is decreasing. With newer technologies offering greater terrain resolution, applications previously unavailable or cost-prohibitive to lidar survey are emerging. High-resolution lidar data provides the gateway to evaluate subtle changes in terrain morphology, such as karst features, subsidence, uplifts, and fault lines. A recent seismic event near Sparta, North Carolina illustrates an emerging application of high-resolution lidar.
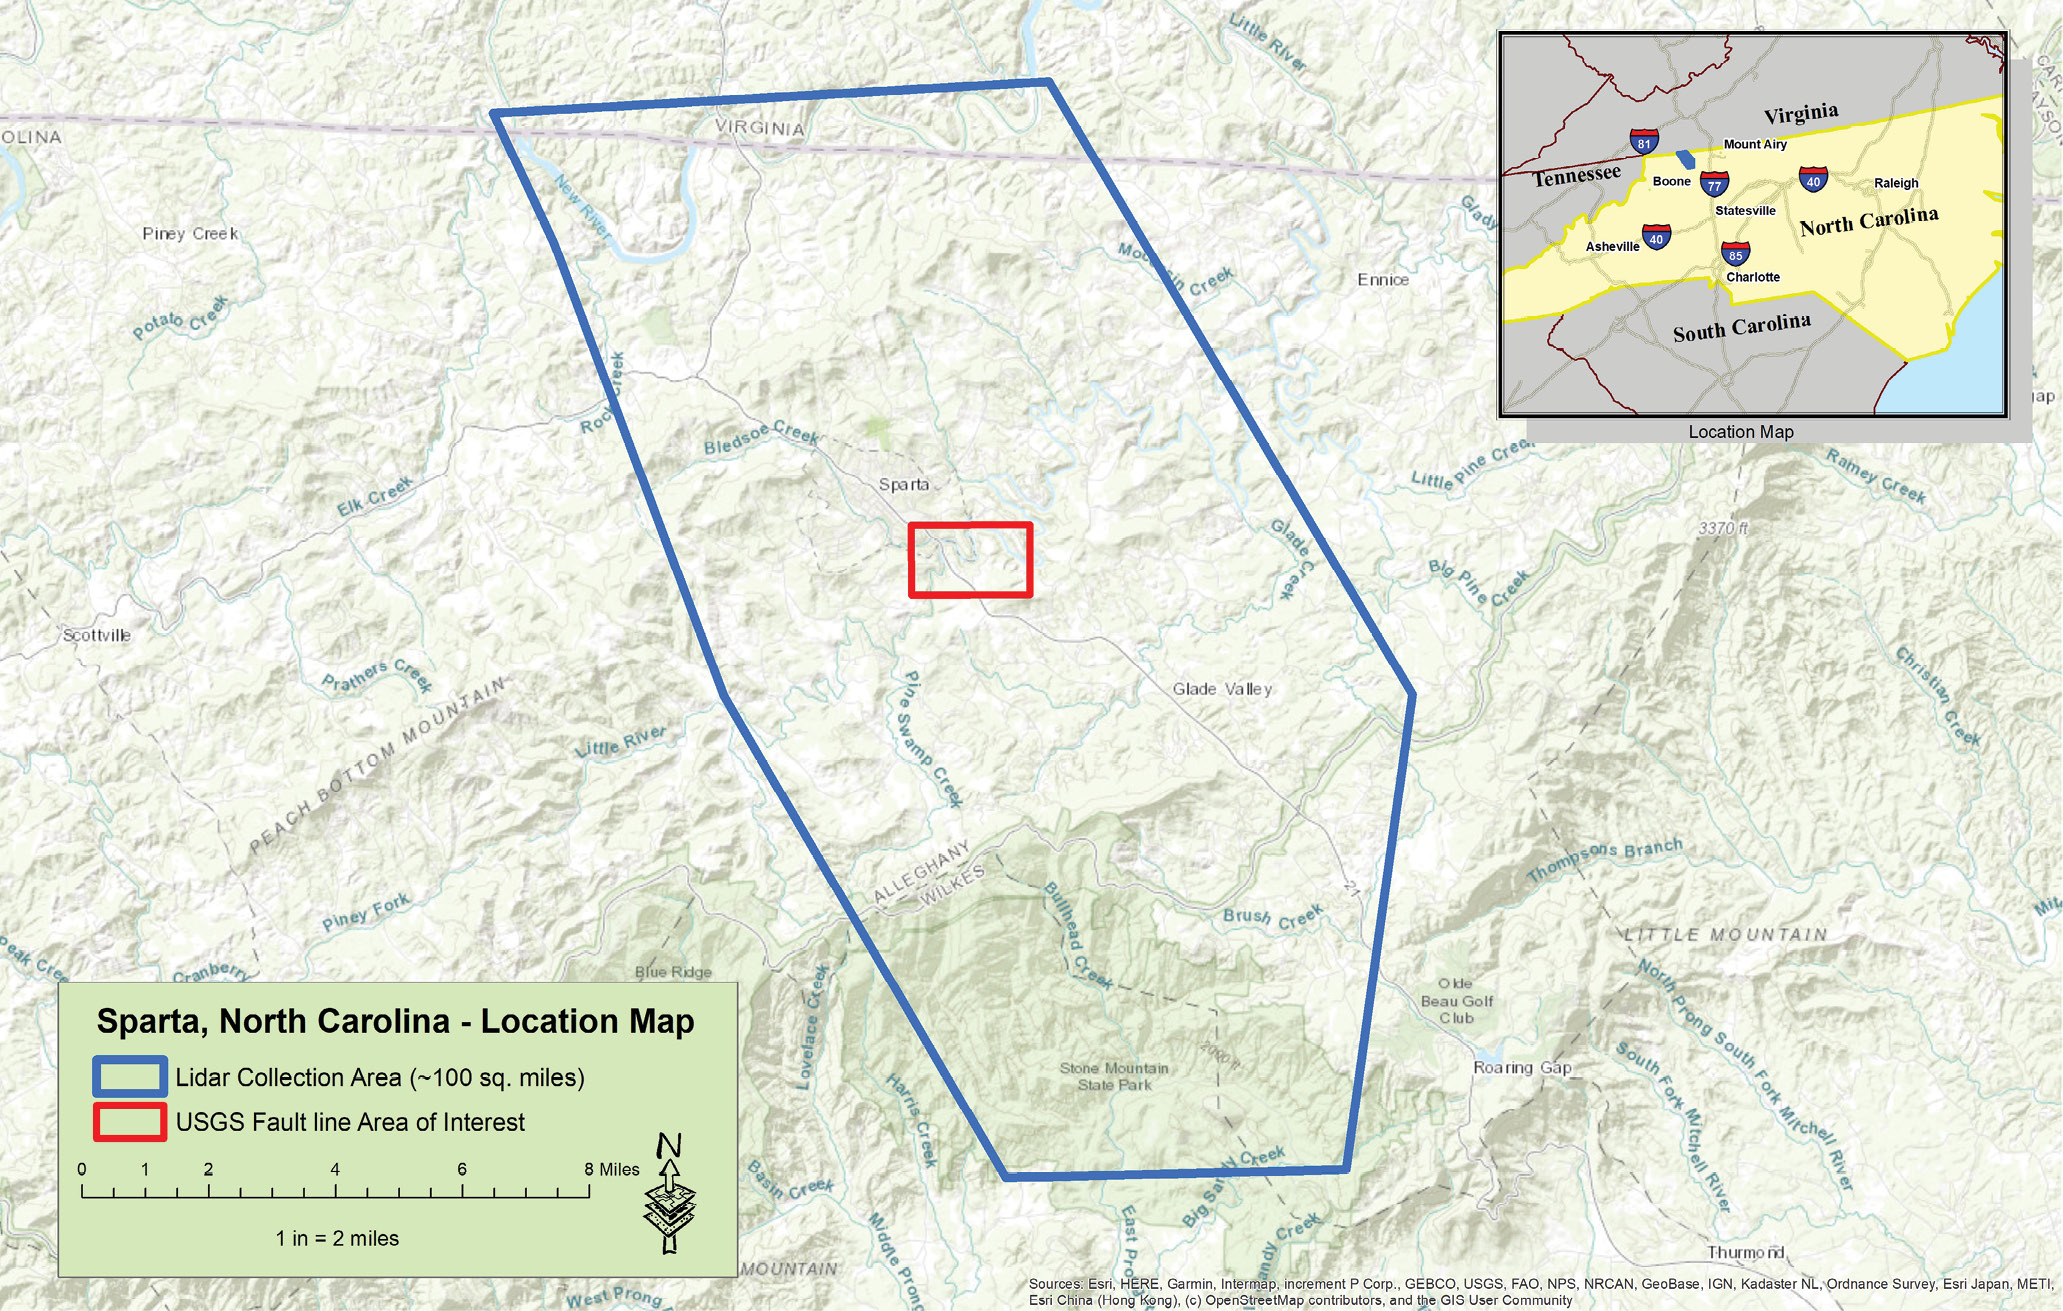
Figure 1: Location map showing the lidar collection area in Sparta, North Carolina. The red rectangle in the center of the 2020 lidar collection focuses on the area of the newly created fault line.
The Sparta, North Carolina earthquake
A relatively small seismic event, measuring 5.1 MW (moment magnitude scale, approximately equal to the Richter scale for magnitudes less than 8), occurred near the small town of Sparta, North Carolina (Figure 1) in the early morning of 9 August 2020. The earthquake was a shallow (2.3 miles deep) event not associated with an active fault line, though the effects were felt as far away as Washington, D.C. and Atlanta, Georgia. Local and national news media services photographed the aftermath of the event, documenting multiple road fissures and personal property damage (Figure 2). The event was the strongest earthquake in North Carolina since 1926, with an additional 20 aftershocks recorded after 20 days.

Figure 2: A fissure (left) in a parking area, and residential damage (right; Charlotte Observer) following the Sparta, North Carolina earthquake.
On 4 February 2021 at approximately 23:03 and again at approximately 23:30, two smaller earthquakes (2.6 MW) occurred at a depth of 1.25 miles in the Sparta, North Carolina area. Light to very weak shaking was reported for these events.
Lidar data acquisition
The Sparta, North Carolina area was mapped in late 2016 by the State of North Carolina in cooperation with USGS 3DEP using a Geiger-mode sensor at the QL1 specification, but of course this was prior to the seismic event. Dewberry, a privately held consulting firm and a USGS Geospatial Products and Services (GPSC) prime contractor, was tasked in late 2020 in support of 3DEP to collect very high density, QL1+ (> 8 ppsm) topographic lidar for approximately 100 square miles (551 750 m x 750 m tiles) in the vicinity of Sparta, North Carolina (Figure 1) to document the effects of the earthquake. The USGS task order specified an increased lidar pulse density and substantial ground control to assure high accuracy.
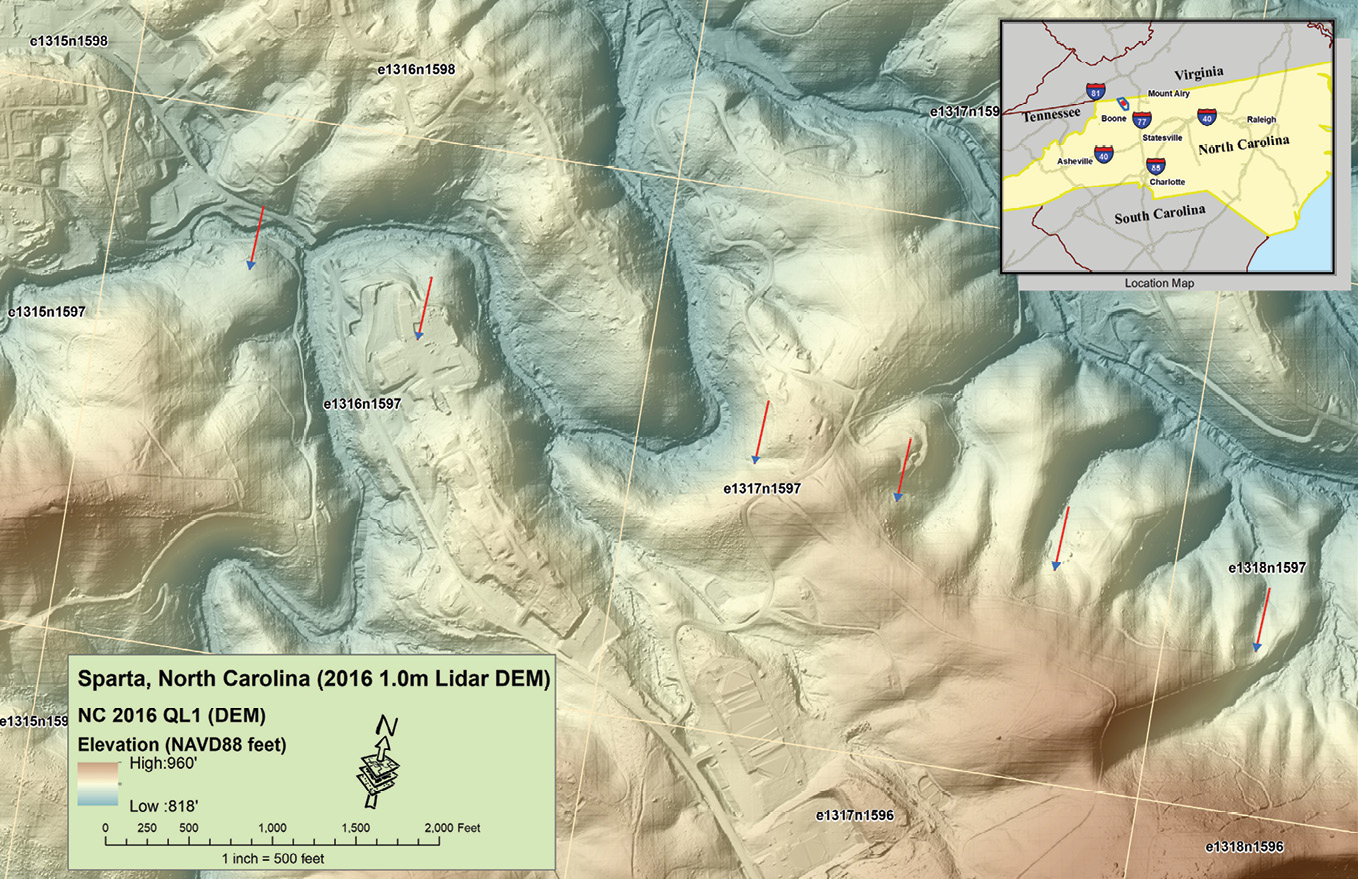
Figure 3: DEM of the USGS area of interest (red rectangle in Figure 1) derived from Geiger-mode lidar in phase 4. The arrows indicate the area of the fault created by the 2020 earthquake; the grid (yellow line) is the USGS lidar tiling grid.
Historically, Dewberry has been “sensor agnostic”, not owning or operating any lidar sensors. For this acquisition the Dewberry team was able to select and deploy the most up-to-date sensors. For the Sparta, North Carolina mission, Dewberry recommended a Teledyne Optech2 Galaxy T2000 lidar sensor and sufficient survey control to meet USGS Base Lidar Specification for QL0—a nonvegetated vertical accuracy (NVA) of 5 cm RMSEZ. The details of the acquisition and delivered specifications are provided in Tables 1 and 2, respectively.

Table 1: Lidar acquisition specifications for the Sparta, North Carolina data collection.
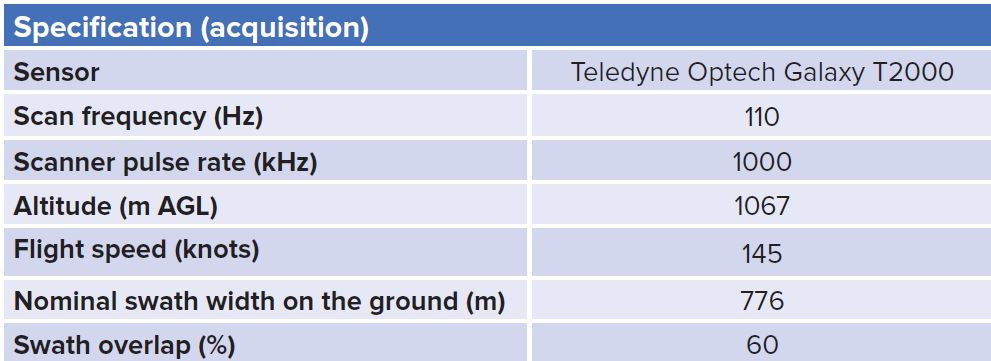
Table 2: Lidar density and accuracy specifications for the Sparta, North Carolina data collection.
Available and updated lidar
The State of North Carolina conducted a statewide lidar collection program between 2014 and 2018. The program was conducted in five phases, with phases 1 through 3 collected using traditional, linear lidar sensors, at a pulse density of 2 ppsm with 9.25 cm RMSEZ for nonvegetated vertical accuracy. Phase 4, which included the Sparta, North Carolina area, was collected in 2016 using a Geiger-mode lidar sensor at 8 ppsm. The lidar data and derived products are available for download at both the North Carolina Spatial Data Download site3 and at the U.S. National Map4 and serve as a pre-earthquake baseline terrain.

Figure 4: USGS 2021 high-density (0. 5m) lidar-derived DEM of the USGS area of interest (red rectangle in Figure 1). The arrows indicate the area of the fault created by the 2020 earthquake; the grid (yellow line) is the USGS lidar tiling grid. The fault line is vaguely visible in the area between the arrows in USGS cell e1317n1597.
Following the earthquake and analysis of the data collected in 2021, USGS geologists identified locations of newly created fault lines. In order not to obscure visualization of the actual fault, the arrows in Figures 3 through 5 point to those fault lines. Prior to the earthquake (Figure 3), the Geiger-mode lidar shows smooth elevation transition in the vicinity of the future fault line. The terrain shows no sharp breaks or evidence of morphogenic change.
The newly collected, linear-mode QL1+/QL0 lidar data was used to construct a DEM with cell size 0.5 m (Figure 4). While the 2016 and 2020 DEMs appear similar at first glance, upon close examination a shadow (fault line) is discernible in the 2020 DEM, most clearly between the arrows in USGS tile e1317n1597 (to the east of the center of the DEM).

Figure 5: Slope models after the earthquake. In Figure 5A (top), the fault line is at the ends of the arrows. Figure 5B (bottom) shows the USGS interpretation of the fault line on the DEM.
To facilitate visualization of the fault line, Dewberry used Esri Arc Hydro in ArcGIS Pro to construct a 0.5 m cell-size, curvature and topographic wetness index slope model of the area containing the presumptive fault line. The slope model (Figures 5A and 5B) clearly illustrates the rift resulting from the original earthquake. In Figure 5A, the fault line is clearly seen at the ends of the arrows. Figure 5B shows the USGS interpretation of the fault line superimposed on to the DEM.
Lessons learned
- Temporal challenge. As earthquake events are not predictable and the need to survey immediately post-event is paramount, the contracting, planning, and mobilizing of personnel and sensors is challenging. The Sparta, North Carolina event was no exception. As earthquakes are extremely rare in the area, and with the initial quakes occurring at 08:07 EDT on a Sunday, it was difficult to mobilize local authorities to begin to determine what was happening. Once it was realized that a quake had occurred in a remote portion of North Carolina, USGS needed to decide how to proceed, what data to acquire and how to acquire it in as efficient a manner as possible. It was critical to mobilize personnel and equipment to a remote area and conduct both ground and aerial surveys in a time-sensitive manner. Dewberry assisted USGS by quickly identifying the available data sources, evaluating the quality of the data and reviewing available lidar technologies to resurvey the area.
- Terrain challenge for check point survey. Once USGS, through discussions with Dewberry, determined that a lidar survey with very high resolution and precision (QL1+/QL0) was needed to characterize the earthquake, Dewberry assessed the terrain, planned the mission, and deployed personnel for both ground and aerial survey. Using the most recent and best available aerial imagery, Dewberry determined that the Teledyne Optech sensor was the best choice to map the rugged, densely vegetated terrain. To achieve the high penetration to the ground required for the survey, Dewberry determined that a 60% lidar swath overlap was necessary along with 30 high-quality survey ground points to assure vertical accuracy. Ground survey using Global Navigation Satellite System (GNSS) in mountainous terrain pushed the limits of the technology. To mitigate these challenges Dewberry used GoogleEarth™ and available ortho-imagery for the control plan, 3D views, street view, and line of sight to strategically place all control points so they would achieve optimal spacing and field of view to provide the rovers with the ability to “see” the largest number of satellites no matter the time of day at which each control point was collected.
- Remote accessibility and vegetation. The area around Sparta, North Carolina is both remote and mountainous. Outside the immediate populated area of Sparta, there are few roads through the heavily vegetated terrain. This led to several challenges during the lidar collection and personnel deployment. Few difficulties were encountered for the control collection. Dewberry picked good locations for the control and North Carolina has an impressive Virtual Reference Station (VRS) real-time kinematic (RTK) network: of all the points collected, only three required static GNSS surveys.
Additional details on the earthquake
Figueiredo, P.M., J.S. Hill, A.J. Merschat, C.M. Scheip, K.G. Stewart, L.A. Owen, R.M. Wooten, M.W. Carter, E. Szymanhski, S.P. Horton, K.W. Wegmann, D.R. Bohnenstiehl, G.W. Thompson, A. Witt, B. Cattanach and T. Douglas, 2022. The Mw 5.1, 9 August 2020, Sparta earthquake, North Carolina: the first documented seismic surface rupture in the eastern United States, GSA Today, 32: 4-11. https://www.geosociety.org/GSA/Publications/GSA_Today/GSA/GSAToday/science/G517A/article.aspx and USGS Poster Publications 10742 and 10753.
Acknowledgements
We thank Tim Saultz (USGS, retired) and Arthur Merschat from USGS for their assistance managing the project. We also thank Dewberry Survey Crew Leader Matt Rudolph and the survey crew for their rapid response identifying ground control for the project and the Dewberry lidar production team for their work throughout this project. Lastly, we would like to thank SurvTech Solutions and their acquisition team for delivering a timely and high-quality lidar collection.
Alvan “Al” Karlin, PhD, CMS-L, GISP is a Senior Geospatial Scientist and lidar subject matter expert for Dewberry in its Tampa, Florida office. Al reviews and advises on matters of scientific and technical issues. He is an ASPRS Certified Mapping Scientist in lidar.
Andrew Peters, GISP is an Assistant Department Manager in Geospatial Technology and Services in Dewberry’s Fairfax, Virginia office. Andrew manages production on large-scale remote sensing projects for USGS, FEMA, NOAA, Florida, and South Carolina.
Michael Baranowski, CMT-Lidar, GISP is a Geospatial Technology Manager at Dewberry, based in the company’s Charlotte, North Carolina office. He manages many aspects of lidar production along with resource allocation. He is an ASPRS Certified Mapping Technologist in lidar.
2 Now Teledyne Geospatial.
3 sdd.nc.gov/NCIDLogin.aspx. Login account required.
4 apps.nationalmap.gov/downloader/#/