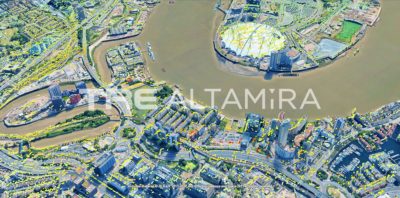
Figure 1: As InSAR can use natural features such as buildings as measurement targets, it is well-suited for detecting subsidence in urban environments. Here is one result of ground displacement data in an urban area: a 3D view of movement over the River Thames in London, with the O2 stadium upper right; the red dots signify abnormal or rapid movement.
Search Google with the words “are lidar and InSAR the same thing” and you’ll get about 375,000 results. That doesn’t mean that there are 375,000 documents or articles that support or address that exact question, but the matches are indicative of one thing: lidar and interferometric synthetic aperture radar (InSAR) are intriguing professionals in a variety of sectors. And that interest is helping to transition the technologies from their innovative beginnings into commercial commodities.
According to a report published by Fortune Business Insights in January 20201, the global lidar market hit $1.3 billion in 2018 and is projected to swell to $6.7 billion by 2026. There is less market analysis of InSAR, but industry insiders estimate the global market value is currently about $60 million—and growing steadily. Market leader TRE ALTAMiRA (TREA), a CLS Group company and 20-year veteran of InSAR services with offices in Milan, Barcelona and Vancouver, has seen its revenues triple in 10 years.
As the popularity and advance of these technologies have grown, however, so have the misconceptions about their capabilities, how they can be used, and what information they can provide.
“A common misunderstanding about lidar and InSAR is that they are directly competing technologies,” says Giacomo Falorni, technical director of TREA’s Vancouver office. “While it is true that they are both remote sensing technologies that can be used to measure topography and 3D structures, they are different in what they measure. Lidar is great for modelling surface topography or urban infrastructures. InSAR measures the displacement of topography or buildings over time. So they are complementary. You can create a base DEM or DSM with lidar and then use InSAR to see how the topography in areas with subsidence is changing over time with millimeter precision.”
However, recognition of that key differentiator—surface topography versus ground-surface movement—is on the rise, says Falorni. And that awareness is enabling more users to understand the strengths of each, the limitations of each, and the advantages of using lidar and InSAR together.
Key differentiators
Users familiar with lidar understand its aptitude for delivering dense 3D data of land cover. Its ability to acquire precise 3D X, Y and Z coordinates allows users to map and model features for a range of applications, such as forestry, urban planning, geomorphology, mining, landslides and utilities.
InSAR is a 1D or 2D technique that provides planimetric and height measurements. The vertical component can cause confusion, leading people to think that InSAR, like lidar, is measuring elevation. The difference is that InSAR’s vertical measurement correlates with change in elevation over time for a point on the ground rather than a true Z coordinate.
“InSAR won’t tell you the height of something,” says Falorni, “but it will tell you the movement of something. InSAR captures hundreds of thousands of points and, for any measurement point, it can tell you with millimetric precision if it’s moving, the direction it’s moving—up or down or horizontally—and if the movement is accelerating. It can also provide that displacement detail over weeks, months, years or decades.”
In addition to measuring movement rather than pure height, InSAR is based on satellite imagery, enabling substantial areas of interest (AOIs) like the city of London to be covered in a single scene and as often as every week (Figure 1). Measuring change with lidar is too costly and impractical over large areas or frequent repetitions and it yields accuracies around ten centimeters rather than millimeters. Large-area coverage, frequency and precision make InSAR the technology for deformation mapping.
InSAR, however, cannot achieve the same spatial coverage as lidar because it is more affected by vegetation. That makes lidar the better mapping tool for many deliverables, for example DEMs, vegetation surveys, building heights, utility line surveys and modeling and volumetrics of materials such as waste piles at a mine.
InSAR involves examining SAR backscatter signal phases from satellites over the same geographic area at regular intervals. The differences in the phases are a direct result of changes in the distance between the target and satellite, due to the slightly different position of the point on the ground at each pass. Combining two SAR images taken from a similar vantage point in space produces an interferogram, which illustrates phase differences between the images through a colorful pattern of fringes that represent changes in ground movement.
InSAR’s unique ability to go back in time—nearly three decades—is a benefit that can not only provide historical context for lidar-based DEMs, but has also helped shift perspectives on land management and what is assumed to be stable ground.
“Because of InSAR’s point density and substantial spatial coverage over AOIs, we can often show millimetric movement that clients were not aware of,” says Falorni. “Those revelations enable them to take proactive steps to avert a potential failure.”
Indeed, with the possibility for small movements to lead to major events and potentially sizable damage, understanding surface instability is crucial for geohazard management, urban subsidence, mining, civil engineering, oil and gas, or water utilities.
Remote complements
Analyzing, mapping and monitoring geohazards, such as landslides has been a mainstay application of InSAR since the technique was first developed in 1993, and it still is. Although InSAR isn’t a tool for sudden, swift landslides, it is very effective in detecting and monitoring “creeping landslides,” or deep-seated, slow-moving slides that are a continuous threat. The velocity detail from InSAR also enables users to analyze land movement over time and potentially forecast how landslides might continue to move based on historical movement. Coupled with lidar, which isn’t vulnerable to ground-surface disruptions and can penetrate vegetation, users can create comprehensive landslide maps and flag unstable areas.
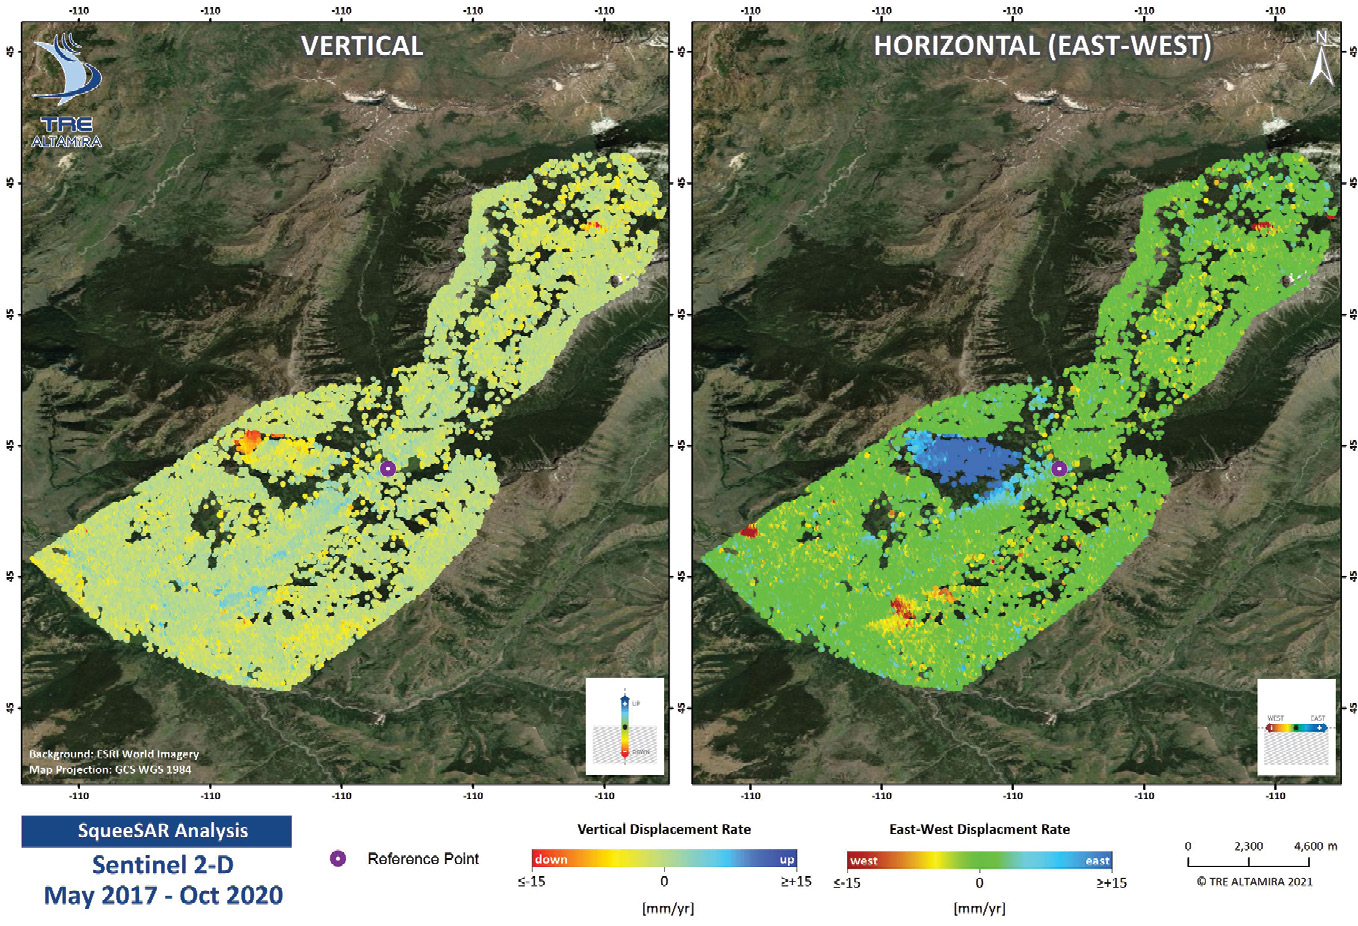
Figure 2: TREA’s InSAR color-coded results show a four-year deformation history of a landslide in Yellowstone National Park. The image on the right indicates that the landslide has been subsiding 25 mm per year for the past several years.
The combined technologies helped authorities at Yellowstone National Park design a better course for a road that was planned to be re-routed near the toe of an active landslide. Unsure of the risk to the road, they sought an InSAR historical analysis to validate whether the landslide was moving and how quickly. TREA acquired an existing lidar DEM and 115 scenes from the European Sentinel-1 satellite from 2016 to 2020. Using its advanced SqueeSAR algorithm, it processed the entire image stack to develop a timeline of displacement over an area of 130 km2. In March 2021, TREA delivered a color-coded point cloud of the AOI in which each point has a four-year deformation history (Figure 2). The results showed that that particular landslide had been rapidly subsiding by 25 mm/year for the past several years—a surprising discovery that allowed them to rethink the road design.
In addition to mapping pre-collapse shifts from sudden slides, such as California’s massive Big Sur landslide in 2017, TREA has been monitoring landslides in Alaska’s Denali Park, Dawson Creek in Canada’s Yukon Province, and others around the world. Its office in Italy has been providing on-going landslide monitoring to Italy’s Tuscany region since 2016. Using imagery from the European Sentinel-1 constellation, TREA processes millions of measurement points across the whole region every 12 days and provides an InSAR bulletin that highlights areas of sudden movement or acceleration in movement.
“This precise, simplified view allows local authorities to take a proactive approach to geohazards and dispatch people into the field to examine at-risk areas,” says Falorni.
Mining for the truth

Figure 3: In mining, InSAR’s consistent check on ground movement provides an early-warning system for potential ground-movement hazards of which site engineers may not be aware. Image by István Mihály, Pixabay.
Adopting a more comprehensive preventative approach for monitoring structural assets has been particularly widespread in the mining sector. Since the catastrophic failure of the Brumadinho tailings dam in Brazil in 2019, the mining industry has collectively moved towards implementing more effective asset-monitoring tools. Lidar and InSAR have been a significant part of that pattern.
Many companies use lidar to model entire mines or specific sections of a site for planning and managing resources (Figures 3 and 4). It is particularly suitable for determining the amount of rubble in waste piles.
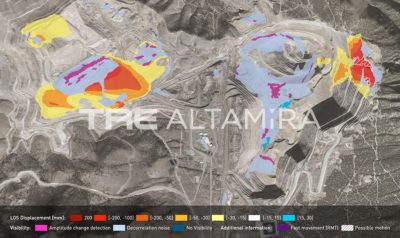
Figure 4: An InSAR map of ground deformation over an active mine. InSAR’s synoptic view of entire mine sites can help manage risk and focus efforts for higher-frequency ground-based monitoring systems where required.
InSAR is becoming the first choice for monitoring deformations of pit slopes and waste rock dumps, tailings, natural landslides, and subsidence induced from underground mining, particularly where historic information is limited or unavailable (Figure 5).
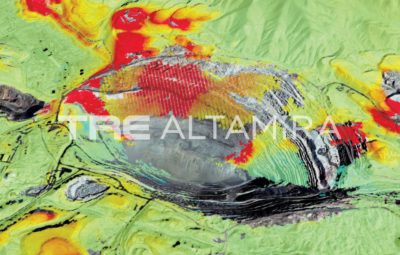
Figure 5: As subsidence can often happen outside localized measurements of GNSS or inclinometers, InSAR provides an early-warning system for potential ground-movement hazards at mine sites. This InSAR view shows an unstable slope in a mine pit in South America.
“InSAR’s frequency, accuracy, large area coverage, relatively low cost and historical datasets have made it highly attractive over the last decade,” says Neil Bar, a geotechnical engineer with international geotechnical engineering services company Gecko Geotechnics. “Ground-based monitoring systems, such as prism monitoring and inclinometers, whilst incredibly useful, require significant installation time and maintenance and it’s practically impossible to cover an entire mine site where human resources are scarce. InSAR’s consistent check on ground movement provides an early-warning system for potential ground-movement hazards we weren’t aware of, usually well before there are any visual signs of ground disturbance. This helps manage risk and focus efforts for higher frequency ground-based monitoring systems where required.”
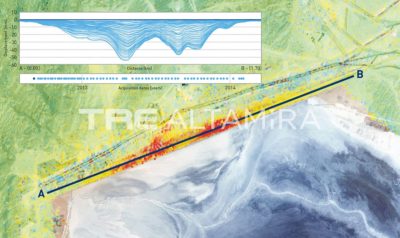
Figure 6: An annotated InSAR view showing uneven settlement in a tailings dam in South America. Since some recent catastrophic failures of tailings dams, the mining industry has collectively moved towards implementing more effective asset-monitoring tools.
In one recent case, TREA acquired and processed high-resolution TerraSAR-X imagery of a tailings dam. The results showed clear signs of horizontal movement, a significant indicator that bulging may be occurring in the dam (Figure 6). That precise detail enabled the company quickly to alter operations and implement preventative measures.
“Often subsidence happens outside the localized measurements of GNSS or inclinometers,” says Falorni. “And although there might not be significant movement initially, the history of motion provided by InSAR allows non-linear movement to be monitored and, in a worst-case scenario, inverse velocity methods can be applied to predict if and when a collapse may occur.”
In addition to active mines, companies also use InSAR as a remote tool to help monitor subsidence and other changes at decommissioned sites.
At present, TREA provides ground-movement monitoring for about 100 mining sites and is adding more than 110 to its portfolio through a recent agreement with natural resources company Glencore—the largest industry agreement to date for monitoring of tailings storage using satellite data.
Monitoring the flow
There are other applications, such as dam monitoring, tunneling and management of water resources, where lidar is not needed as a complement to InSAR.
A California state government (CSG) department has been using InSAR since 2018 for statewide subsidence monitoring of 127 high- and medium-priority groundwater basins.
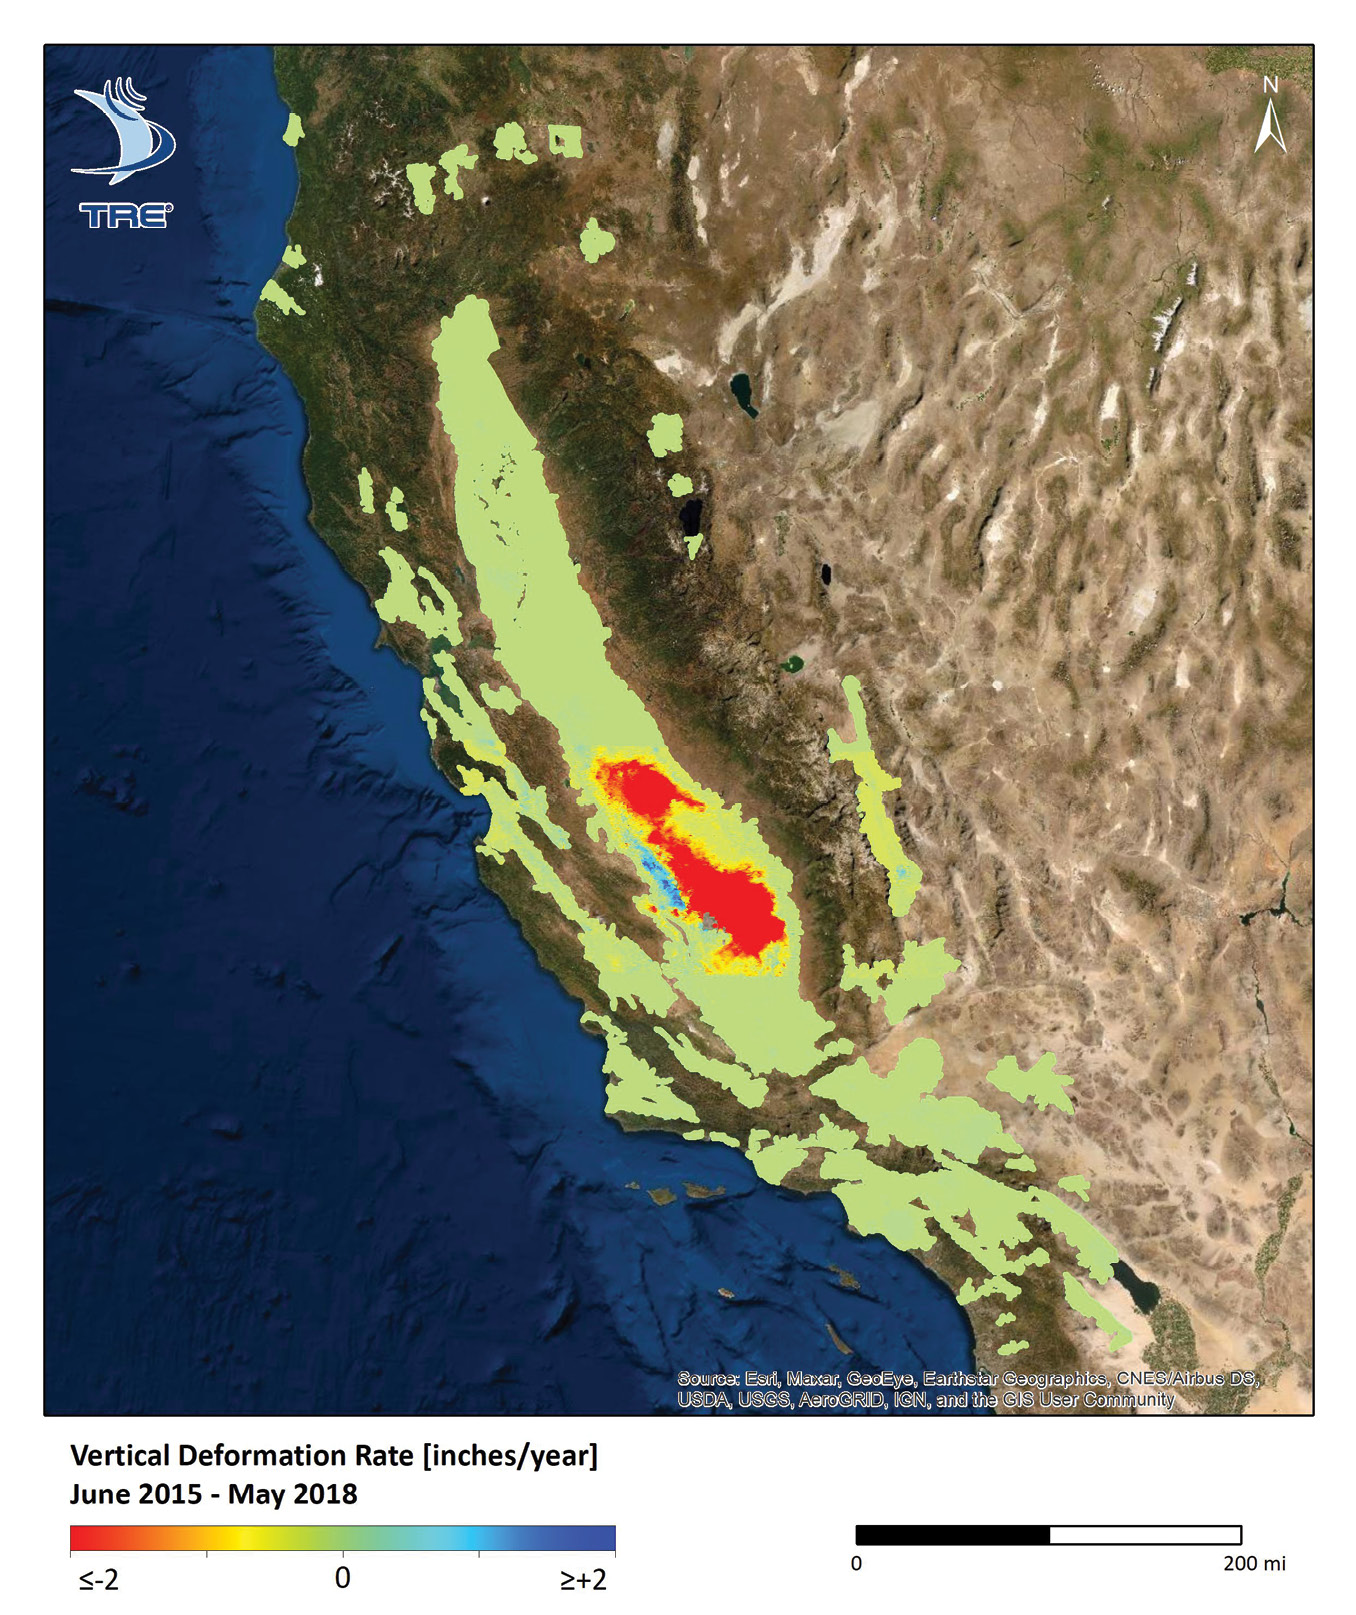
Figure 7: View of ground subsidence over high-risk water basins in California. The Central Valley is subsiding at rates of up to 30 cm per year.
CSG first tasked TREA with a historical analysis to establish a baseline. TREA processed 6424 Sentinel-1 scenes over a three-year period from 2015-2018. In accordance with the department’s request, they used 231 existing GNSS station measurements to calibrate the InSAR measurements and a survey company used an additional 600 GNSS measurements to validate the InSAR results. Within three months TREA delivered a 2D, fully calibrated point cloud of ground displacement over 100,000 square miles (259,000 km2) that revealed widespread subsidence—agricultural areas in the Central Valley showed more than 30 cm of deformation over three years (Figure 7).
After that initial report and subsequent annual updates, CSG solidified the value of InSAR by increasing the monitoring with a detailed point cloud every three months.
“InSAR is so consistent and precise that it’s like giving the CSG 90 million GNSS points instead of the existing 900,” says Adrian Bohane, CEO of TREA’s Vancouver office. “They can track and monitor precise areas of movement and amount of movement from their desktop, giving them quantifiable information to proactively manage their critical water resources.”
Figure 8: InSAR is quite effective for measuring ground subsidence in urban areas. This image shows significant movement of the Millennium Tower in downtown San Francisco, a luxury high-rise that became known as the “Leaning Millennium Tower’’. Despite a $100-million construction project to fix it, it is still sinking and tilting.
InSAR is also a valuable tool for extractive operations such as tunnelling. Because it can use natural features (buildings, metallic objects, pylons, and exposed rocks) as measurement targets, it can identify subsidence during tunnelling operations as well as after. TREA, for example, has been providing regular InSAR details to the Société du Grand Paris during the construction of the Grand Paris Express, a 200-km network of underground metro lines, to monitor the impact of tunnelling operations on existing buildings and surface structures along the track and adjacent areas. Once construction is done, they’ll continue to use InSAR to detect any residual subsidence (Figure 8).
Synergistic tools for the future
Whether an application is suited to lidar, or InSAR, or would benefit from both, the two technologies bring their own valuable perspectives to an increasing number of industries. As more professionals become familiar with these tools, those Google search strings may lead to more business for each. And that kind of movement would no doubt be welcome.
Which tool?
| Lidar | InSAR |
| Topography: creating DEMs/DSMs | Topography: wide-area subsidence mapping/monitoring |
| Land cover: mapping tree canopies/vegetation | Mining: mapping/monitoring deformation |
| Urban development: mapping buildings/determining heights | Tunnelling: monitoring displacement |
| Mining: surveying for volumetric calculations | Geohazards: monitoring landslides |
| Utilities: surveying power lines and poles | Urban infrastructure: mapping/monitoring structural subsidence |
| Land management: erosion control | Dams: measuring/monitoring reservoir slope stability |
| Geohazards: mapping landslides | Water management: monitoring groundwater basin integrity |