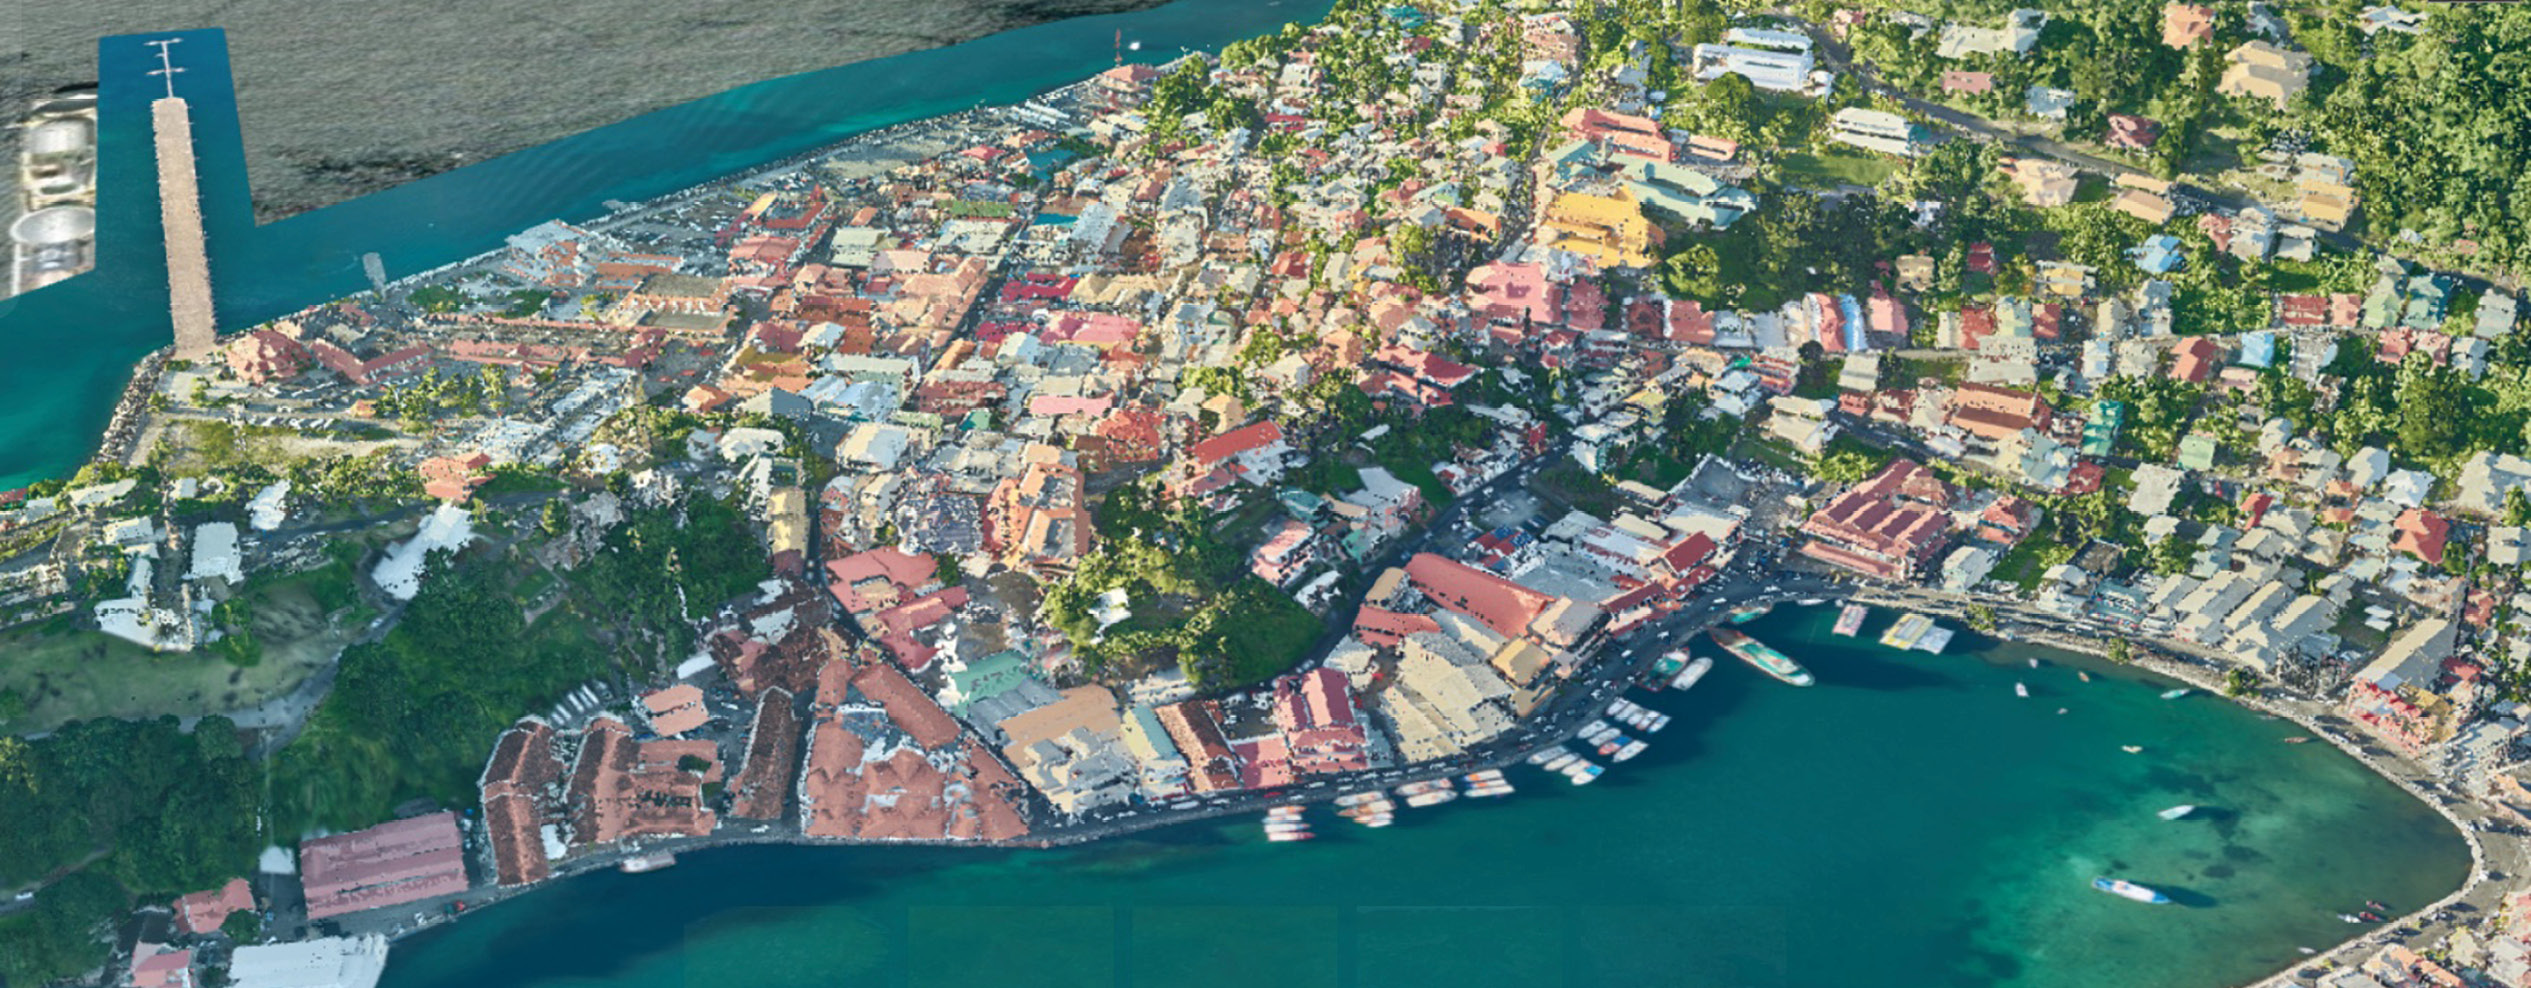
Airborne lidar over St. George, Grenada, colorized using aerial imagery
Grenada, a nation small in both size and population, recently recorded a monumental achievement. In 2021, the country became the first to make a digital copy of itself, a 3D model government officials can use for sustainability plans. Like many island nations, Grenada is confronting an uncertain future in the face of climate change. Increasing heat, intense rainfall, and saltwater intrusion into the water supply and soil have begun to threaten1 the country’s two primary economies—agriculture and tourism. One key challenge was how to continue to grow in a sustainable way and adapt to the changing environment. This would require a geographic approach—understanding what was happening, where.
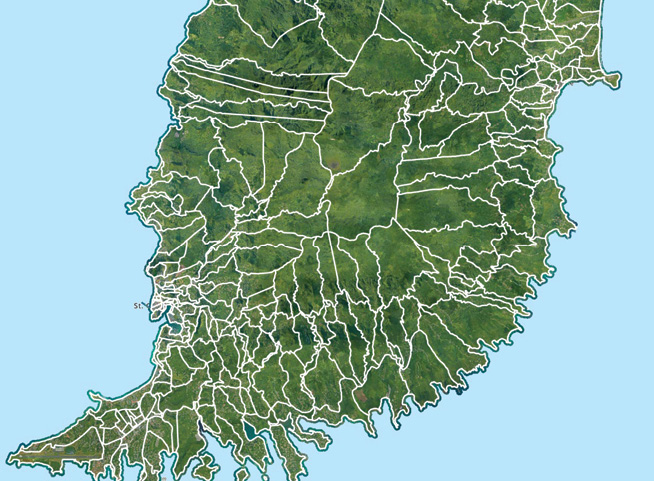
The island of Grenada divided into enumeration areas based on population distribution
Grenada’s government had stores of raw geospatial data in the office of the Ministry of Agriculture and Lands. In 2019, the office had received World Bank funds through the Regional Disaster Vulnerability Reduction Project2 and hired Fugro, a company that specializes in geographic and geological data-gathering and analysis, to do extensive aerial reconnaissance of Grenada. Fugro surveyed the Caribbean nation’s three major islands, as well as six smaller ones. The result was a treasure trove of information, including a lidar point cloud and extensive orthophoto mosaics. But for practical purposes, it was more like treasure without the trove. In short, there appeared to be no way to organize all this valuable information, until Esri spoke with the ministry about creating a “digital twin.”
The power of two
The digital twin3—a virtual representation of the objects and processes of a real-world system—has rapidly evolved in recent years. The earliest digital twins were built to monitor the functioning of industrial factories, down to the level of individual valves and gaskets. Digital twins are now complex enough to model entire municipalities. City managers use them to monitor urban functions. Planners use them to visualize and analyze the likely effects of proposed changes.
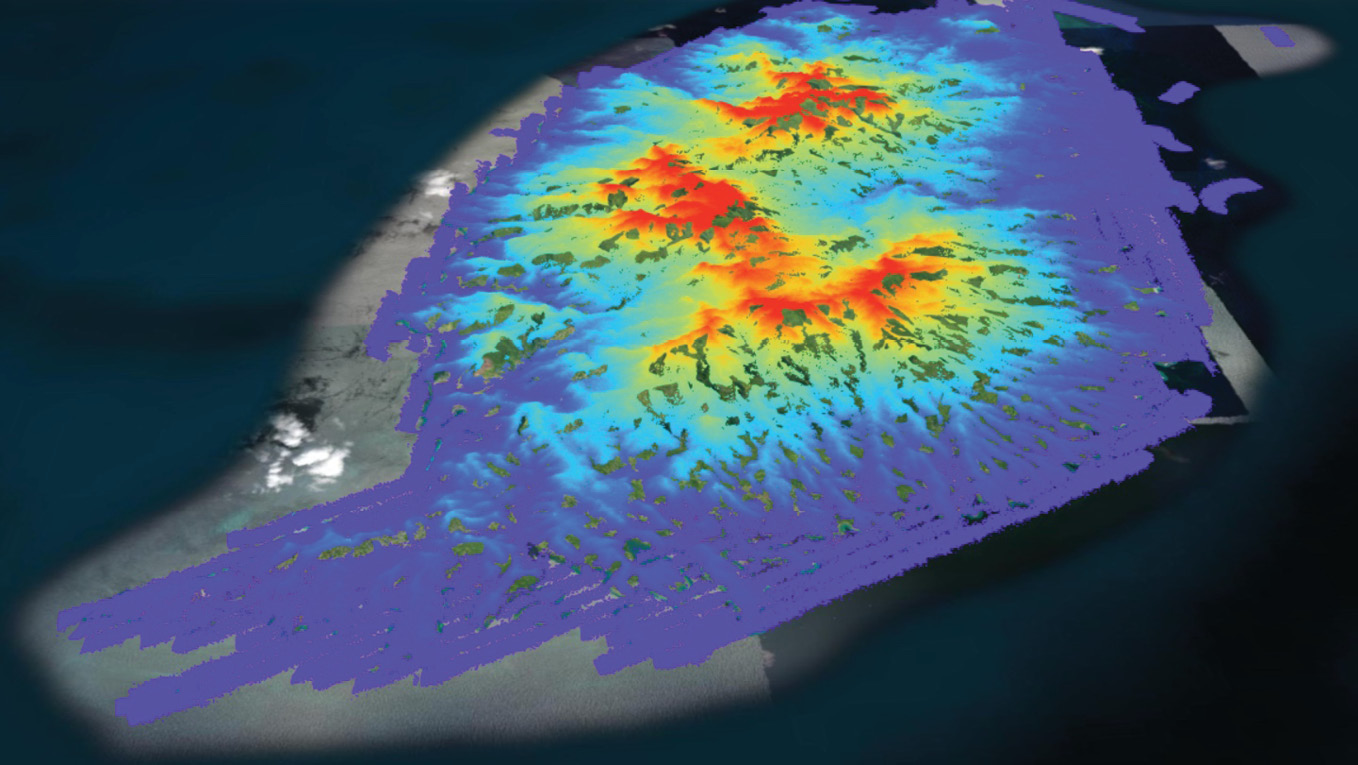
Airborne lidar over Grenada, colored by point-cloud elevation
Today’s citywide digital twins can be intricately detailed. Singapore’s digital twin, for instance, extends to underground infrastructure and even some indoor features. IT experts within Grenada’s government ambitiously decided to extend the country’s twin nationwide, built on a geographic information system (GIS)4. Necessary for making digital twins truly operational, a GIS stores and displays disparate datasets that share locational components. These interactive and collaborative 3D models can then be used to drive better decision-making and policies at a larger scale than previous systems allowed.
A GIS enabled officials in Grenada to stack the imagery and point-cloud data. These could be consumed as separate map layers but could also be combined to create something functionally larger than the sum of its parts. With its 20 cm resolution, the resulting orthomosaic produced a data-rich, detailed representation of the island. Linking the 3D lidar data brings the imagery into full relief.
The digital twin goes deep
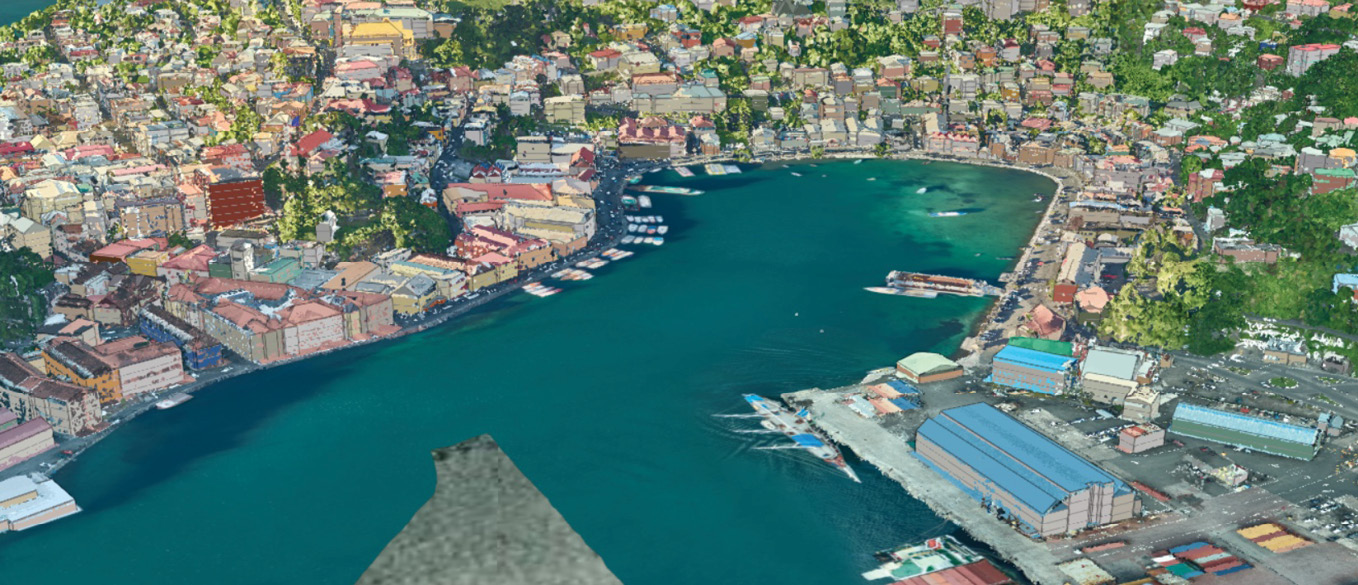
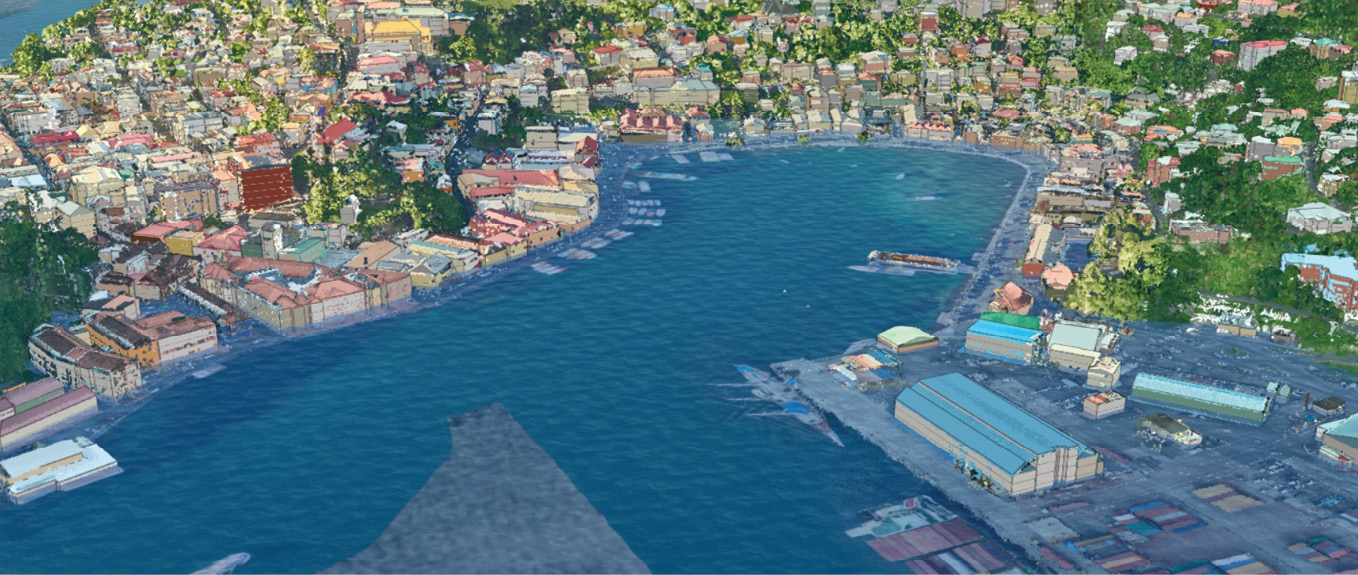
St. George Harbor, Grenada without sea level rise projection
Government officials ultimately sought to use the country’s digital twin to improve the lives of Grenadians, who are at the mercy of a swiftly changing ecosystem. For members of the ministry, this started with extracting streets and buildings from the visual data so these could be sorted and quantified. The data could then be manually coded, a process that even for Grenada—a nation with a population smaller than Provo, Utah—could require up to six months of work. So Grenadian officials worked with analysts from Esri5 to deploy artificial intelligence capabilities within a GIS. A deep learning model in the ArcGIS Living Atlas of the World6, able to identify buildings, could easily be adapted to Grenada’s data. Within a day, analysts were able to use the program to identify and label 55,000 built structures. They then used GeoAI7 capabilities to sort and classify other parts of the digital twin’s visual data, such as roads, powerlines, streams, and other inland bodies of water, along with vegetation and land cover.
Endless combinations
Projection of 2 m sea level rise in St. George Harbor, Grenada
These classifications are valuable by themselves. For instance, staff from Grenada’s Central Statistics Office, which were partners in the digital twin efforts, realized that the building data could greatly simplify the process of planning the national census and recognized the value of having for the first time ever a complete building inventory of the country.
But the categories were also powerful when combined. The Grenadian government and Esri used the stream data, vegetation classifications, and digital terrain model (another segment of Fugro’s aerial collections) to highlight spots in the country most in danger from landslides. This was mainly an automated process: with the classifications in place, the GIS could generate the results. Other formulas and calculations produced flood susceptibility models, revealing where island residents were most vulnerable to the effects of weather related to climate change.

Airborne lidar over St. George, Grenada, colored by point-cloud classification
The 3D nature of the lidar data further contributed to the power and utility of Grenada’s new model. Seeing how far a building or road is from a landslide-prone area is helpful. Having the ability to zoom in and examine how a building is perched on a steep hillside, or how a vulnerable road’s angle of descent would appear from the perspective of a motorist, pedestrian, or cyclist, adds further context.
Seeing the future
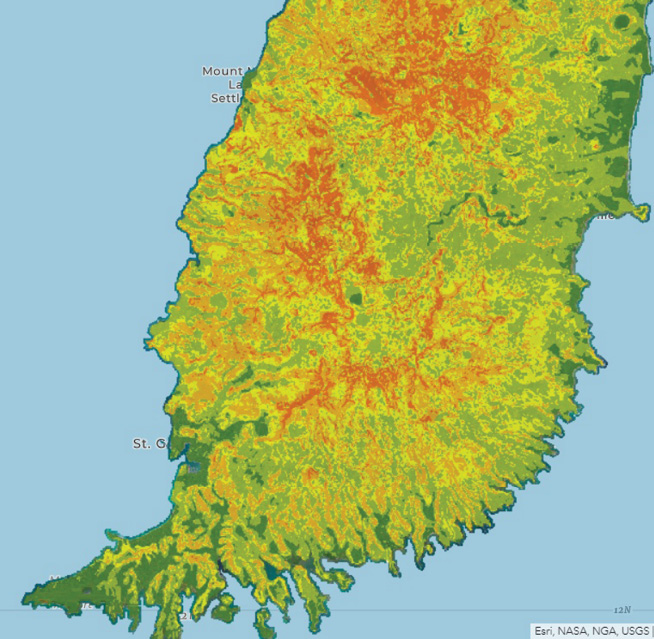
Landslide susceptibility for the island, as calculated from soils, elevation, and land cover data
Grenada’s digital twin has a foundational quality. The data it comprises is now the basis for what the United Nations calls an Integrated Geospatial Information Framework (IGIF). It provides a complete view—both realistic and holistic—of the country, which serves the needs of decision-makers today. This digital twin also has a predictive component that enables officials to visualize future challenges posed by climate change, along with possible solutions.
The government has used the twin, along with the bathymetry information included with Fugro’s data, to model sea-level-rise scenarios. This allows it to illustrate storm surge and flooding damage—to see what will be impacted and where. The visual context of the map transcends numeric projections, facilitating policy decision-making for prevention and mitigation.
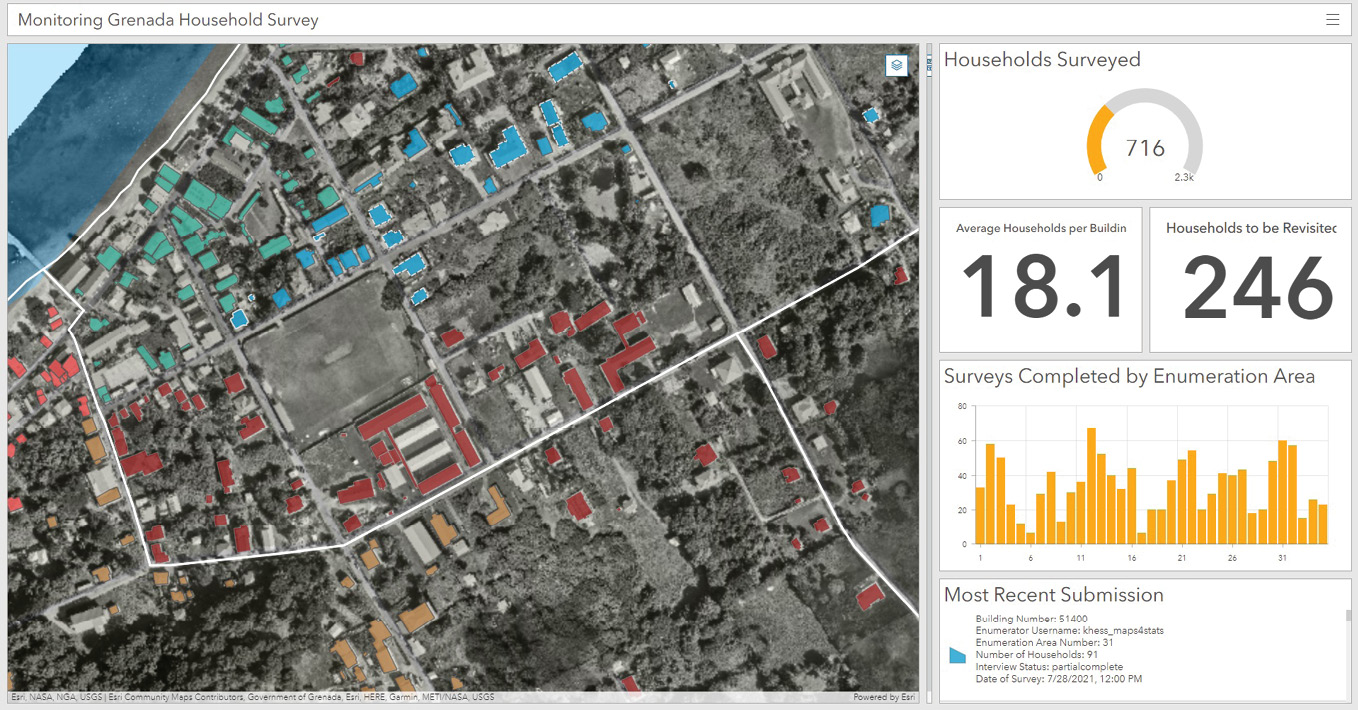
An Esri ArcGIS Dashboard for tracking enumerator progress as they conduct a population and housing census
The digital twin can also serve as an ongoing historical record. For example, the lidar data identified 4.5 million trees, and, if more aerial data is gathered at points in the future, the twin’s GIS can analyze tree growth and note any significant deforestation. As important as the AI capabilities are for this kind of calculation, they wouldn’t have been possible without the lidar-enhanced imagery. Grenadian planners, interested in growing the country sustainably, can now look at a section of the map and imagine how further development will impact—and be impacted by—future changes in vegetation.
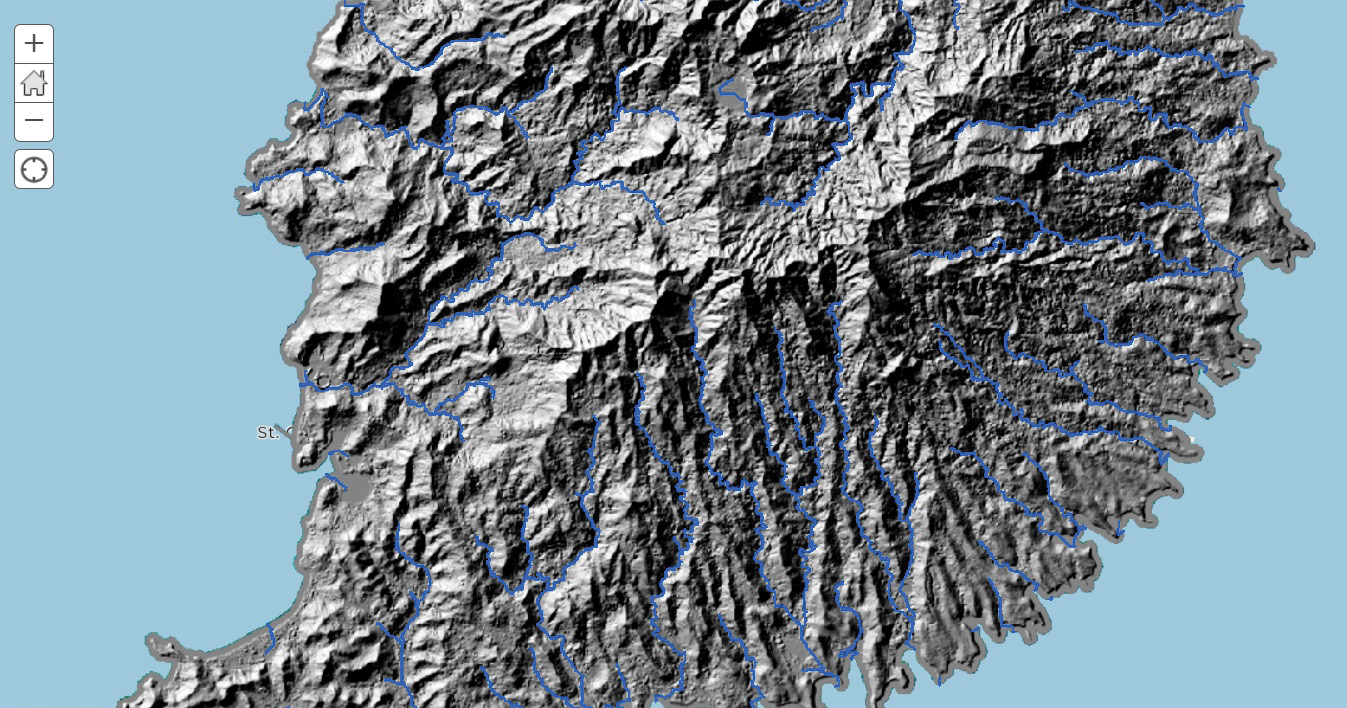
Drainage flow lines show the path precipitation would take across the island, based on the elevation
The power of a GIS-powered digital twin is that it enhances human observation. While a digital twin can’t literally see into the future, it is a window into several potential futures. However, none of this would be possible without highly accurate imagery data and geospatial technology that ties geographic information together. These collaborative technologies are turning data into something meaningful, viewable, measurable, and, ultimately, actionable.
Working toward sustainability goals of their own, other countries will likely follow Grenada’s lead, building location-intelligent digital twins of their own.
GIS and sustainability
To learn more about how GIS and imagery can be used to help create a sustainable, prosperous future, visit esri.com/en-us/geospatial-thinking/overview.
 Linda Peters is the Director of Official Statistics Solutions at Esri. She has over 25 years of experience working in the geospatial industry. Working for Esri for 17 years, Linda has consulted with companies across industries, helping them achieve greater efficiencies by leveraging GIS technology and spatial analysis. Today she works with national statistical offices across the globe, helping them understand how to apply geographic methods and GIS to census and statistical activities. Linda is a member of the UN-GGIM Expert Group on the Integration of Statistical and Geospatial Information, as well as Big Data working groups, and has consulted with other expert groups. She is also currently a board member of Applied Geography and past president of the Business Geography Specialty Group. In 2014, Linda authored Esri’s massive open online course, “The Location Advantage,” designed to teach students how to apply geospatial technology to business. And most recently, she co-authored the book GIS and the 2020 Census: Modernizing Official Statistics.
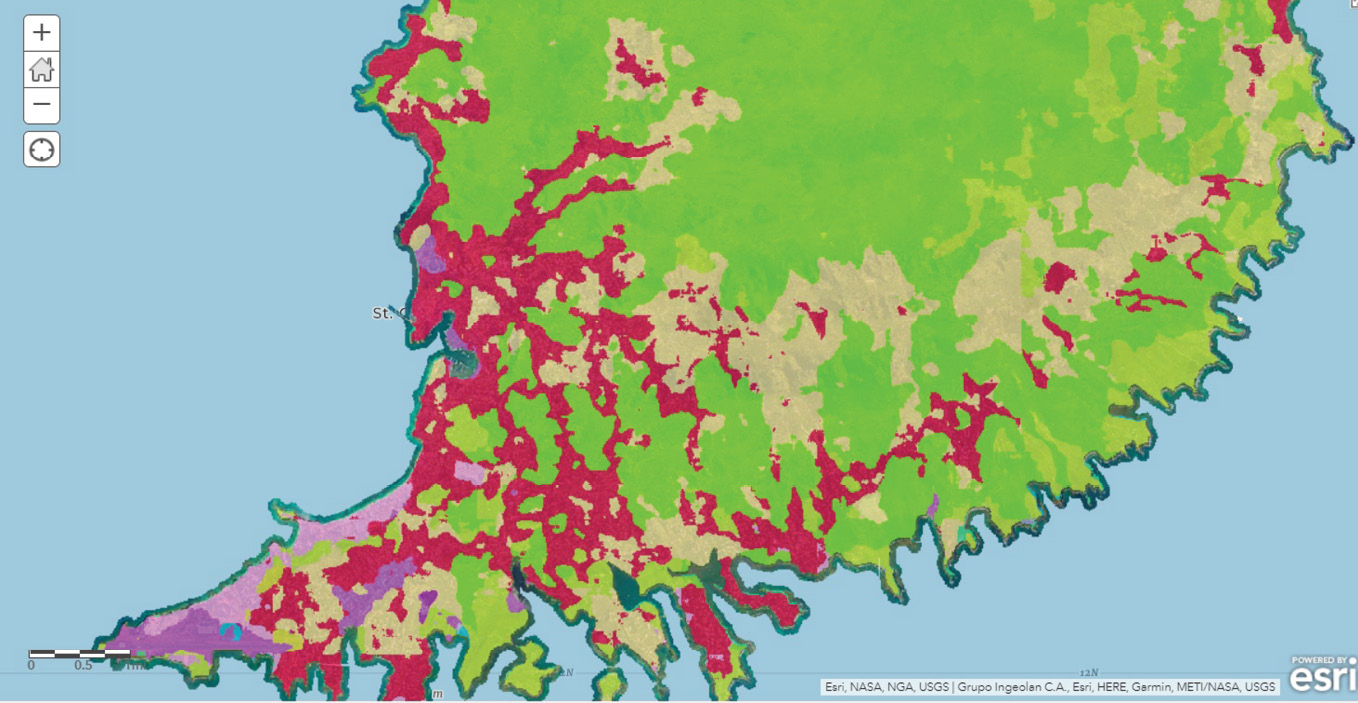
Land cover classified from the aerial imagery
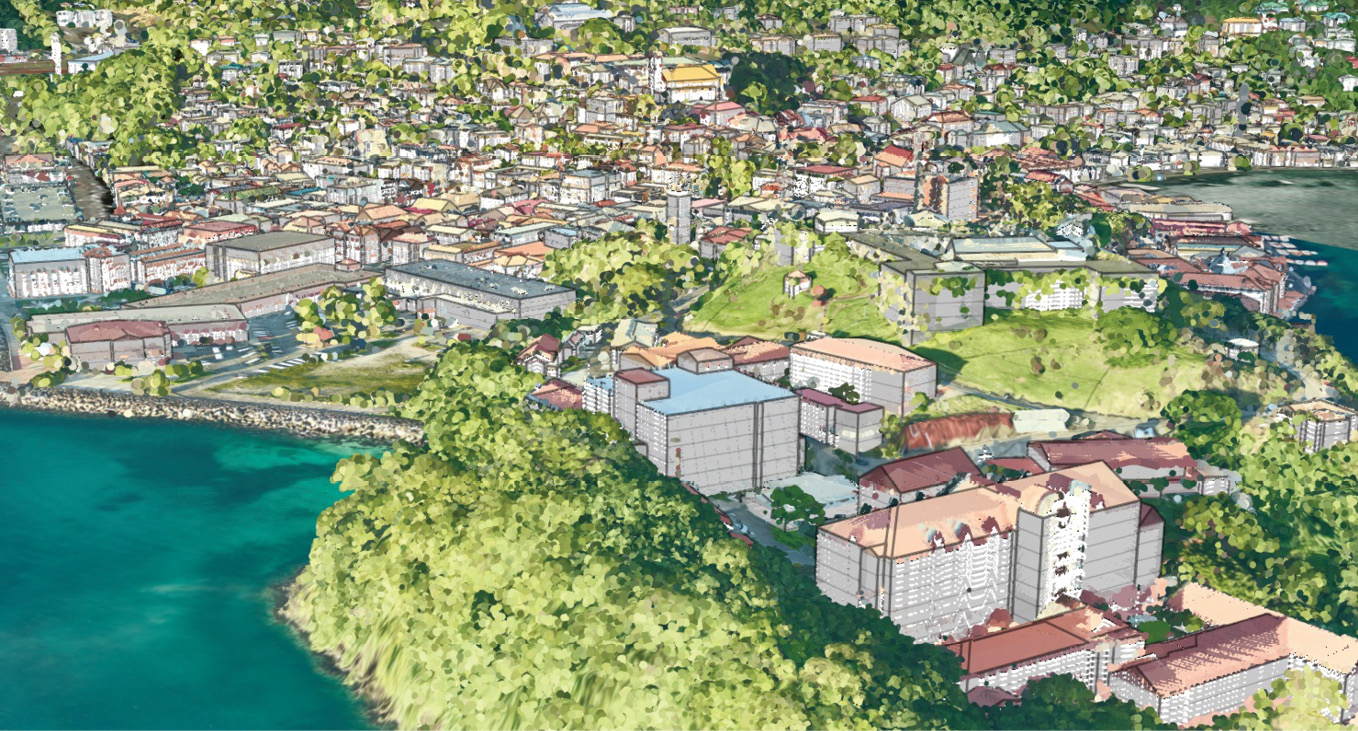
Digital twin for part of the island of Grenada, including 3D buildings extracted from lidar