This paper discusses research on a new and creative method of merging geospatial data from differing backgrounds and with varied accuracy specifications. The following topics are covered:
- Definition of project zones and identification of the data requirements for each zone
- Selection of zone-specific technology for data acquisition
- Steps for producing a hybrid product such as accuracy verification, data preparation and product development
- Case studies and project examples
We conclude that demand for geospatial data is increasing, and hybrid data fusion is among the best methods for producing accurate models. This requires considerable analysis, especially with respect to data accuracy, to ensure the correct approach is taken. Aside from providing evidence for the usefulness of emerging geospatial technologies in transportation projects, the benefits derived from the new hybrid product approach include cost and time savings, critical for clients with constrained budgets.
Background
Continuously declining construction project funding poses a great challenge for agencies attempting to finance new projects and/or maintain existing ones. With constrained budgets, many agencies struggle to meet their development objectives and are searching for creative ways to advance their projects. Recognizing clients’ need for survivability and resilience, Woolpert researched creative methods for enabling goal achievement under strict budgets.
As the capabilities of geospatial data acquisition technologies are refined over time, more products from different sensors can relate to each other in terms of data quality and accuracy—making it easier for project managers and engineers to seamlessly integrate different data sources into their projects.
The term data fusion, in a general sense, is used to describe the combination of available geospatial data and is practiced only as a reaction to an immediate need or incidental data finding. The data fusion discussed in this paper is different—it focuses on the early stages during project planning and design. It describes the proactive adaptation of a data evaluation strategy to stand on the synergy between disparate data sources, making these findings the pillars for project design and cost estimation.
Data specifications and project zoning
Today’s engineers and planners can use the concept of data fusion to design their projects, saving valuable resources while assuring the promised outcome. Woolpert has successfully executed projects containing varied geospatial data sources with multiple specifications acquired by different technologies, all merged to produce a seamless product that serves the planning and design phases.
Considering the requirements for planning, designing and engineering a transportation corridor (e.g., roadway construction or improvement), three types of data are needed for the project zones identified below.
Zone A: central region of the right-of-way
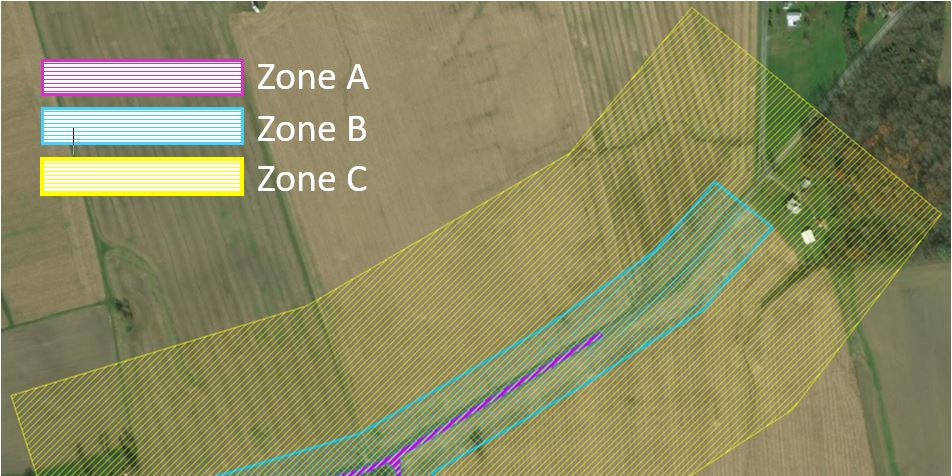
Figure 1: Zones A, B and C
Represented by Zone A (Figure 1), this part of the right-of-way (ROW) is dedicated to construction and maintenance of the main roadway and necessary outer roadways, entrances and crossroads. This area requires the most accurate geospatial data as it will be used for designing the road profile or improving the existing road. Traditionally, it is surveyed using traditional field surveying techniques, newly contracted aerial surveys with high-resolution imagery or helicopter-based dense lidar data, as well as through lidar-based mobile mapping systems (MMS) for road improvement.
Zone B: edges of the ROW
Represented by Zone B (Figure 1), the outer limits of the ROW are reserved for utility adjustments and maintenance activities. This area’s survey requires less accuracy than that of Zone A, but more than that of Zone C. Traditionally, this area is surveyed using standard field surveying techniques as it is not suitable for vehicular survey equipment like MMS.
Zone C: extended project basin
Zone C (Figure 1) is the area surrounding the corridor path where the drainage pattern is evaluated and a hydrological model is analyzed to determine the impact of the watershed hydrography on the corridor. Depending on the roughness of the terrain, less accurate data may be suitable. Traditionally, this area is surveyed using newly contracted aerialimagery or lidar.
Technological components
Three technologies are used for gathering data about the aforementioned project zones, listed below with their strengths and weaknesses.
MMS
MMS is a mapping system with a lidar sensor and multiple cameras positioned on top of a truck or van to provide 360°coverage of lidar data and imagery. MMS is the most efficient system for design-grade accuracy. It provides a detailed 3D surface (point cloud) with a density of up to 6000 points per square meter (PPSM) and a vertical accuracy that exceeds 1 cm root mean square error (RMSE). The weaknesses of MMS are its limited range (usually around 200 m), high cost and restriction to established roadways.
Unmanned aircraft system (UAS)
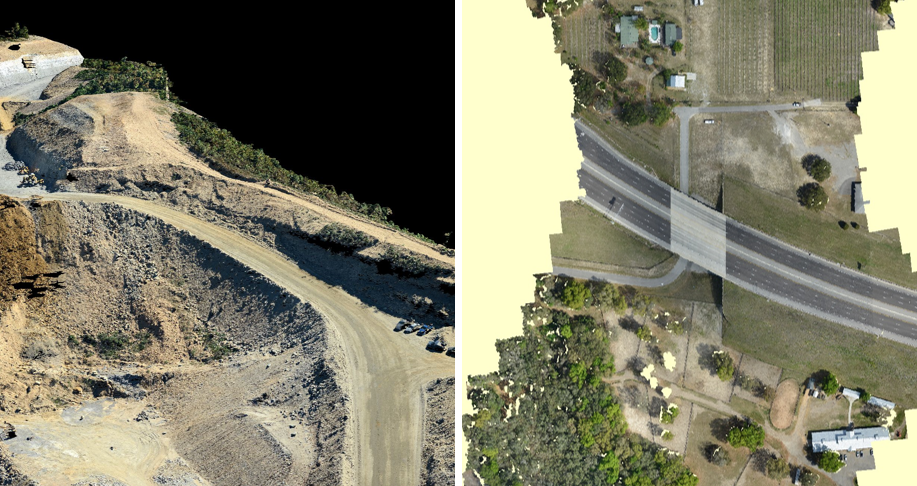
Figure 2: Imagery-derived, colorized 3D models
Although new, UAS is becoming an extremely versatile option for geospatial data acquisition. With the ability to carry lidar sensors and cameras on board, small UASs can provide high-resolution imagery ranging from 0.5- to 5-cm ground sample distance (GSD) and lidar data with point density ranging from 200 to 700 PPSM. UAS is a fine platform for data acquisition in zones A and B as it is a more affordable method than field surveying, MMS or even manned aircraft. UASs, however, are useful only for small projects and flying over non-participants is severely restricted by the Federal Aviation Administration (FAA). Additionally, due to the miniaturized sensors suited to this platform, the accuracy of the acquired data is compromised and may not be suitable for design-grade activities. This is exemplified in colorized 3D point clouds derived from a consumer-grade aerial camera like the one used by UAS (Figure 2).
Manned aircraft
Manned aircraft survey (lidar and imagery) is the industry workhorse for wide-area data collection. Lidar data and imagery acquired from sensors on board manned aircraft are available across the United States and, in most cases, are available free of charge and can be downloaded from county GIS offices. Nevertheless, it can be costly to hire personnel for small roadway improvement projects, and limited accuracy may not support design-grade activities.
Case Study I: Petersburg/Overman road intersection improvement
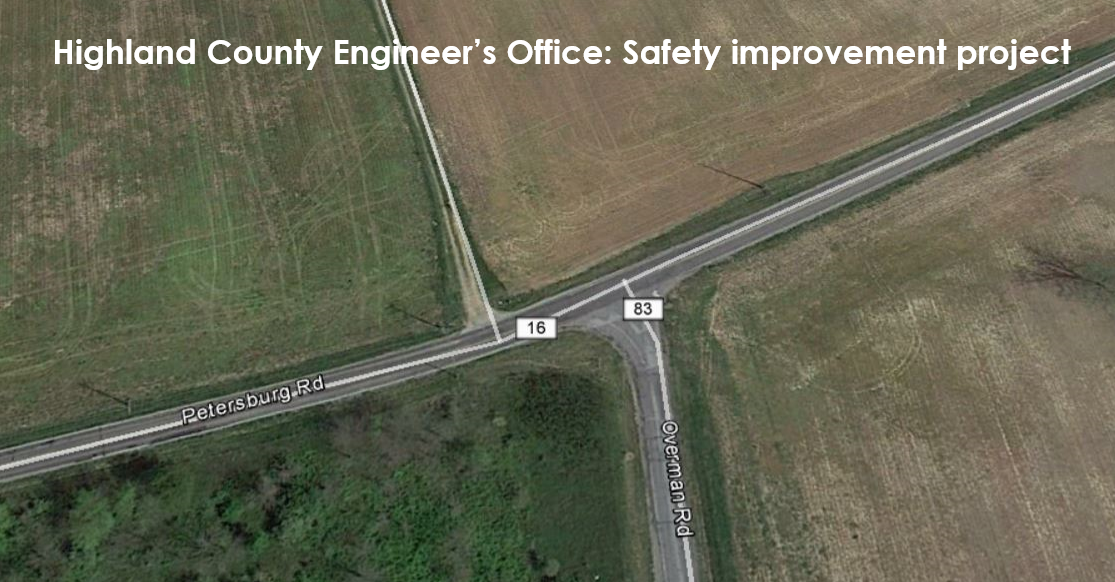
Figure 3: Petersburg/Overman Road intersection improvement
With the goal of improving the intersection of Petersburg and Overman roads in Highland County, Ohio, the data fusion approach was used for the project’s proof of concept (Figure 3). Woolpert used the following datasets:
- Point clouds from MMS for the road pavement (Zone A)
- Point clouds and imagery from UAS for the outer limit of the ROW (Zone B)
- Existing lidar data from Ohio Statewide Imagery Program (OSIP) for the area surrounding the corridor path (Zone C)
Point clouds from MMS (Zone A)
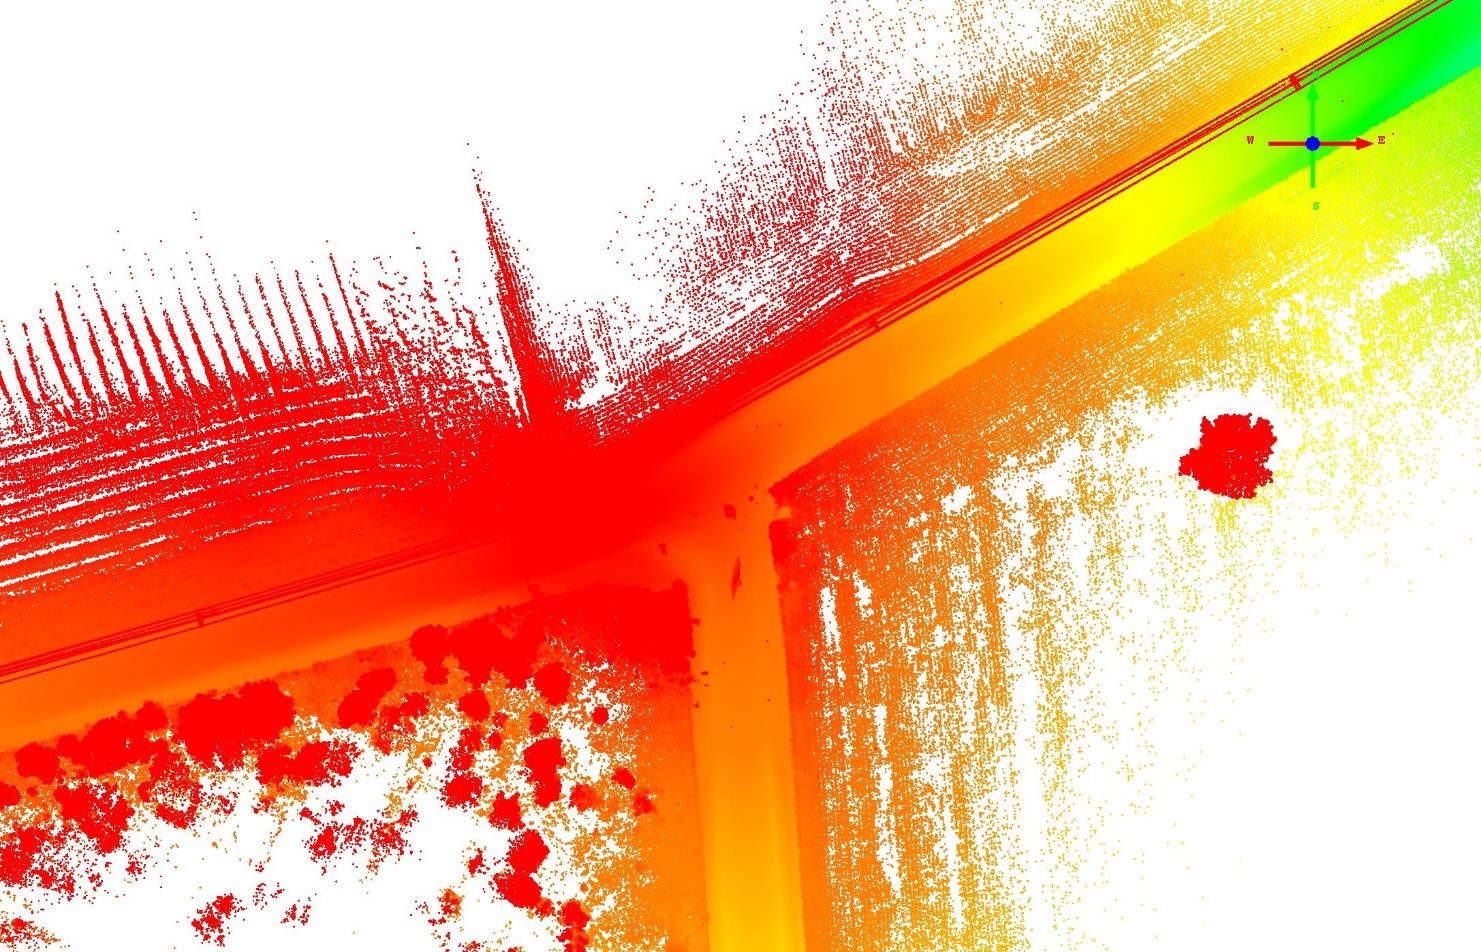
Figure 4: Point clouds from MMS (zone A)
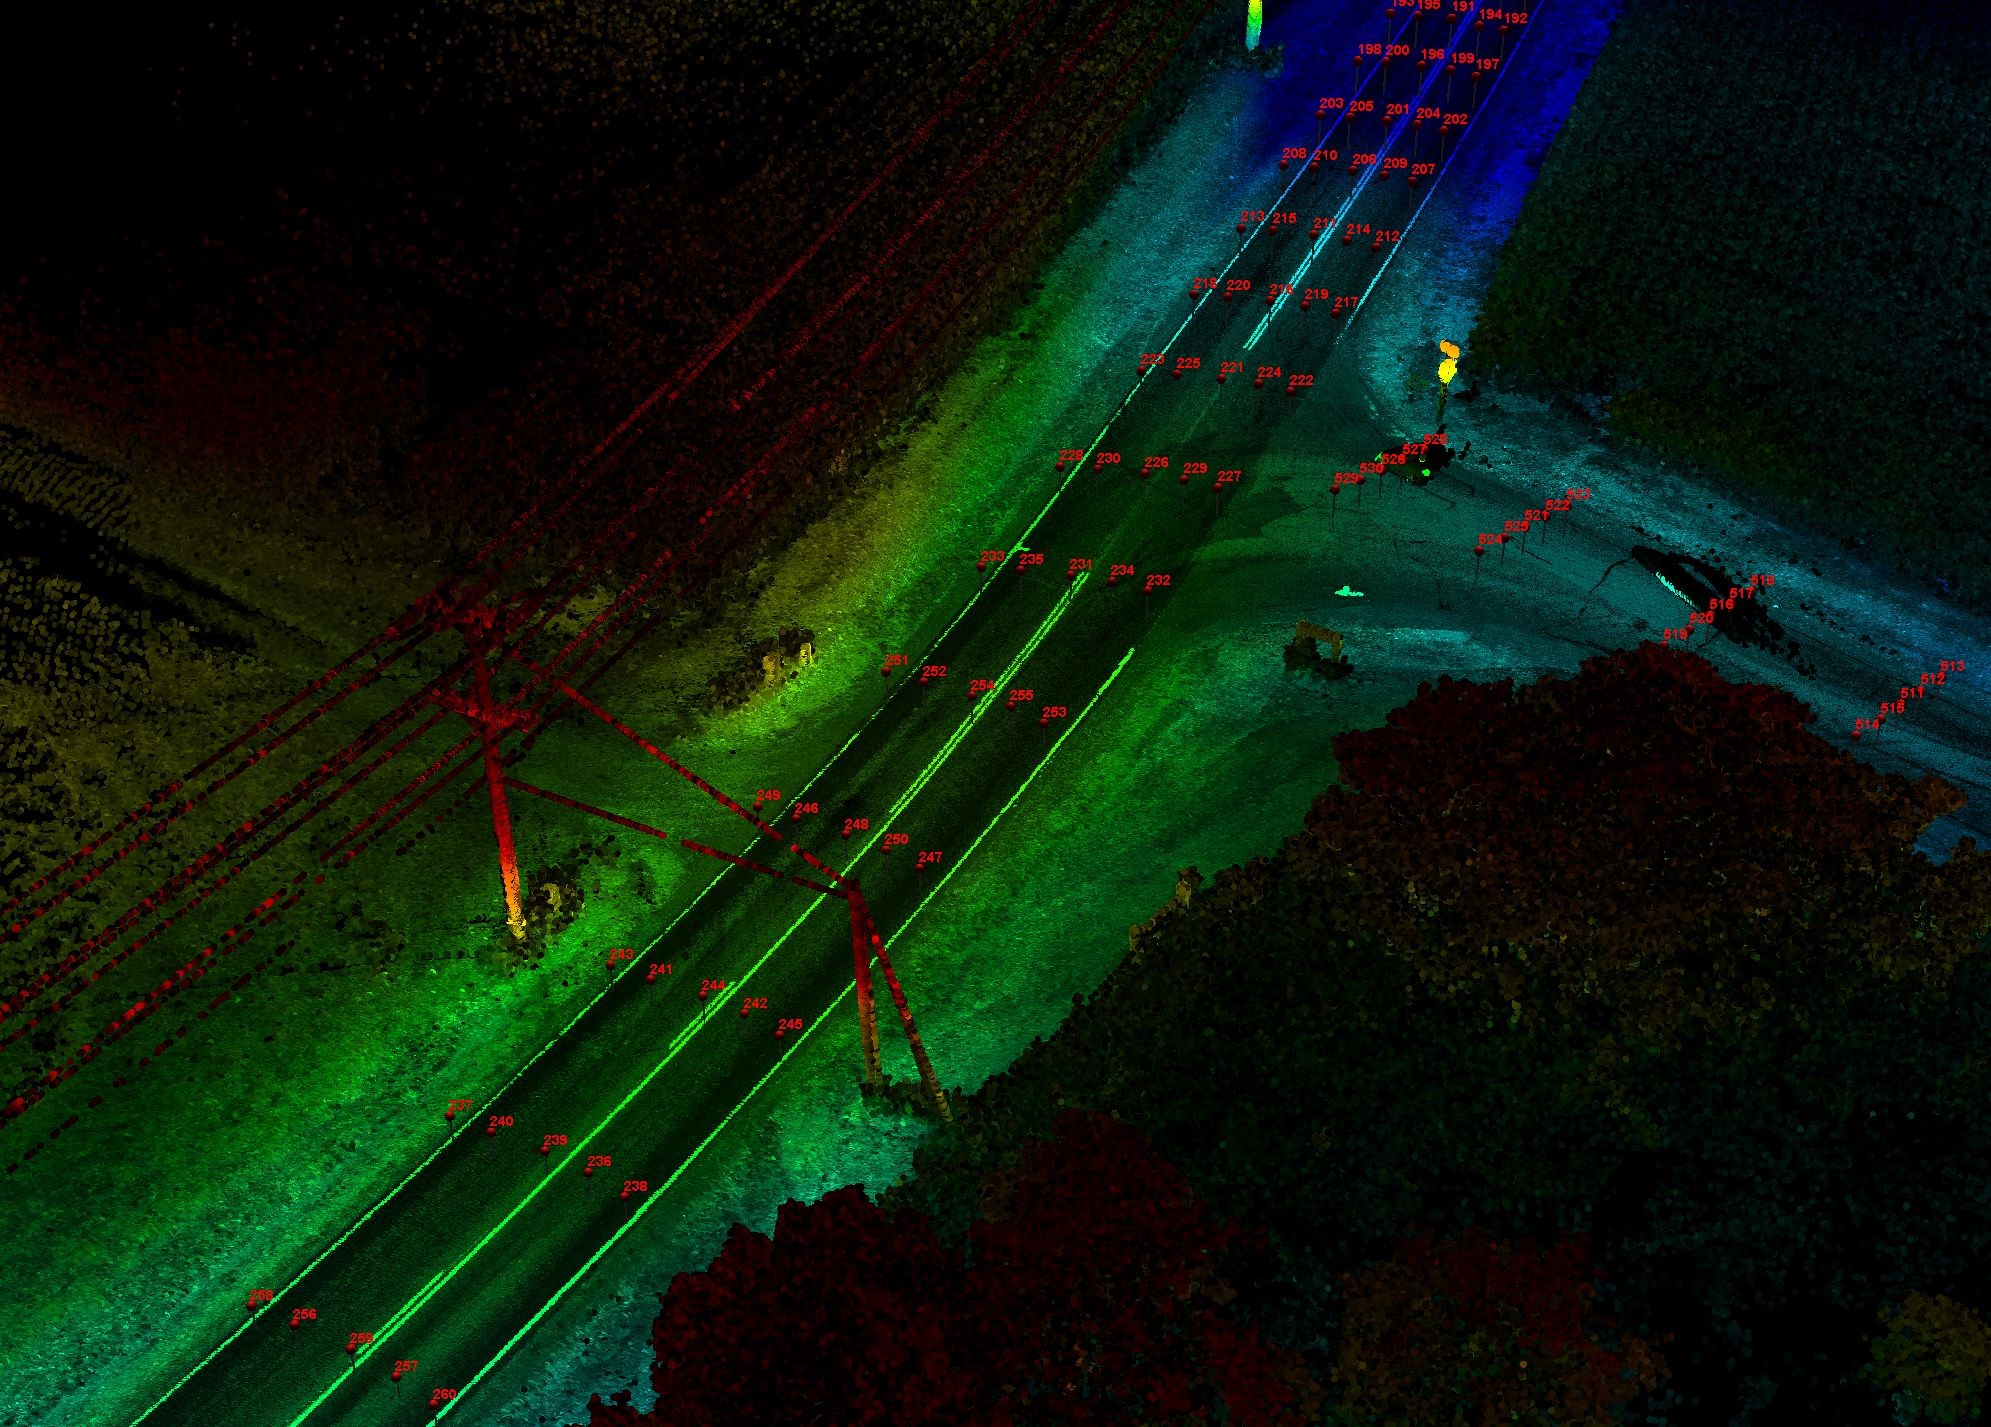
Figure 5: Point clouds from MMS (zone A) and the derived second-generation checkpoints
Woolpert had previously conducted an MMS survey for the local transportation agency. Figures 4 and 5 illustrate the MMS point clouds for a portion of that intersection.
Point clouds from UAS (Zone B)
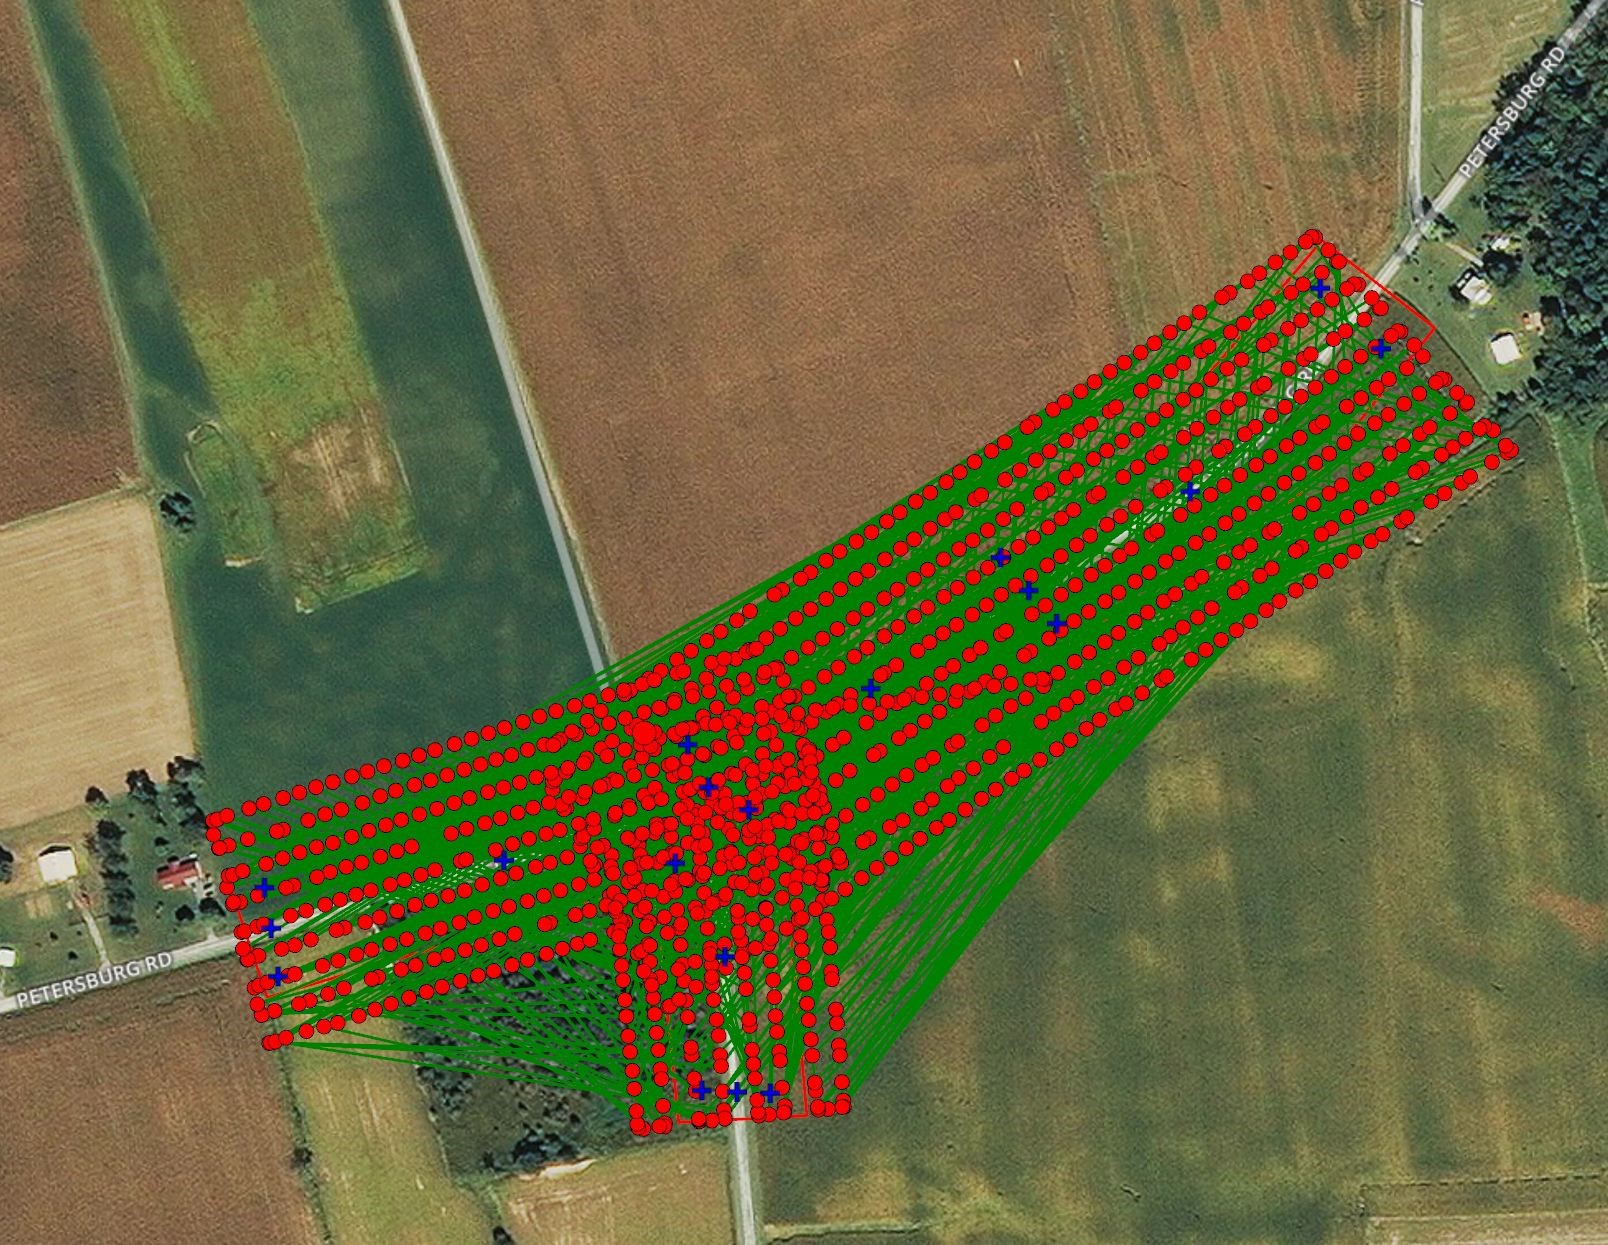
Figure 6: UAS image centers (red circles) and ground control points (blue crosses)
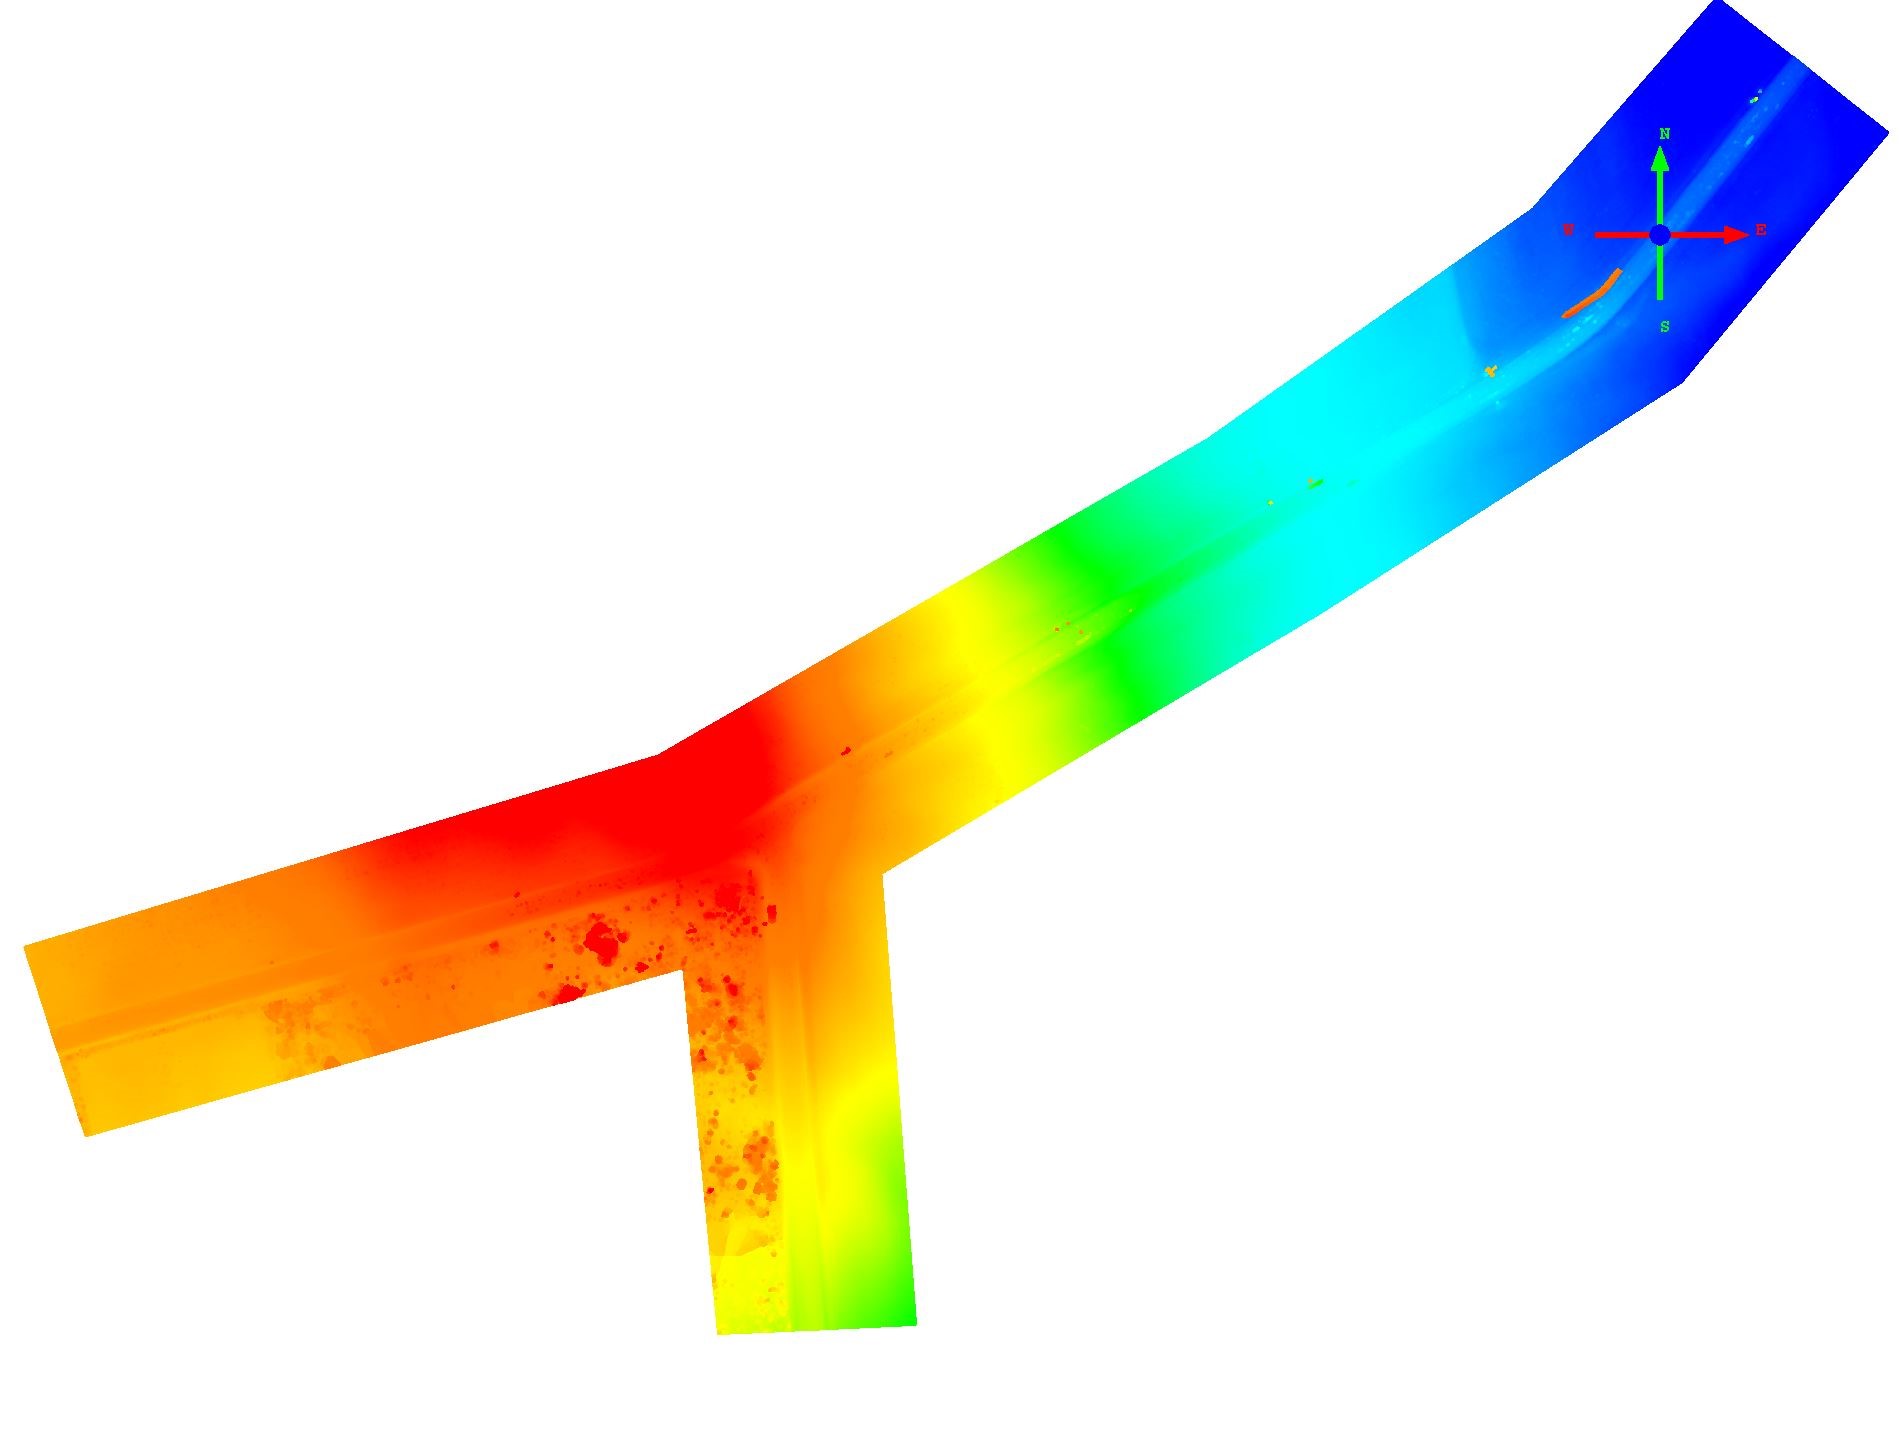
Figure 7: Point clouds generated from UAS imagery (zone B)
The project team flew the UAS at 100 feet above ground level (AGL). Figure 6 illustrates the UAS flight and the ground control points used to process the data. Imagery from the UAS flight was processed using Pix4D Mapper. Figure 7 illustrates the point clouds generated from this imagery.
Lidar point clouds from statewide mapping program (Zone C)

Figure 8: Lidar point clouds derived from OSIP (zone C)
Lidar data for Zone C was derived from OSIP and downloaded from the Ohio Geographically Referenced Information Program (OGRIP) website. Figure 8 illustrates the point clouds for this project area.
Processing steps for the hybrid digital surface model (DSM) product
Stringent workflows should be followed when merging data to produce the hybrid DSM product. Below are the main steps for data processing:
- Accuracy verification
- Data preparation
- Product development
Accuracy verification
One of the most important activities is verifying the positional accuracy for each product used in the generation of the hybrid product. Different products used for the hybrid DSM may have different accuracies; however, such accuracies must be independently verified and documented in the metadata of the new hybrid product.
Accuracy verification of MMS data
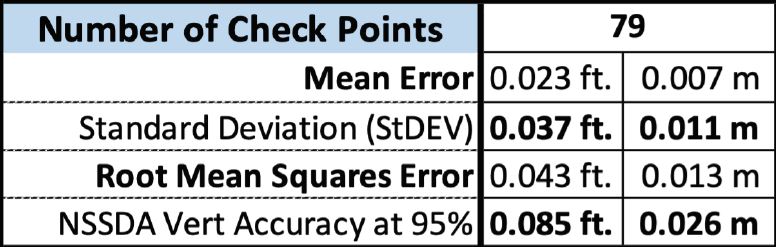
Table 1: Accuracy verification results for MMS data (zone A)
Positional vertical accuracy for the MMS data was verified using 79 checkpoints surveyed with traditional differential leveling techniques. Table 1 lists these results: the MMS data was accurate to 0.043 feet (0.013 m).
Accuracy verification of UAS data
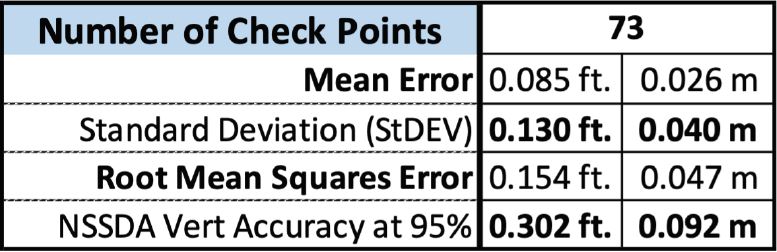
Table 2: Accuracy verification results for the imagery-based DSM data, using surveyed checkpoints
Positional vertical accuracy for the UAS-derived DSM data was verified by two methods. Initially, 73 checkpoints were surveyed with traditional differential leveling techniques. Table 2 lists these results: the imagery-derived DSM was accurate to 0.154 feet (0.047 m) with respect to the MMS data from Table 1, which the team proved accurate to 0.043 feet (see above).
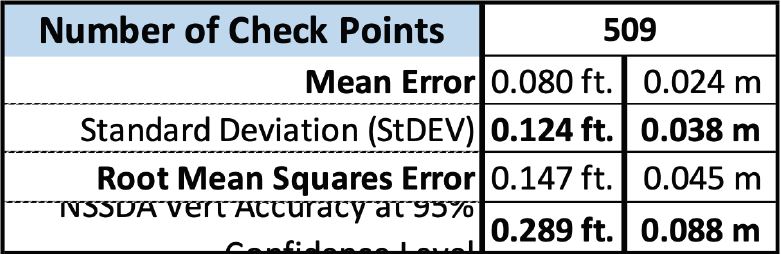
Table 3: MMS data-derived accuracy verification results for imagery-based DSM data
Unlike a limited number of surveyed checkpoints, the MMS data for this type of accuracy verification provided an extensive and well-distributed network of checkpoints. In the mapping industry, this approach is usually referred to as the second-generation checkpoint approach. Elevations of 509 locations along the road, grouped in sets of five points per cross-section, were derived from the MMS DSM (Figure 5). These 509 points were used as checkpoints to verify the accuracy of the imagery-based DSM. Table 3 lists these results: the imagery-based DSM was within 0.147 feet (0.045 m) of the MMS data.
Accuracy verification of OSIP lidar data
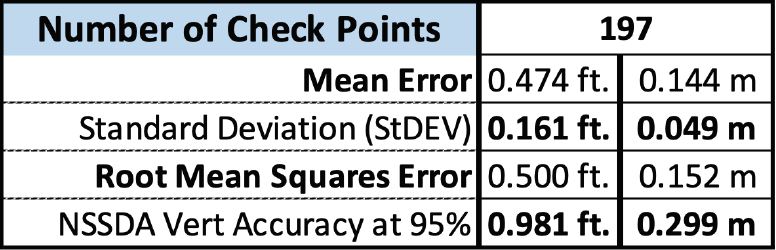
Table 4: Accuracy verification results for OSIP lidar data
A total of 197 surveyed checkpoints located within Zone C were used to verify the vertical accuracy of lidar data from OSIP. The metadata for the downloaded lidar data states the vertical accuracy to be 0.5 feet (15 cm), which was verified using the 197 checkpoints in Table 4.
Data preparation
Once the project team verified the vertical accuracy of the various datasets, data processing preparations began. Data may need some, or all, of the following processing before it is merged:
- Reformatting
- Reprojecting
- Clipping and cropping
After the necessary reformatting and reprojection were completed, the data went through the following steps:
- Clip MMS data to represent only roads and pavements for Zone A (Figure 9)
- Clip UAS-based data to represent Zone B only (Figure 10)
- Clip OSIP lidar data to represent Zone C only (Figure 11)
- Merge OSIP lidar and UAS-based DSM (Figure 12)
- Merge MMS lidar, OSIP lidar and UAS-based DSM to form a seamless dataset and hybrid DSM (Figure 13).
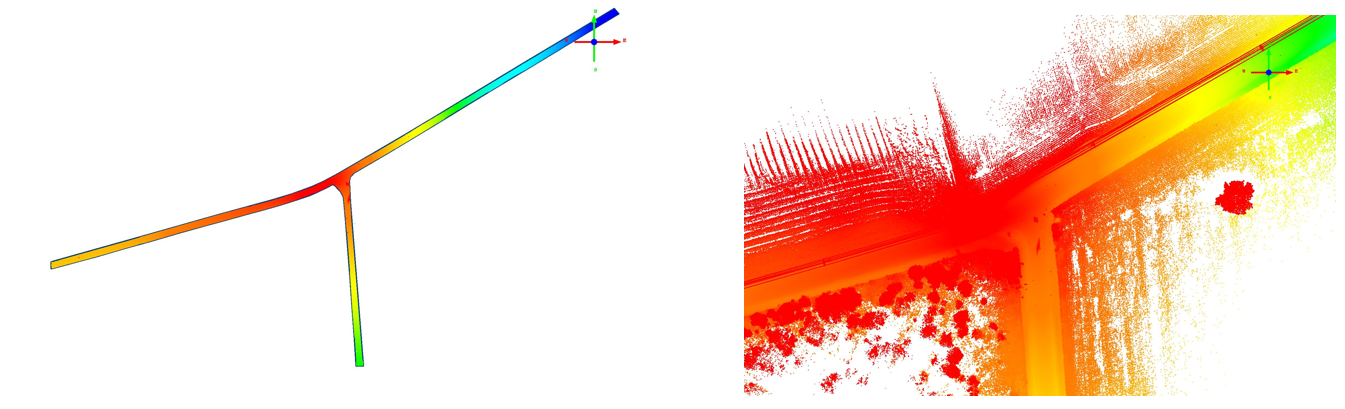
Fig. 9
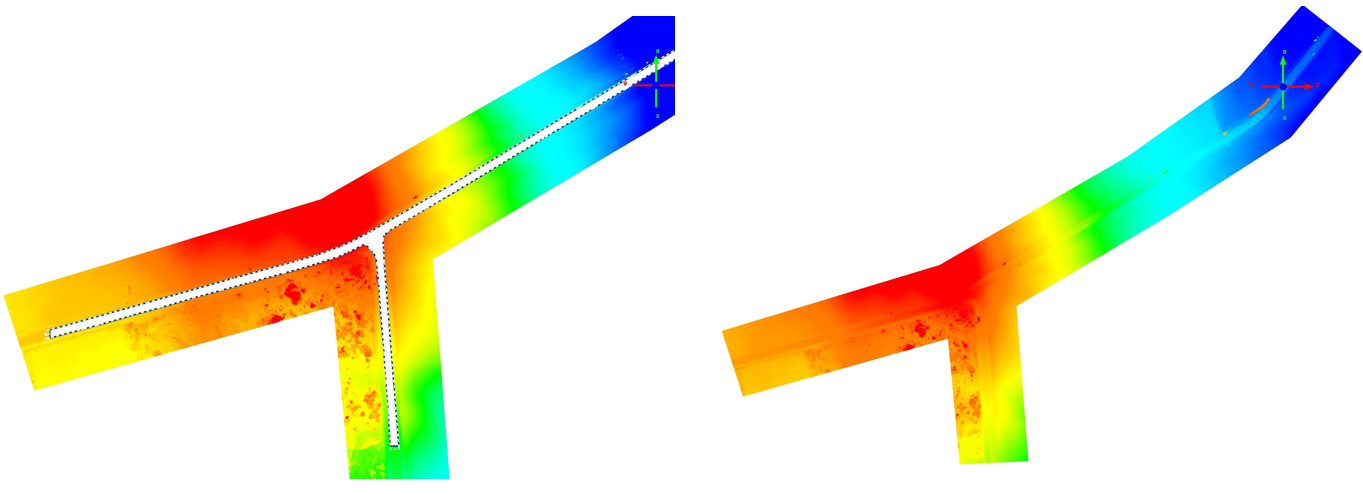
Fig. 10

Fig. 11
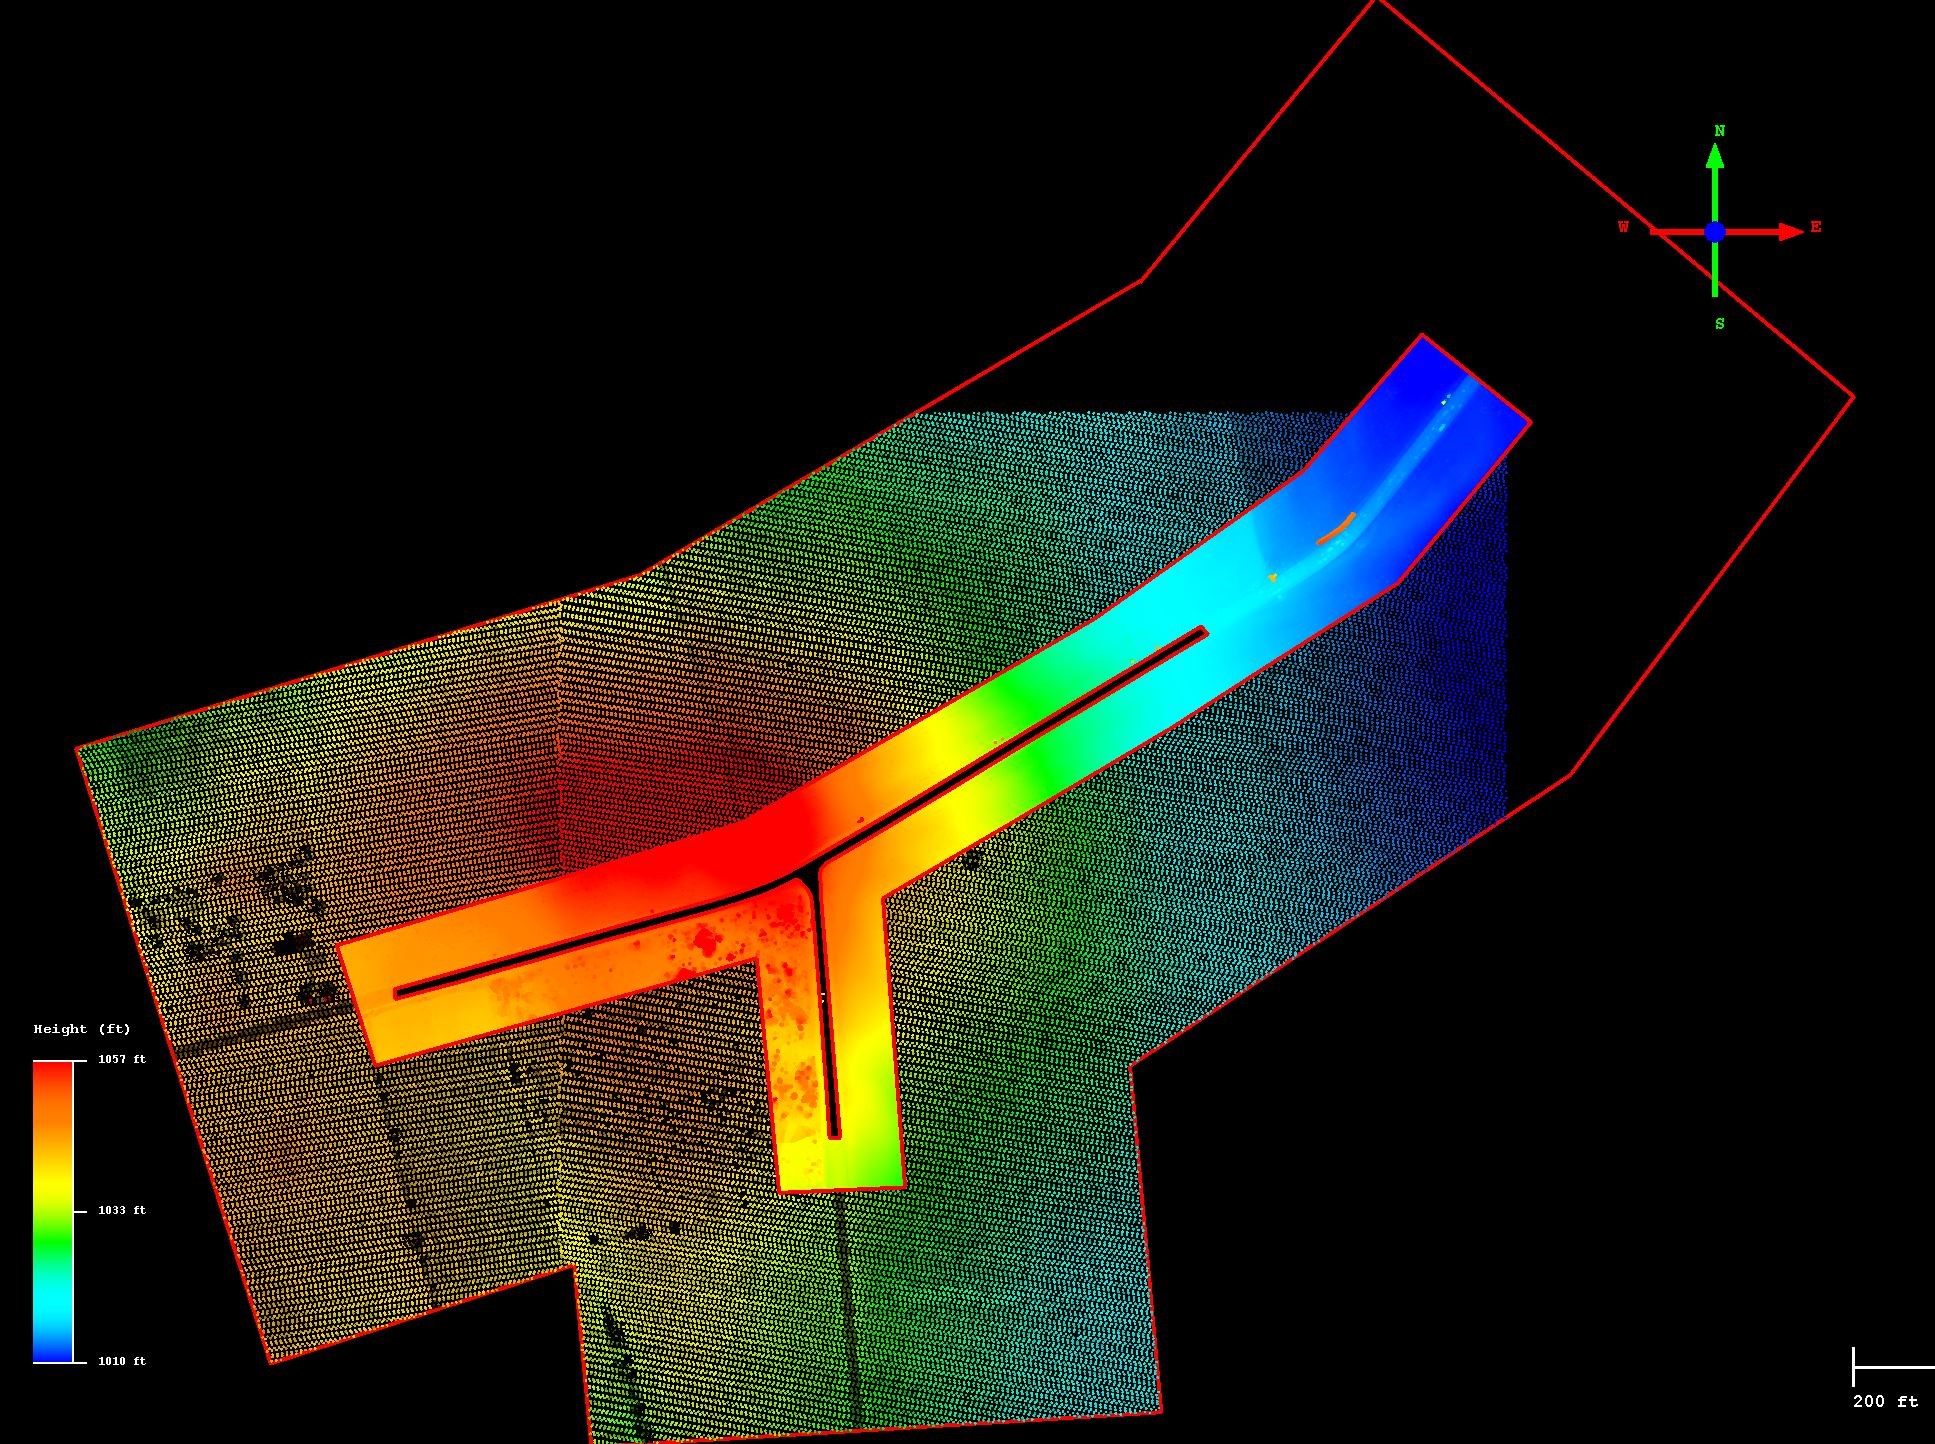
Fig. 12
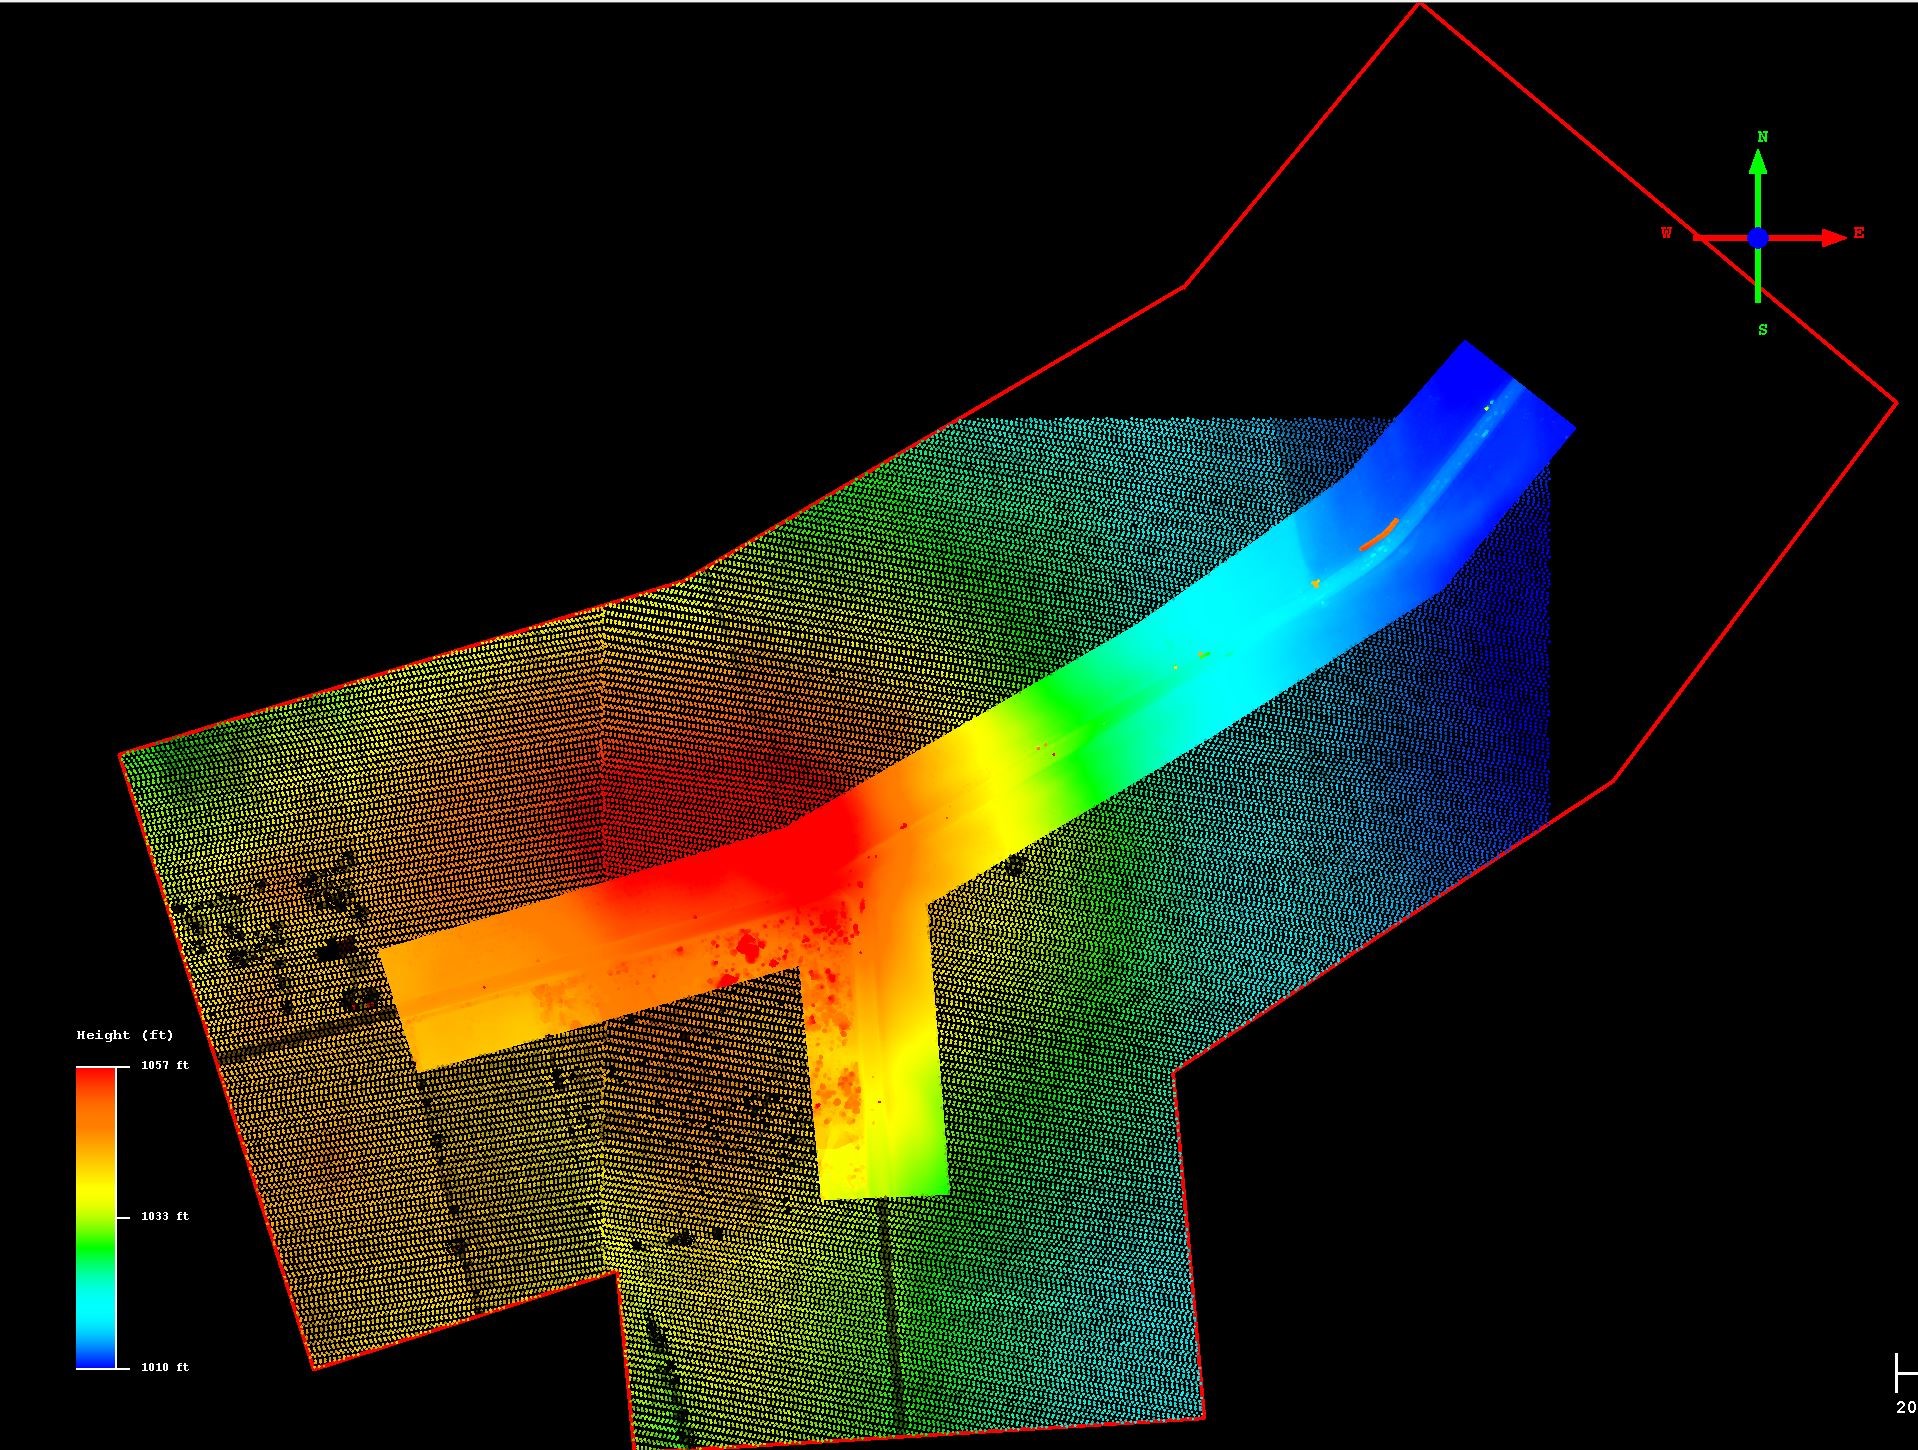
Fig. 13
Product development and final deliverables
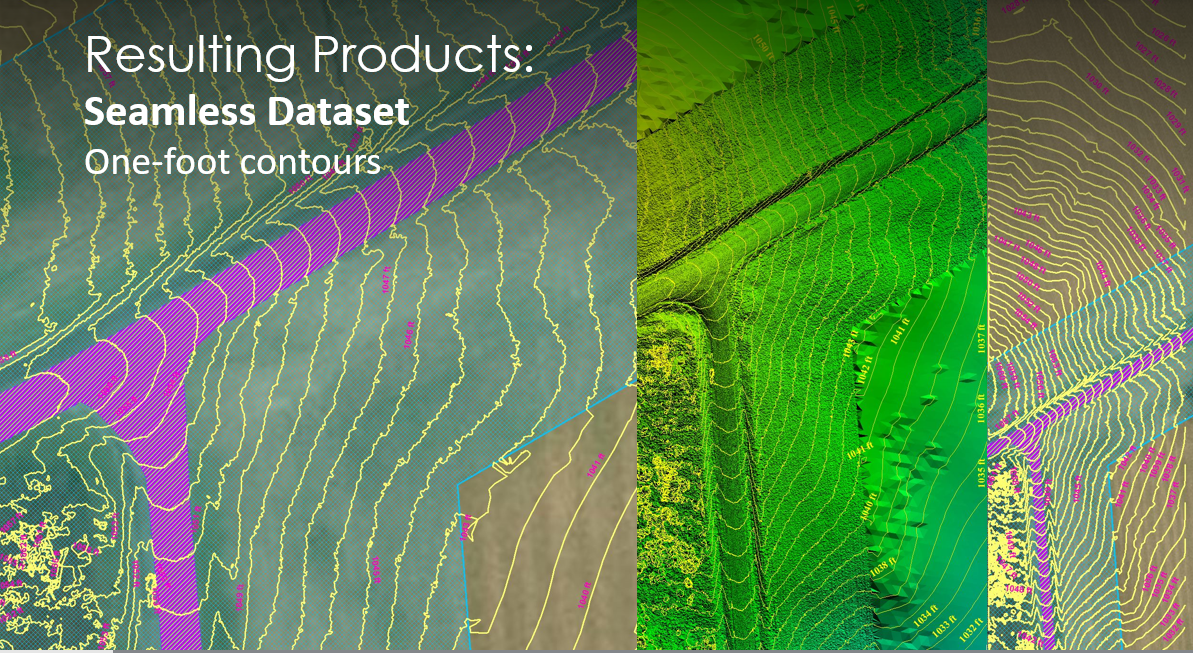
Figure 14: Seamless one-foot contours created from the hybrid DSM
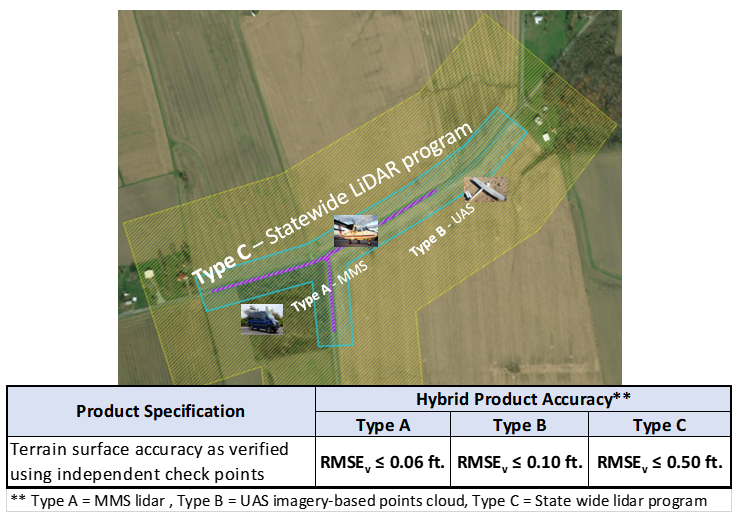
Figure 15: Labeled metadata associated with the hybrid DSM
After the different datasets were merged, various products could be derived for planning and design activities. Figure 14 represents one-foot contours generated from the new hybrid DSM. Although the merged datasets appear as if they are one dataset, the data within each of the three zones (A, B and C) have different accuracies and should be labeled as such in the metadata (Figure 15).
Case Study II: UAS proof of concept for PennDOT
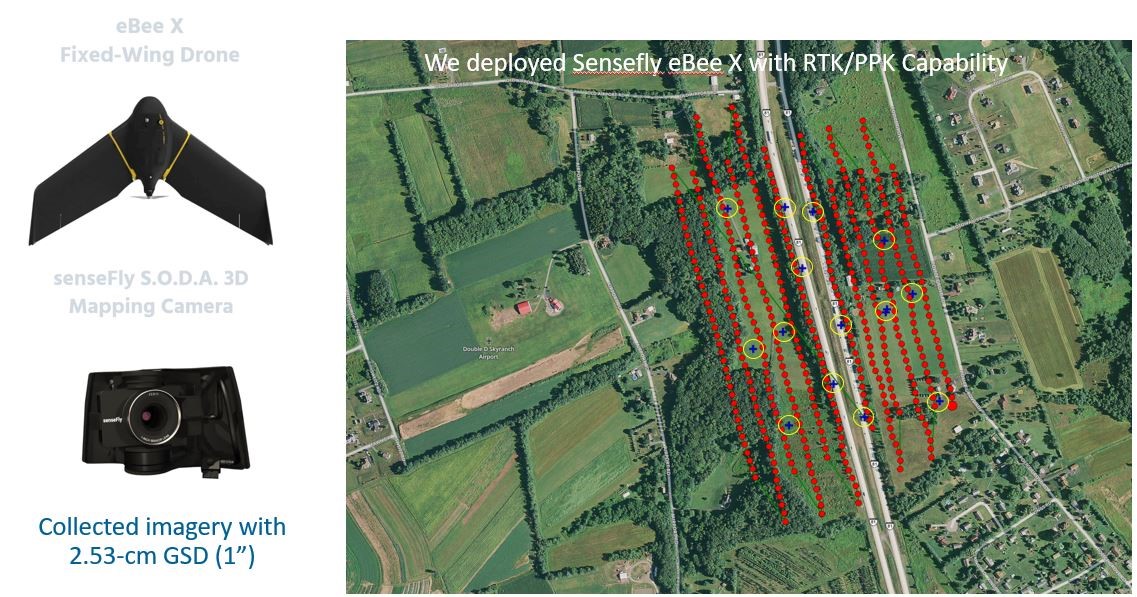
Figure 16: eBee X RTK UAS flight plan and ground control points
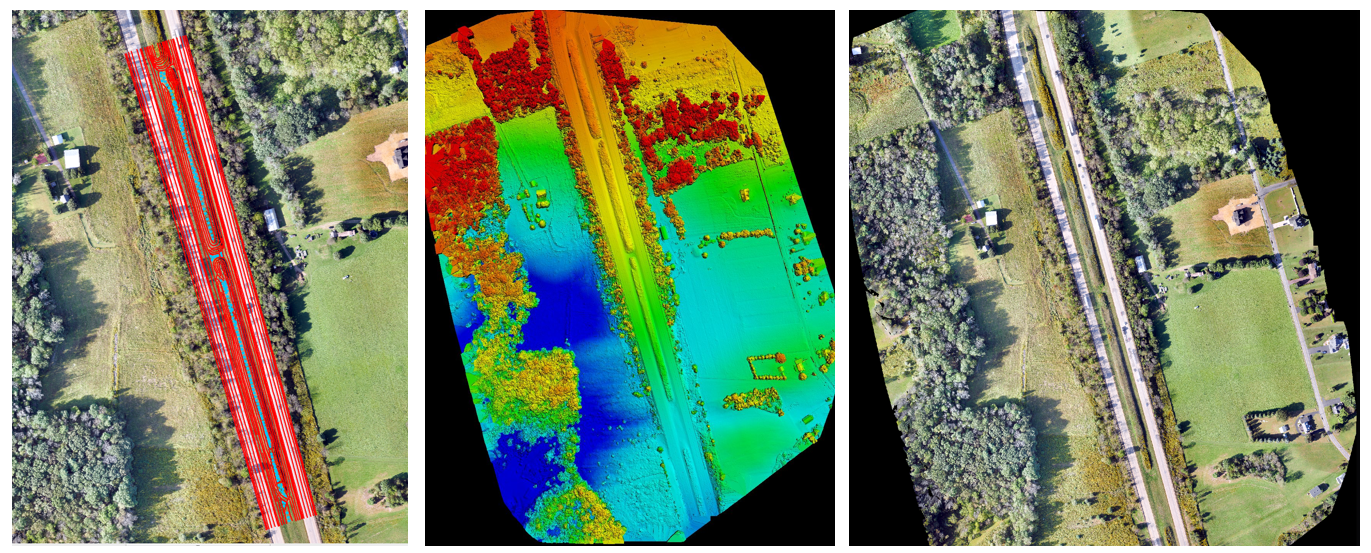
Figure 17: Products generated from UAS imagery (left: DTM; middle: point cloud; right: orthorectified mosaic)
Woolpert acquired data using an eBee X RTK UAS to investigate its usefulness in supporting road design activities (Figure 16). The project team had previously acquired MMS data and 7.5-cm imagery using a manned aircraft for section 35 of SR80 to fulfill a contract requirement with Pennsylvania Department of Transportation (PennDOT). Imagery collected using the eBee X was used to generate the following products (Figure 17):
- Orthorectified mosaic with 2.5-cm GSD
- Imagery-based point clouds
- Digital terrain model (DTM)
The DTM was created photogrammetrically: the stereo pairs from UAS-based imagery were used to collect the DTM for the two bounds of the freeway. The stereo pairs met the high quality expected for photogrammetric mapping with no reported parallax.
Accuracy verification
The vertical accuracy of the photogrammetrically derived DTM was verified using the following datasets:
MMS data

Figure 18: Bias in the photogrammetric DTM
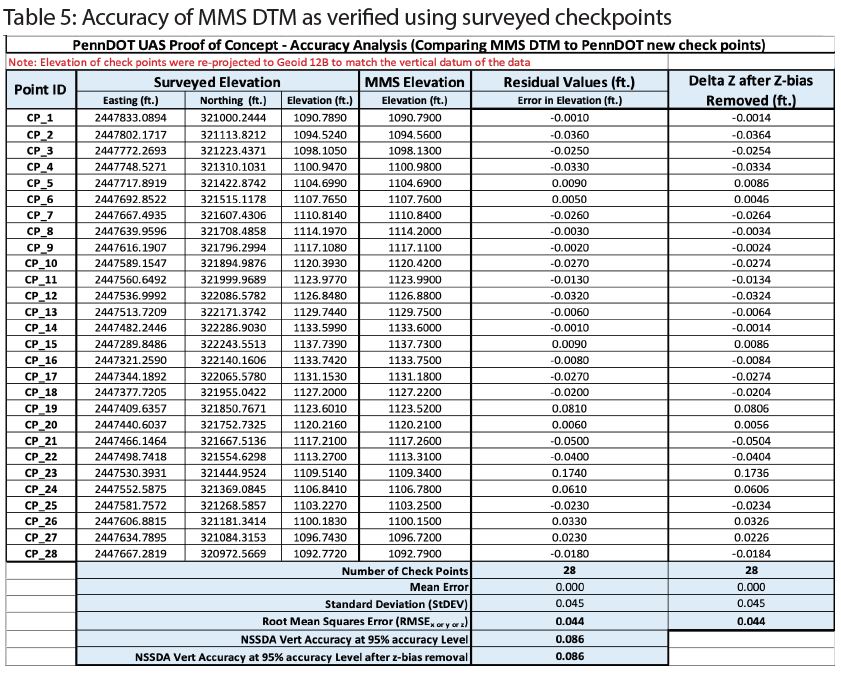
Table 5: Accuracy of MMS DTM as verified using surveyed checkpoints
Although the vertical accuracy is limited, lidar point clouds from an accurate MMS survey can be used to verify products derived photogrammetrically. Using the accuracy verification concept introduced in the first case study, the MMS data accuracy should be verified before it is used to verify the accuracy of any other dataset.
PennDOT staff surveyed 28 independent checkpoints along the two sides of the highway using traditional leveling techniques (Figure 18). These highly accurate checkpoints were used to verify the accuracy of the MMS data. Table 5 lists the results, showing the vertical accuracy of the MMS data to be around 0.044 feet (0.013 m).

Table 6: Vertical accuracy of UAS-based DTM as verified using MMS data
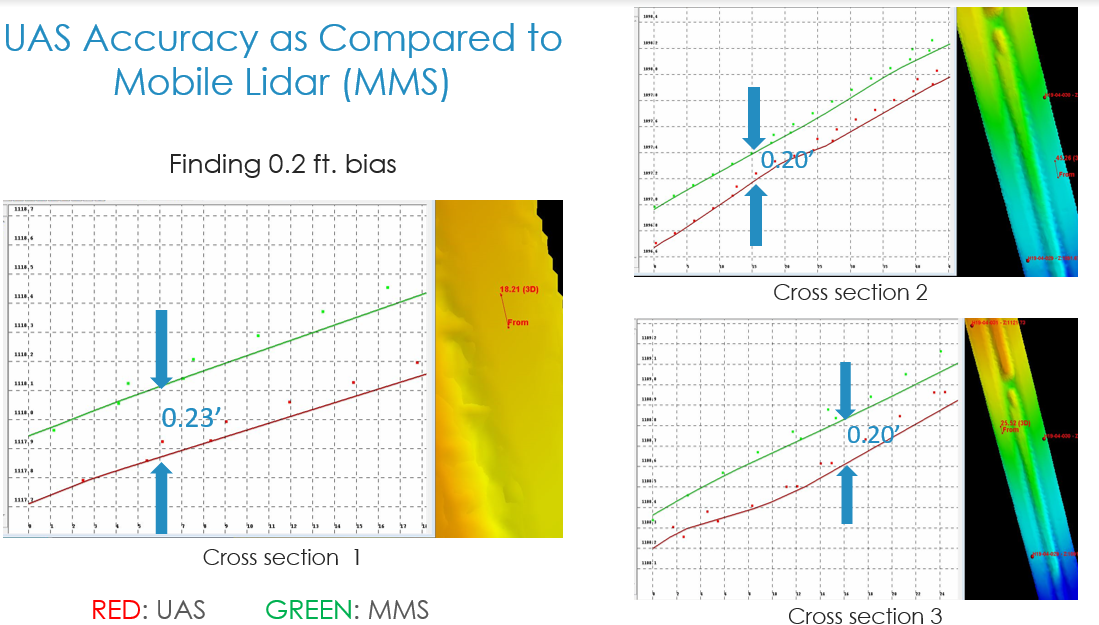
Figure 19: Checkpoint locations along SR80
To compare the accuracy of the compiled DTM against the MMS data, elevations for the 28 checkpoints were derived from the MMS data (Figure 18). Table 6 lists the results of these evaluations. It is evident that the UAS-based DTM had a vertical bias of around 0.224 feet. Once the bias is removed, the vertical accuracy of the UAS-based DTM was around 0.080 feet (0.025 m). Such vertical bias is clearly seen in the profiles taken along the road (Figure 19).
Surveyed checkpoints
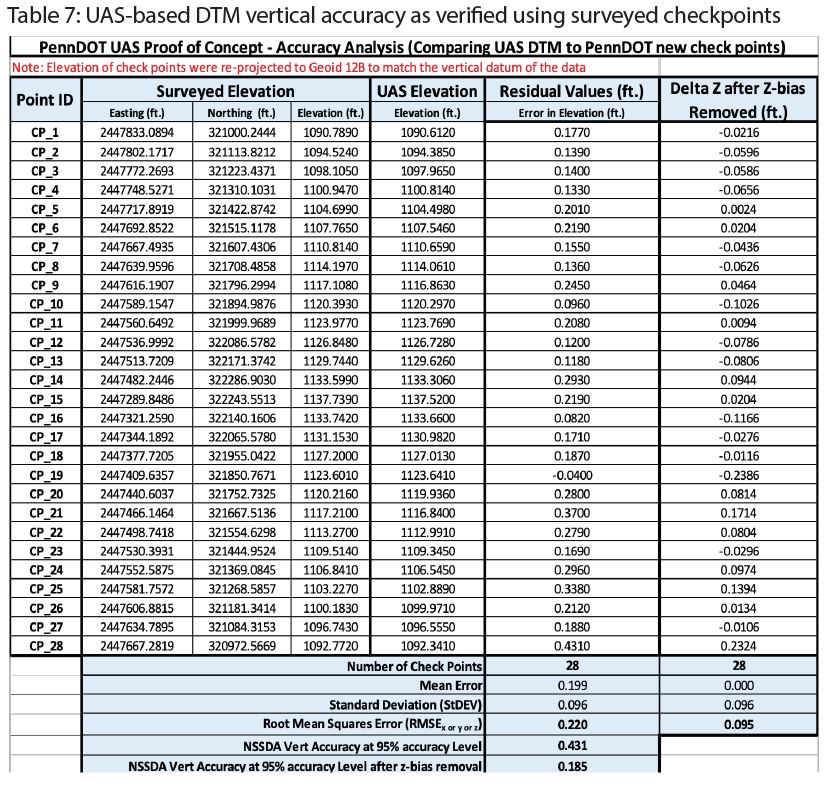
Table 7: UAS-based DTM vertical accuracy as verified using surveyed checkpoints
Table 7 lists the results of evaluating the UAS-based DTM using the independent checkpoints from PennDOT (Figure 18). Again, the surveyed checkpoints clearly verify the existence of the vertical bias in the UAS-based DTM as it was revealed by the MMS data. Once the bias is removed from the data, the vertical accuracy of the photogrammetric DTM was found to be around 0.095 feet (0.029 m), which is in a close agreement with the MMS verification method.
Once the vertical bias is removed from the data, the accuracy results from the MMS-derived checkpoints align with those from the field-surveyed checkpoints. This agreement is a clear indication that MMS data is as accurate as the field-surveyed checkpoints.
Vertical biases are common in lidar data and can be estimated and removed as long as accurate ground control points are available within the project areas. Different from random errors, biases are systematic errors of a mathematical nature that can be modeled and removed from the data with the help of ground control points.
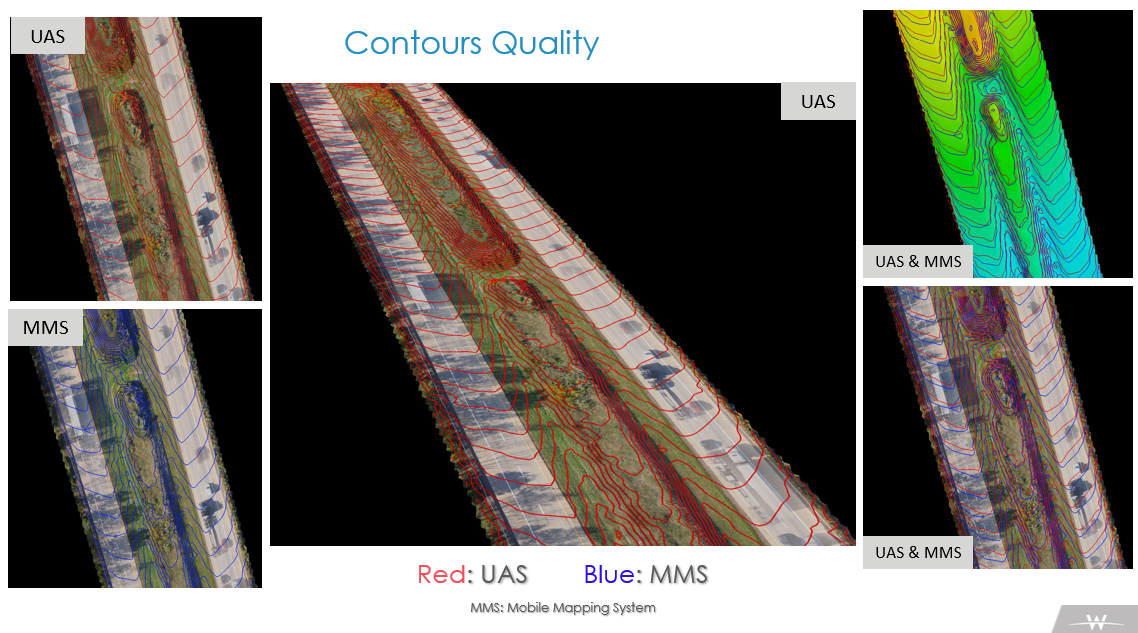
Figure 20: One-foot contours generated from MMS and stereo UAS imagery
Additional verifications were performed by comparing the photogrammetric DTM to the DTM derived from MMS data. Contours generated from both technologies align horizontally and vertically within few tenths of a foot (Figure 20).
Conclusions
As geospatial data quality and georeferencing are better defined and refined, fusing geospatial datasets derived from different sources becomes a routine matter. Users of geospatial data can reap the benefits of this reality. With demand for digital twins on the rise, geospatial data fusion is an ideal solution for providing seamless 3D models for projects and their surrounding areas.
The above case studies demonstrate successful attempts to fuse different geospatial data to produce new, hybrid geospatial products with more potential to serve engineering projects than any of the individual components used in producing the final product. Combining disparate data sources requires careful communication about the data sources and data. Users must be aware that the hybrid product may have multiple accuracy levels depending on the data sources used in the generation of the new hybrid product. This can safely be accomplished through the metadata, which needs to be closely attached to the new product.
This new approach is far more economical than current practices, as it leverages existing data and enables effective utilization of UAS as an acquisition platform. Public-domain geospatial data is increasingly available from state and county GIS websites. It provides tremendous relief to project budgets and schedules, and in most cases can be obtained instantaneously and free of charge.
In addition, this research proved that stereo pairs from UAS-based imagery can be used to support design-grade surveys for road engineering, assuming the UAS mission is planned and executed properly. UAS can be used in permissible areas (off roads and away from populated areas according to FAA regulations) to provide cost-effective products and replace countless hours of labor-intensive field surveying.
Finally, emerging geospatial technologies such as UAS are effective in serving transportation projects to help reduce costs and expedite delivery schedules. Using different technologies to serve projects with diverse specifications and requirements is the most efficient way to execute transportation projects as the hybrid approach contributes to better efficiency and resource utilization. Accuracy on demand within a project is a logical outcome of the hybrid approach.