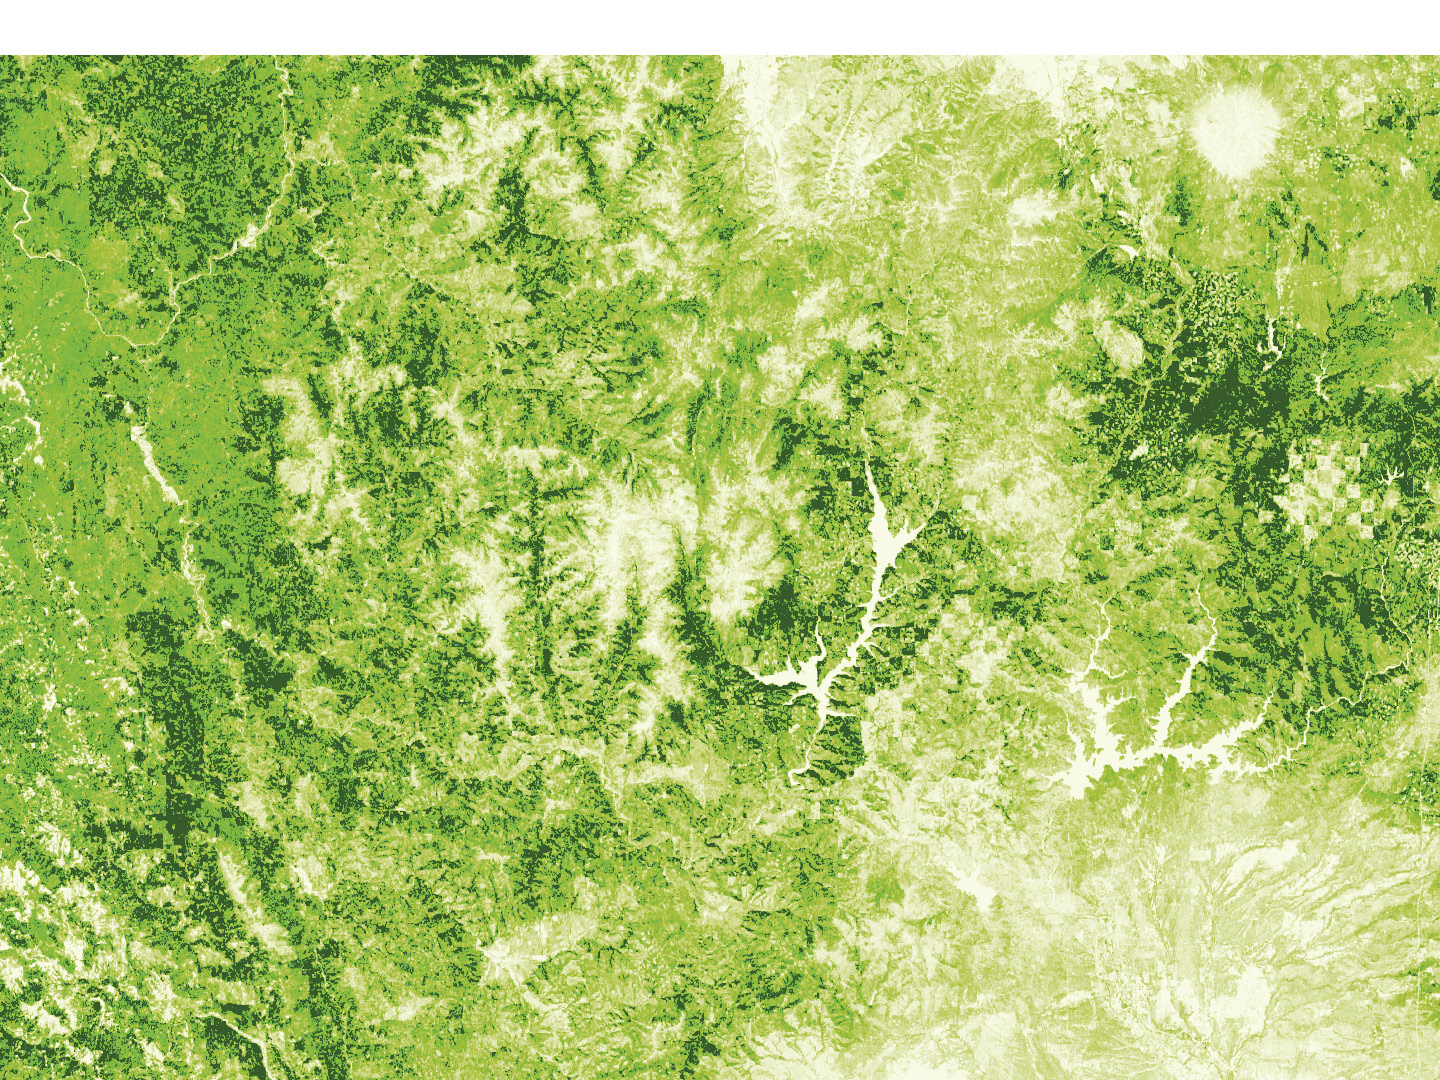
Tree height mapped over Northern California using data from the California Forest Observatory. Darker greens indicate taller trees.
I suspect I have a sympathetic audience in these pages when I state that lidar is a premier technology for forest mapping and vegetation management. Building on decades of research and sensor development, new methods for mapping forest carbon dynamics—from terrestrial1, airborne2 and spaceborne3 instruments alike—are helping scientists and governments monitor the stocks and flows of carbon in order to plan climate change mitigation projects. In the private sector, it’s also one of several technology platforms behind the precision forestry revolution4, driving efficiency gains throughout the timber sector supply chain. And, living up to its reputation as a swiss-army-knife technology, lidar is increasingly being deployed to map the vegetation fuel loads that drive wildfire behavior.
Vegetation interacts with light in many ways—absorbing some for photosynthesis, reflecting some as photoprotection, and transmitting the rest to the understory—and these interactions change across wavelengths. At the wavelength of infrared energy emitted by many lidar scanners (1064 nanometers), leaves reflect and transmit light in a nearly 50/50 split, absorbing little to no energy. This means that, from airborne platforms, lidar pulses can transmit through dense forest canopies and measure energy reflected from mid-canopy branches, understory plants and the forest floor, constructing rich, 3D measurements of canopy vertical structure. This is often done by converting discrete return data into pseudo-waveforms (Figure 1). Pseudo-waveforms group all the points along vertical intervals within a voxel (a 3D volumetric pixel) and normalize by the density of points to construct a dataset that approximates raw lidar waveforms.
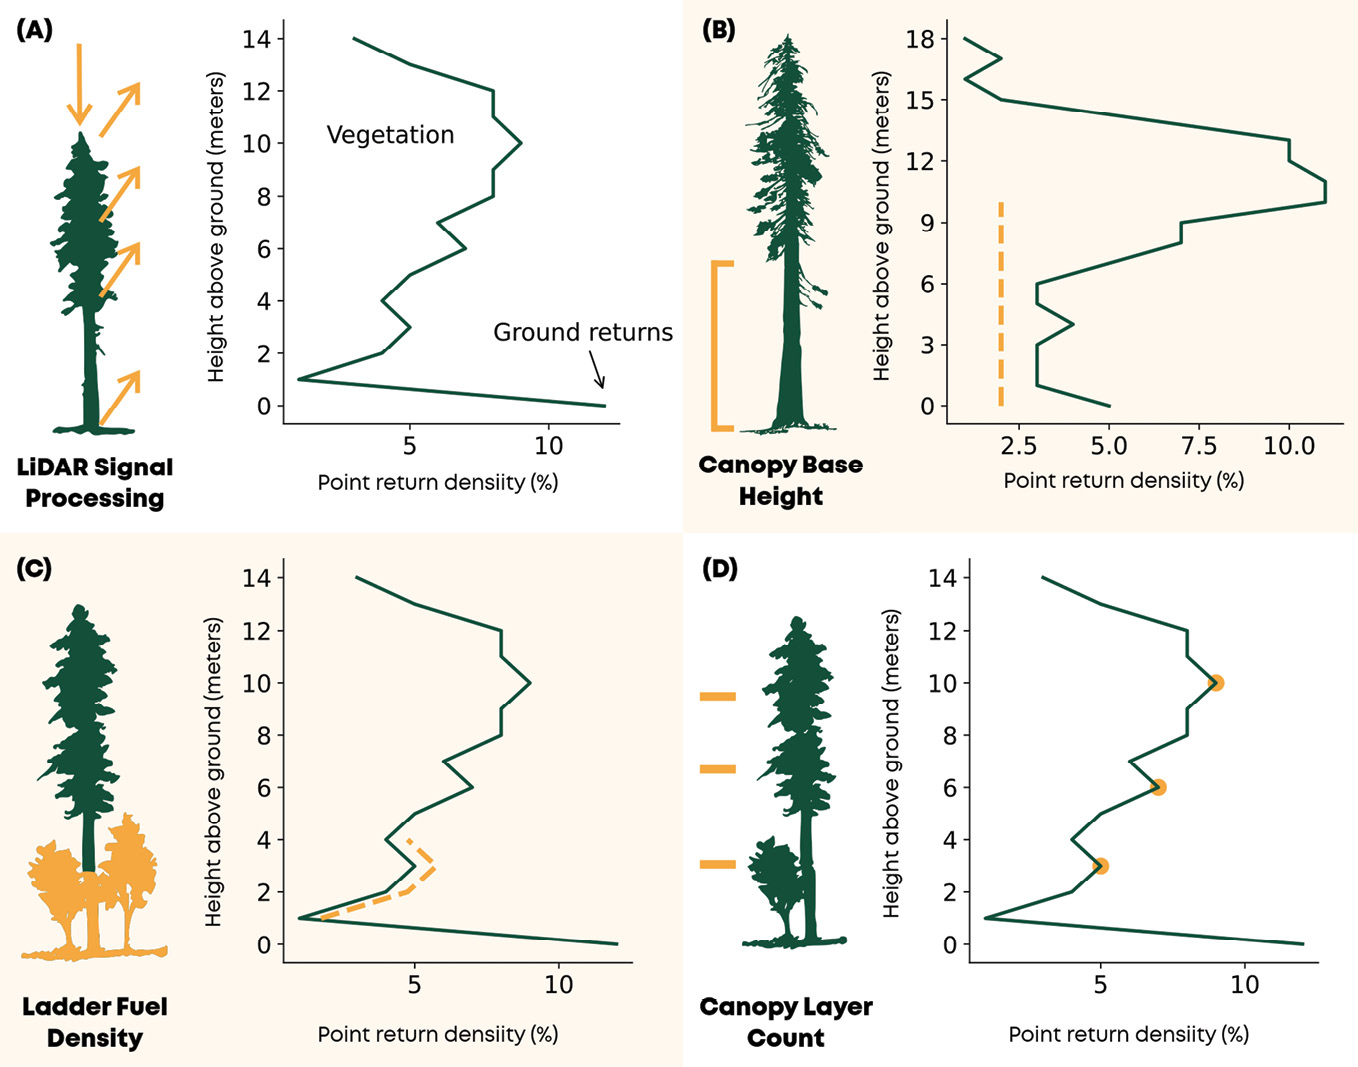
Figure 1: (A) Vegetation fuel metrics can be derived by analyzing lidar pseudo-waveforms. Some examples include (B) canopy base height, the distance between the ground and the lowest canopy layer, (C) ladder fuel density, the proportion of short vegetation fuels and (D) canopy layer count, an estimate of the number of unique vertical canopy layers.
This ability to measure sub-canopy structure patterns is important for fuel mapping. The size of a canopy can be used to estimate the volume of fuel that could be consumed in a crown fire. The spatial distribution of tall and short trees across a landscape can slow bursts of wind as gusts fan the flames. The amount of understory vegetation can predict the likelihood that a surface fire transitions into a crown fire. As the frequency and intensity of wildfires is increasing, especially in seasonally arid landscapes like California, it is becoming more and more important to develop precise and dynamic maps of fuel distributions to predict which areas are at risk and how risk changes over time. Lidar plays a central role here, but its utility is limited by two operational constraints.
Limits in space and time
The first constraint is that lidar coverage is spatially limited, either by extent or by point spacing. Terrestrial and airborne systems are deployed to map specific areas—like cities, watersheds or landscapes—but comprehensively mapping large areas like states tends to be a major logistical challenge. Spaceborne sensors on the other hand, like GEDI (the Global Ecosystem Dynamics Investigation), can provide nearly comprehensive spatial coverage, but through point sampling. GEDI’s 30 m diameter large-footprint measurements have approximately 600 m of cross-track spacing, creating large data gaps between points.
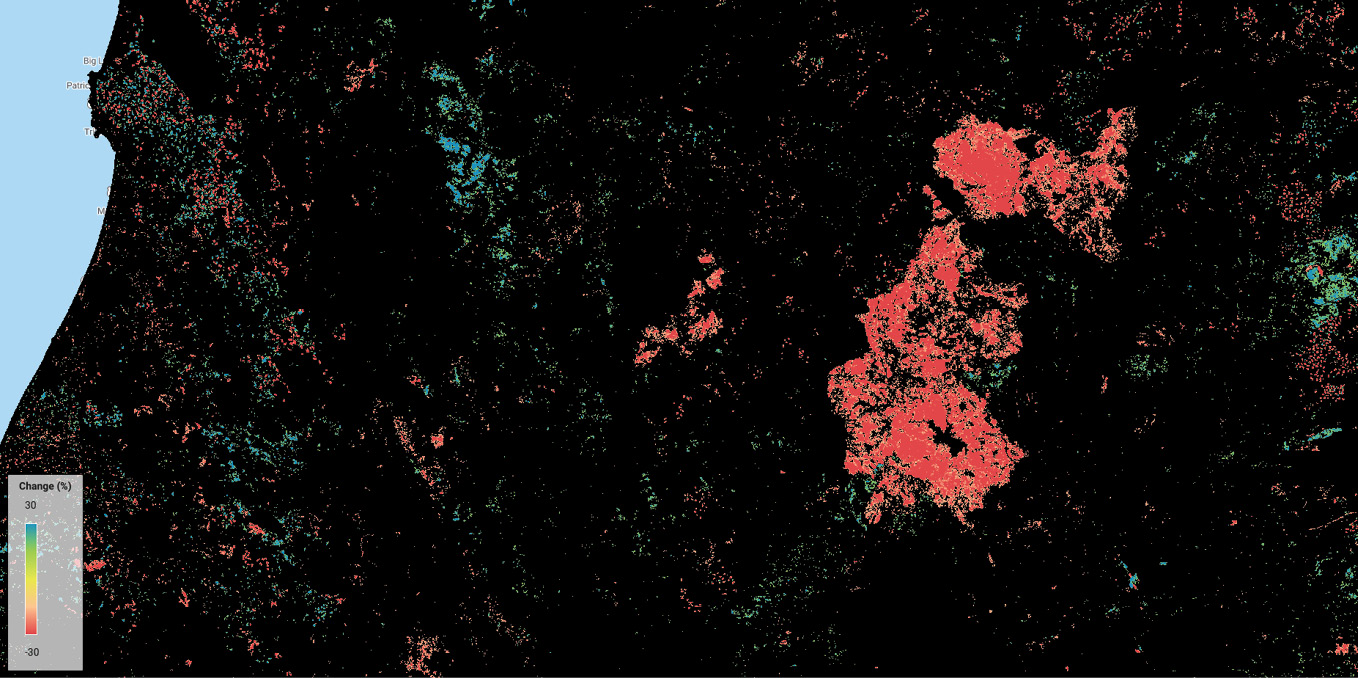
Figure 2: Canopy cover change patterns from 2016 to 2020, mapped at the scale of the individual tree. Canopy loss is mapped in warm colors, and canopy growth in cool ones. The large fire extent is from the Carr Fire of 2018.
It’s important to comprehensively characterize the fuel patterns that drive fire behavior, because wildfires are growing in size and intensity as the climate gets warmer and drier. This means that fires often spread beyond the extents of publicly-available lidar datasets. Among the 2020 California wildfires5, for example, were ten separate fires that grew to more than 100,000 acres each, including the million-acre August Complex fires.
The second constraint is that it’s expensive to collect repeat observations to characterize change over time (Figure 2). As its name implies, fire season comes and goes with each year, and the areas most likely to burn change based on where the weather is driest, how much fuel has accumulated, and the amount of time that has passed since the last fire. I mention this as a reminder that wildfire is a dynamic process, and that patterns of pyrogeography are bound to change as the environment does.
The need for rapid-refresh data isn’t as common in other earth sciences domains where lidar is frequently used. With the exceptions of landslides or subsidence due to groundwater depletion, most terrain models can be expected to remain fairly static. But the need is clear in the context of fuels monitoring. Ecosystems are rapidly changing in response to climatic shifts like droughts and floods, resource-extraction activities like timber harvests, land-use changes like farming and cattle grazing, ecological growth and species turnover. These effects all interact to create a patchwork mosaic of change in vegetation communities, shifting where we expect fires to occur each year.
Other satellite data sources, such as multispectral and synthetic aperture radar sensors, are not subject to these same problems. They complement lidar by providing repeat and spatially comprehensive measurements around the world. These instruments are sensitive to patterns of ecosystem structure, like tree height and forest type, and to patterns of ecosystem function, like vegetation growth rates and water use. But satellite data are subject to other pitfalls. While these instruments are sensitive to vegetation patterns, there are very few well-established methods for directly retrieving quantitative fuel estimates. There are problems with cloud cover and of measurement consistency, which can change throughout the year with sun and sensor positions and with vegetation phenology. And, critically, they don’t get to claim the benefit of laser precision.
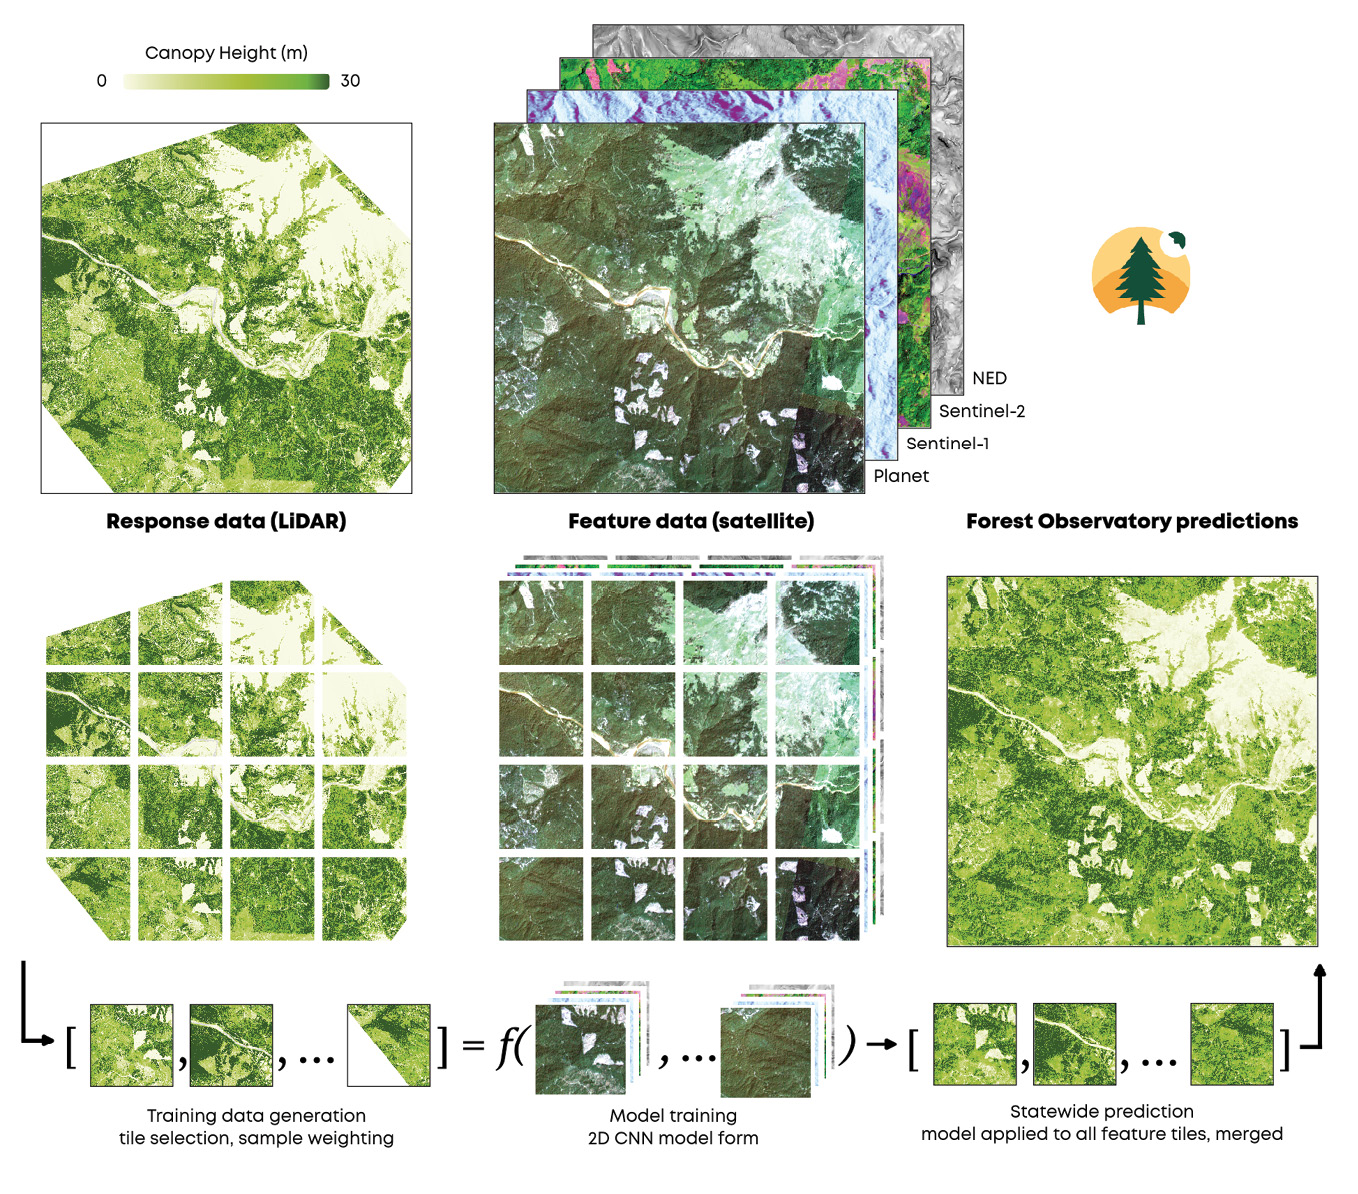
Figure 3: The Forest Observatory workflow. Airborne lidar data is processed to metrics of forest structure and fuel loads. This data is co-aligned with satellite imagery and used to train AI algorithms. The model is then applied to every feature data tile to predict fuels across the state.
To address these problems, we at Salo Sciences built the Forest Observatory6, a forest monitoring system that combines airborne lidar and global satellite data to map vegetation fuels continuously over large scales, starting in California. This system trains deep learning algorithms, a form of pattern recognition AI, using airborne lidar to identify fuel patterns in satellite imagery. The fuel metrics derived from airborne lidar serve as labeled “ground truth” data, and the algorithms learn to identify those patterns using the spatial and spectral features of the satellite data. It’s like facial recognition for forests. Once trained, this model can be applied to new satellite imagery to map changes in fuels over time. This enables characterizing the drivers of wildfire behavior in fine detail at large scales, providing up-to-date information on fuels and hazard. The workflow is summarized in Figure 3.
As a conservation technology company, Salo Sciences strives to accelerate the pace and scale of investments in natural climate solutions—conserving, restoring and improving stewardship in ecosystems—by using technology to identify conservation opportunities, monitor ecosystem health and predict environmental change. Wildfire is a major source of land-based carbon emissions, especially in California, and it’s an important driver of environmental change. With new and incredibly detailed data on vegetation fuels, forest structure and wildfire hazards, we see a tremendous array of opportunities to use the Forest Observatory to reduce both risk and emissions while increasing social and ecological resilience.
Starting good fires, stopping bad ones
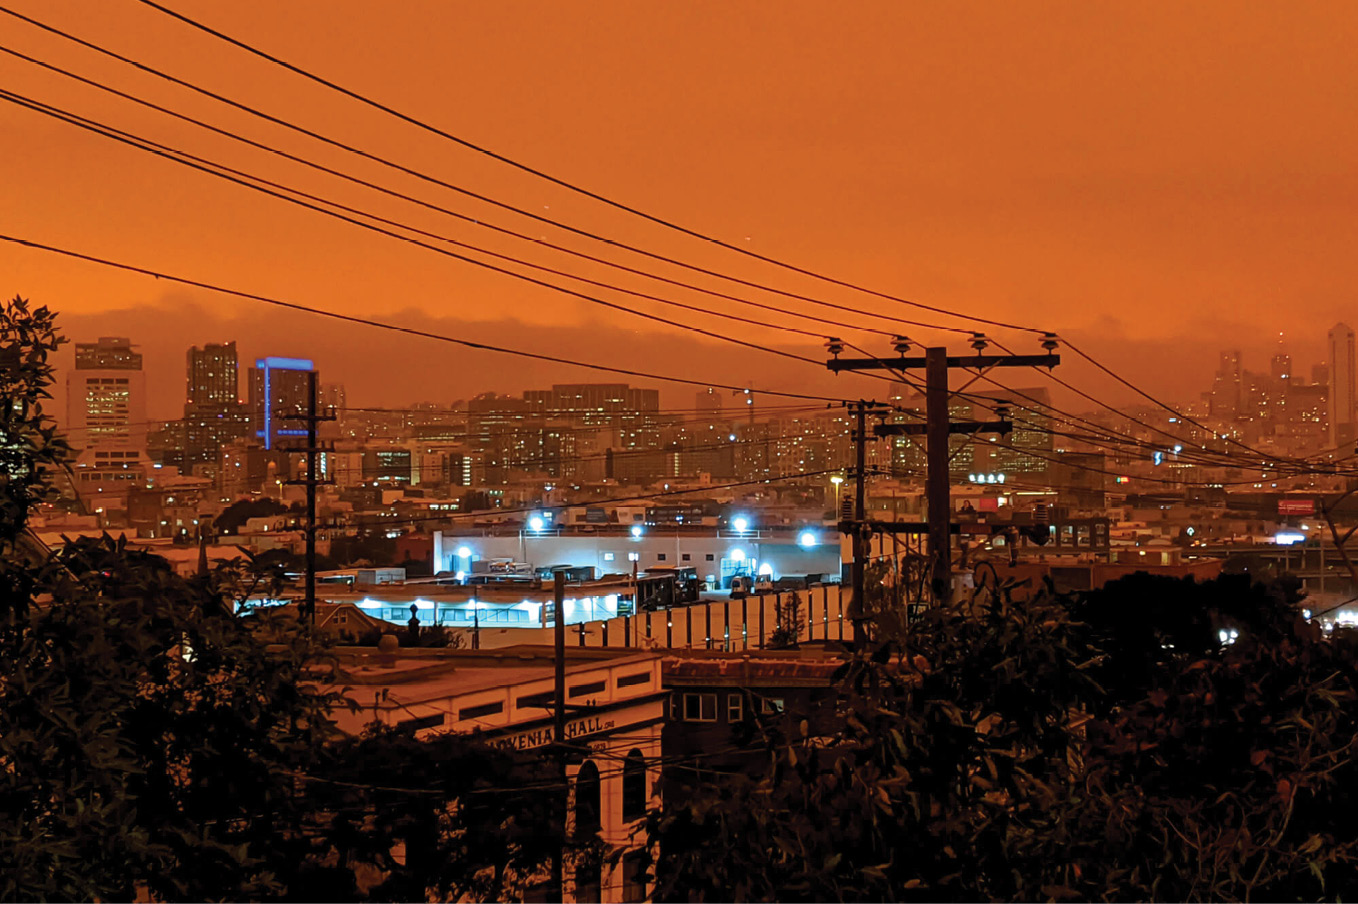
Figure 4: The sight of orange, smoke-filled skies in California from the 2020 wildfire season is something many people will never forget.
The design and development goals for the Forest Observatory included building a system that would support efforts to start more good fires and reduce the number of bad ones. Let me clarify the distinction.
Fire is an essential ecosystem process. Heat and smoke can spur seed germination for many fire-adapted species, and fire promotes nutrient cycling at much faster rates than natural decomposition. This is especially important in Mediterranean climates where rainfall and warm temperatures—which jointly promote decomposition—occur at different times of year. Regular, low-intensity surface fires can also thin or clear understory vegetation, reducing the likelihood of initiating high-intensity crown fires. Some ecosystems have adapted to fire return intervals as short as five to ten years, meaning that fire would return to each part of the landscape at least once per decade.
Fire is also an essential cultural process. Indigenous cultures regularly use fire7 as a means to sustain and harvest natural resources, as well as promote healthy ecosystem function. Elizabeth Azzuz, a member of the Yurok Tribe, summarized8 that, “We rely on fire to maintain our basketry materials, medicinal plants, acorn trees and hunting grounds.” By intentionally burning landscapes at the same frequency as their fire return interval, groups like the Yurok and Karuk would reduce the risk of pest and pathogen infestation to the resources they use and depend on, as well as to reduce the likelihood of high-intensity fires.
It’s also an important cultural symbol for contemporary urban culture. Books like Earthquakes Mudslides Fires & Riots9, a review of the history of graphic design in California, demonstrate how symbols of fire, experiences of fire and shared stories of loss all contribute to our perception of what it means to live in this state. These perceptions are then represented and codified in the unique styles of California visual designers, subtly shifting the standard color palettes of pop art towards oranges, reds and dark yellows. I suspect the images of apocalyptic orange skies from this past wildfire season will further define what we expect the future of our state to look like (Figure 4).
Prescribed fire, as applied in forest management contexts, is one of the most effective tools for wildfire hazard reduction, and many hope it will be deployed at scale in the coming years. By intentionally starting fires during favorable weather conditions and guiding the path of a fire across the landscape, forest managers emulate natural ecosystem processes and indigenous burn practices to clear brush and reduce hazards.
The benefits of prescribed fire are analogous to the benefits of “flattening the curve” with covid-19. With covid, it’s beneficial to slow the rate of transmission so that the health care system can accommodate a steady number of patients with severe symptoms and provide them with adequate care. Rapid transmission instead overloads the healthcare system so some patients aren’t able to receive the care they need. This means that, even if the total number of cases were the same between slow and rapid transmission scenarios, the overall health costs would be lower with slow transmission. With fire, if you burn the same amount of area in a controlled fashion over a longer period of time, the amount of smoke produced is distributed over space and over time. Intense fires, however, overload the atmosphere’s ability to diffuse harmful particles, creating disproportionately negative health consequences. Prescribed fires limit toxic smoke exposure and reduce severe respiratory illness rates compared to high intensity wildfires.
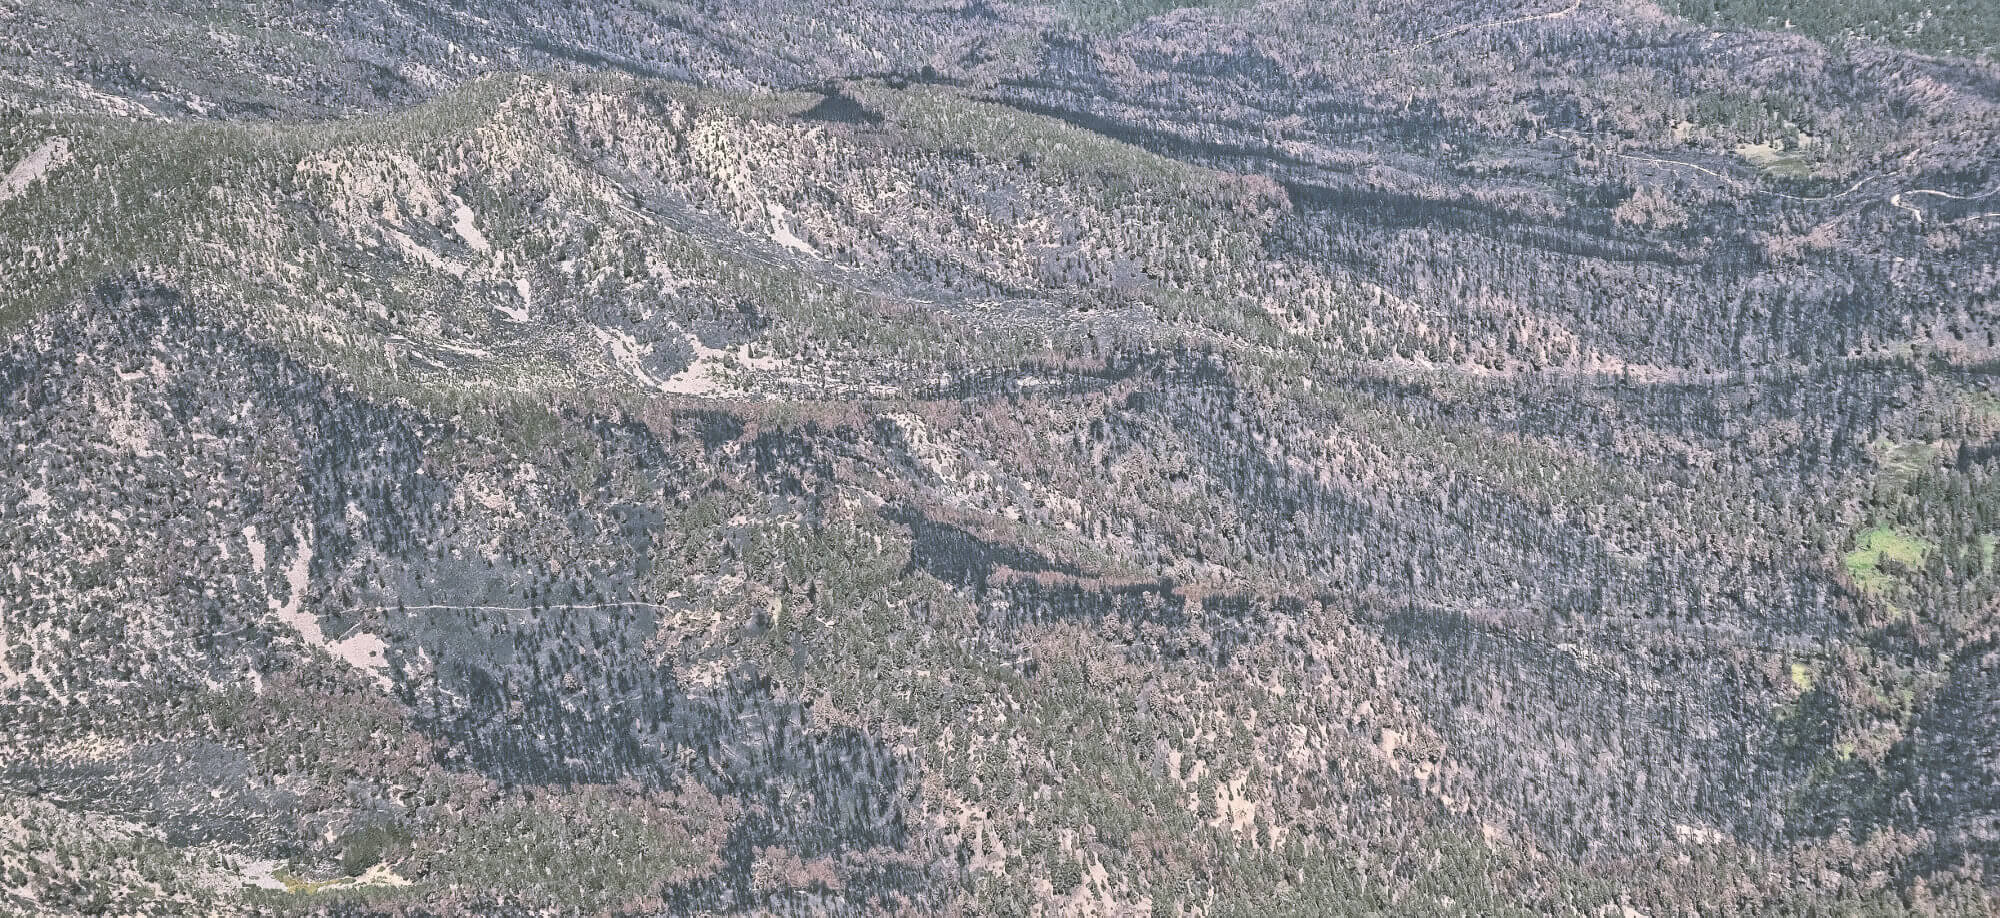
Figure 5: A complex matrix of burned and unburned areas, leading to either regeneration or continuation, arrayed across the Los Padres National Forest.
The examples above are mostly examples of “good fires” that have beneficial ecological effects (Figure 5). The deployment of good fire at the scale required—the state set a target of five hundred thousand acres per year in addition to US Forest Service targets—is limited in part by a lack of planning and forecasting tools. With high-resolution data on current fuel distributions, as well as current and forecasted weather trends, burn teams should be able to create more precise simulations for how a prescribed fire will burn and reduce the uncertainty that it will escape control—two key limitations. The Forest Observatory was designed to make it easier to start more good fires as a means to reduce wildfire hazards at large scales—and, as mentioned above, to reduce the number of bad fires.
Some fires, on the other hand, have strictly negative consequences with no beneficial social or environmental impact. These mostly start in populated areas, on roadsides or as a result of electrical equipment failures, which then spread through communities, disrupt lives, and damage homes and other property. One high-profile—but relatively infrequent—source of these fires includes ignitions that start from utilities infrastructure. The 2018 Camp Fire is a tragic example of such an event. Started by the failure of a Pacific Gas & Electric transmission line hook10, the fire was carried by high winds through the city of Paradise, devastating the community and killing 85 people. Wildfires started by utilities infrastructure have earned attention and ire from regulators, courts and the public alike over the past 15 years: this can be traced back to the 2007 Malibu Canyon fire, the result of a pole failure11 on Southern California Edison’s distribution grid.
Though the examples above were driven by equipment failures during extreme weather events, the majority of such ignitions are caused by vegetation contact, according to data from the Public Utilities Commission12. These ignitions only occasionally result in high profile fires, but you could understand why utilities now need to do everything in their power to reduce the likelihood of a failure that would lead to catastrophe. And as covered by this magazine13, lidar has a key role to play.
Cost-effective solutions for utility-strike tree analysis
Utilities have become an important consumer of terrestrial and airborne lidar data, which provides value to multiple business verticals. These measurements provide precise information on transmission and distribution assets, including wires, towers and poles, and can also be analyzed to quantify line sag and the locations of overhanging trees. These datasets support the information needs of asset management, vegetation management and risk analytics teams alike.
As noted at the beginning of this article, terrestrial and airborne lidar can be expensive to collect over large areas. It’s challenging to navigate collection platforms along the complex, irregularly shaped networks that make up distribution grids, which range from thousands to hundreds of thousands of line miles depending on the utility, leading to long lead times on data acquisition and processing. A one-time investment in data collection is sufficient for many assets, as towers, poles and wires remain stationary. But what of the patterns that change? The locations of most assets haven’t changed in the past 50 years—why have their risk profiles?
Vegetation management and risk analytics teams appear to be among the most interested in mapping change over time. Vegetation encroachment continues throughout the year, shifting priorities for where to trim and remove trees each year, and analysts are eager to quantify the value of these and other risk reduction activities over time. Satellite-derived estimates of vegetation growth and encroachment can complement lidar data by mapping change over time, albeit with lower precision. As new imagery is collected and processed, satellite-based monitoring systems can provide up-to-date vegetation data, quantifying shifts in encroachment and risk over time.
PG&E has emerged as a leader in adopting new technologies in this space, developing and publishing a 1,000+ page wildfire mitigation plan14 detailing its risk reduction activities for 2021. It uses both lidar and satellite-derived datasets to support its vegetation management plans and risk reduction efforts. These datasets, along with other environmental and asset health information, are used to predict both the probabilities and consequences of ignitions across their grid, and are a part of a broader effort to adopt a suite of next-generation technology systems. These efforts are designed to reduce systemic risks to PG&E’s infrastructure and the communities it serves, limiting its liability and ensuring price stability for customers.
The mitigation plans, while ambitious now, are a direct response to prior negligence, litigation and regulation following several tragedies for which PG&E was responsible as a result of mismanagement. I won’t argue that the current settlements provide sufficient restorative justice15 to the victims of these tragedies, but I do believe that the mechanisms of accountability—the courts, regulators and the many smart and thoughtful individuals within the organization—are promoting safer, more stable, and more risk-conscious operations inside PG&E. I suspect the PG&E example will provide an opportunity for other utilities to anticipate—rather than react to—the shifting landscape of risk.
As the climate warms, as utility infrastructure ages and as vegetation fuels accumulate, I expect the demand for new technologies that identify, monitor and predict systemic risks will grow, and many of the readers of this magazine will be responsible for developing and deploying these technologies at scale. I look forward to the opportunity to work together to start more good fires, and reduce the number of bad ones.
Disclosure: Salo Sciences is a data provider and analytics contractor to PG&E, and is named in its 2021 wildfire mitigation plan.
Christopher Anderson is co-founder and CTO of Salo Sciences16, a conservation technology company, and a researcher at the Center for Conservation Biology17 at Stanford University. He recently received his PhD in biology at Stanford University. He previously worked at the Carnegie Institution for Science in the Department of Global Ecology as a part of the crew of the Carnegie Airborne Observatory, an airborne lidar and imaging spectroscopy platform. You can read more on his personal website18.
1 https://besjournals.onlinelibrary.wiley.com/doi/full/10.1111/2041-210X.12301
2 https://lidarmag.com/2014/03/25/lidar-drone-system-maps-height-of-rainforest-for-the-first-time/
3 https://gedi.umd.edu/
4 https://www.mckinsey.com/industries/paper-forest-products-and-packaging/our-insights/precision-forestry-a-revolution-in-the-woods#
5 https://www.fire.ca.gov/incidents/2020/
6 https://forestobservatory.com/tour
7 https://www.sciencedirect.com/science/article/pii/S0378112719306826
8 https://mronline.org/2020/10/23/indigenous-solutions-to-californias-capitalist-conflagrations/
9 https://www.artbook.com/9781938922619.html
10 https://www.sfchronicle.com/california-wildfires/article/Attorneys-say-this-photo-shows-the-PG-E-hook-that-14882924.php
11 https://www.latimes.com/local/la-xpm-2013-may-21-la-me-0521-malibu-fire-settlement-20130521-story.html
12 https://www.cpuc.ca.gov/fireincidentsdata/
13 https://lidarmag.com/2013/03/23/integrating-lidar-with-wildfire-risk-analysis-for-electric-utilities/
14 https://www.pge.com/pge_global/common/pdfs/safety/emergency-preparedness/natural-disaster/wildfires/wildfire-mitigation-plan/2021-Wildfire-Safety-Plan.pdf
15 https://www.forbes.com/sites/morgansimon/2020/07/27/we-treat-corporations-like-people-except-when-it-comes-to-punishment/?sh=64fdd31f2748
16 https://salo.ai/
17 https://ccb.stanford.edu/
18 https://cbanderson.info