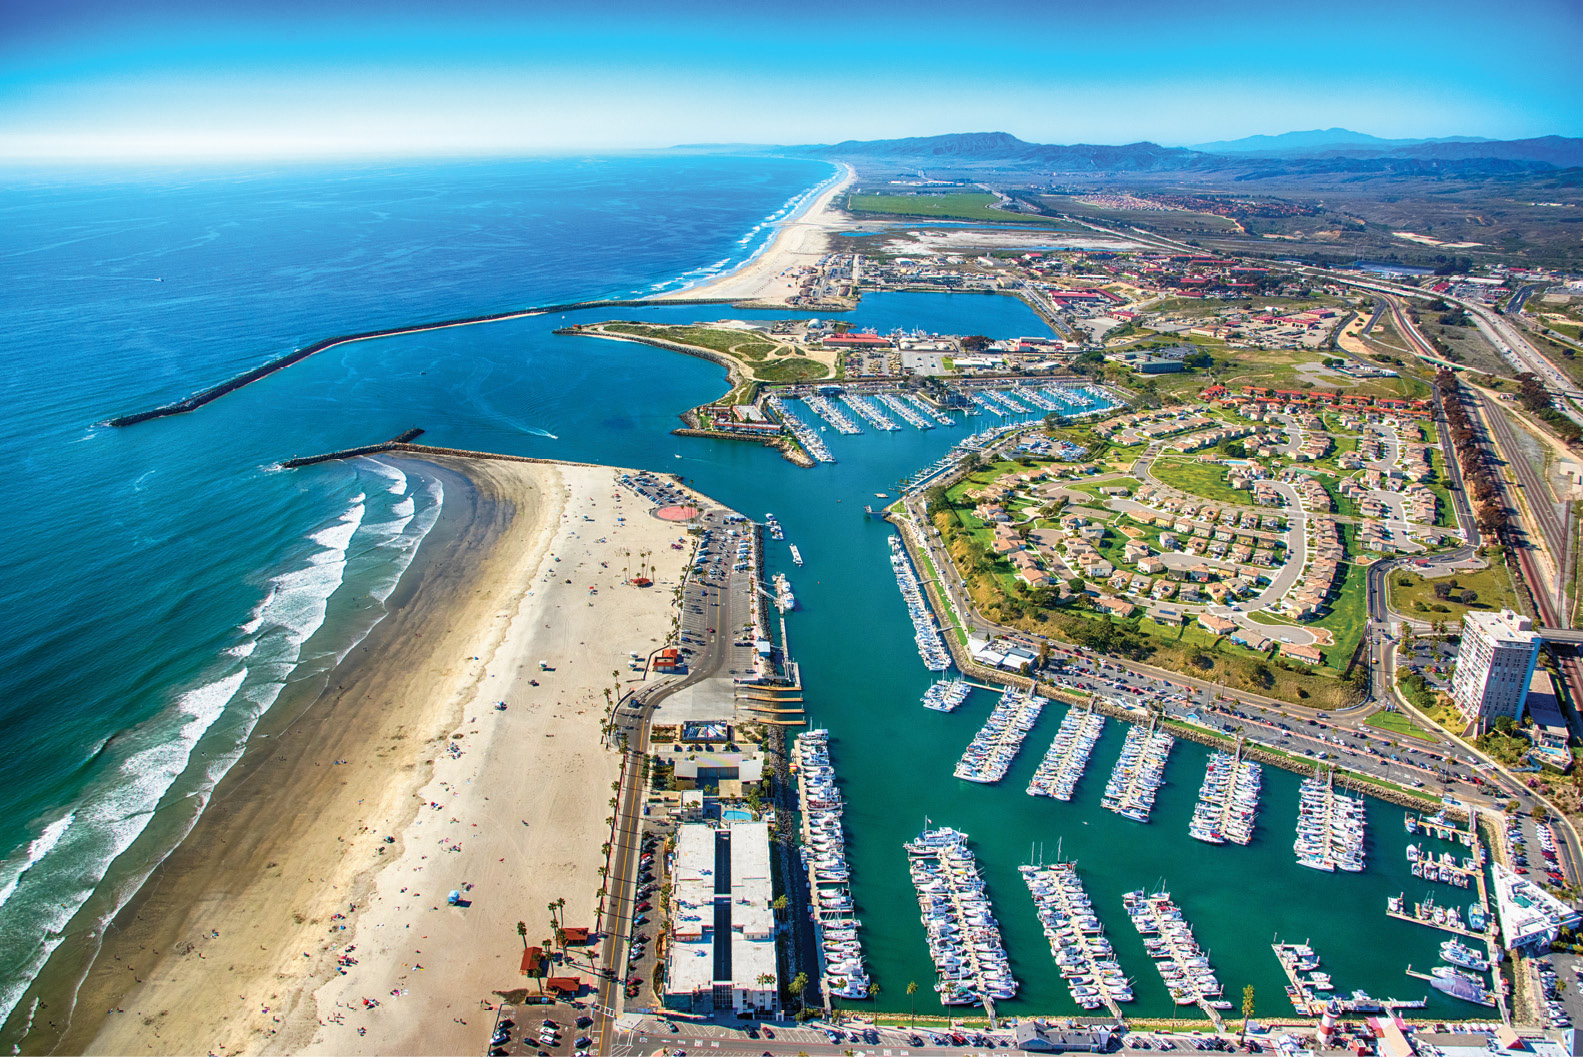
Figure 1: Oceanside, California, is in northern San Diego County. Photo by Getty Images.
California’s 1352 kilometers of coastline present varied and challenging mapping environments. These range from the sandy beaches of Malibu to the rocky coasts of Northern California and from small creeks and rivers like the Santa Ana to large bays and harbors, such as those in San Francisco and Los Angeles/Long Beach. They flow from dense kelp beds near Catalina to the formidable coastal bluffs at La Jolla and extend from the natural panoramas on the sand dunes at Inglenook to the highly developed coastal communities at Oxnard.
Mapping these diverse conditions is well suited for airborne topographic and bathymetric lidar with high-resolution aerial photography (Figure 1) and hyperspectral imagery. This topobathymetric lidar-imagery combination produces highly dense and accurate three-dimensional elevations, centimeter-resolution resolution imagery, and spectral characteristics of land and water. These are used as individual mapping products and combined into derived or fusion products that significantly expand measurement and monitoring of the coastal region. During the summer of 2021, large portions of the California coastline are being mapped by the National Coastal Mapping Program (NCMP) of the U.S. Army Corps of Engineers (USACE).
National Coastal Mapping Program
NCMP was established in 2004 to map the U.S. coast on a five-year recurring schedule. It supports the USACE Civil Works mission regarding navigation, flood-risk management, ecosystem restoration, emergency response and regional sediment management. It is the only federal coastal mapping program with a recurring national schedule, and this will be the third time since 2010 that NCMP has mapped the California coast. NCMP flies airborne topobathymetric lidar with a high-resolution camera and a spectral imager to collect data along the coast in the most active zone for sediment movement, 500 meters landward of the waterline to 1000 meters offshore. This nearly mile-wide zone is where currents, waves and storm surge move sand; where the oceans meet the shoreline, bays, inlets, ecosystems and communities; and where change occurs most rapidly. USACE uses the data to monitor and inform decisions on sediment management, coastal studies, beach and dune restoration, remote inspection of coastal structures, and threatened and endangered species and habitats, among other coastal applications. In addition, these data and related mapping products are available to the public through NCMP, local USACE district offices, and the Digital Coast website of the National Oceanic and Atmospheric Administration (NOAA).
NCMP has partnered with the U.S. Naval Oceanographic Office (NAVOCEANO) to develop and share topobathymetric lidar sensors and operational capabilities and with NOAA and the U.S. Geological Survey (USGS) to combine research and develop new products that characterize the coastal zone for the agencies and public. This leveraging of knowledge and expertise is formally called the Joint Airborne Lidar Bathymetry Technical Center of Expertise (JALBTCX). It was established in 1998 and is located at Stennis International Airport, Kiln, Mississippi, which is adjacent to NAVOCEANO and USACE. USACE/NCMP and NAVOCEANO have four JALBTCX-developed Coastal Zone Mapping and Imaging Lidar (CZMIL) sensors that are government-owned and contractor-operated. They share the CZMIL sensors to meet their coastal mapping and nautical charting requirements, respectively. The current JALBTCX contractor is WMR-532, a joint venture between Woolpert, headquartered in Dayton, Ohio, and Optimal GEO, headquartered in Athens, Alabama. The CZMIL sensors are operated worldwide to meet both agencies’ requirements.
The JALBTCX partnership is a government success story, accomplishing much more working together than these programs could have alone. Partners have each matured their programs and capabilities by coordinating their efforts. The knowledge developed from working together through JALBTCX has been complied in a publication, Airborne Laser Hydrography II1, often referred to as Airborne Laser Hydrography II (Blue Book II), which shares the knowledge gleaned from 30 years of advances and, most importantly, from thousands of hours of operational experience. This book includes information from additional international teams and systems, imparting the knowledge gained over a wide range of applications and environmental conditions.
California dreamin’
Before NCMP maps large portions of the California coast this summer, it will coordinate mapping in Texas, finish small sections remaining of Washington and Oregon from last summer’s survey flights, and map projects in Alaska under a new requirement to support the Alaska Coastal Mapping Strategy. In all these locations, NCMP begins with a point of contact in each USACE district office to identify requirements and priority areas. The planning process also includes discussions with district stakeholders from other federal, state and local government agencies to make sure as many identified needs are included in the mapping plan as possible.
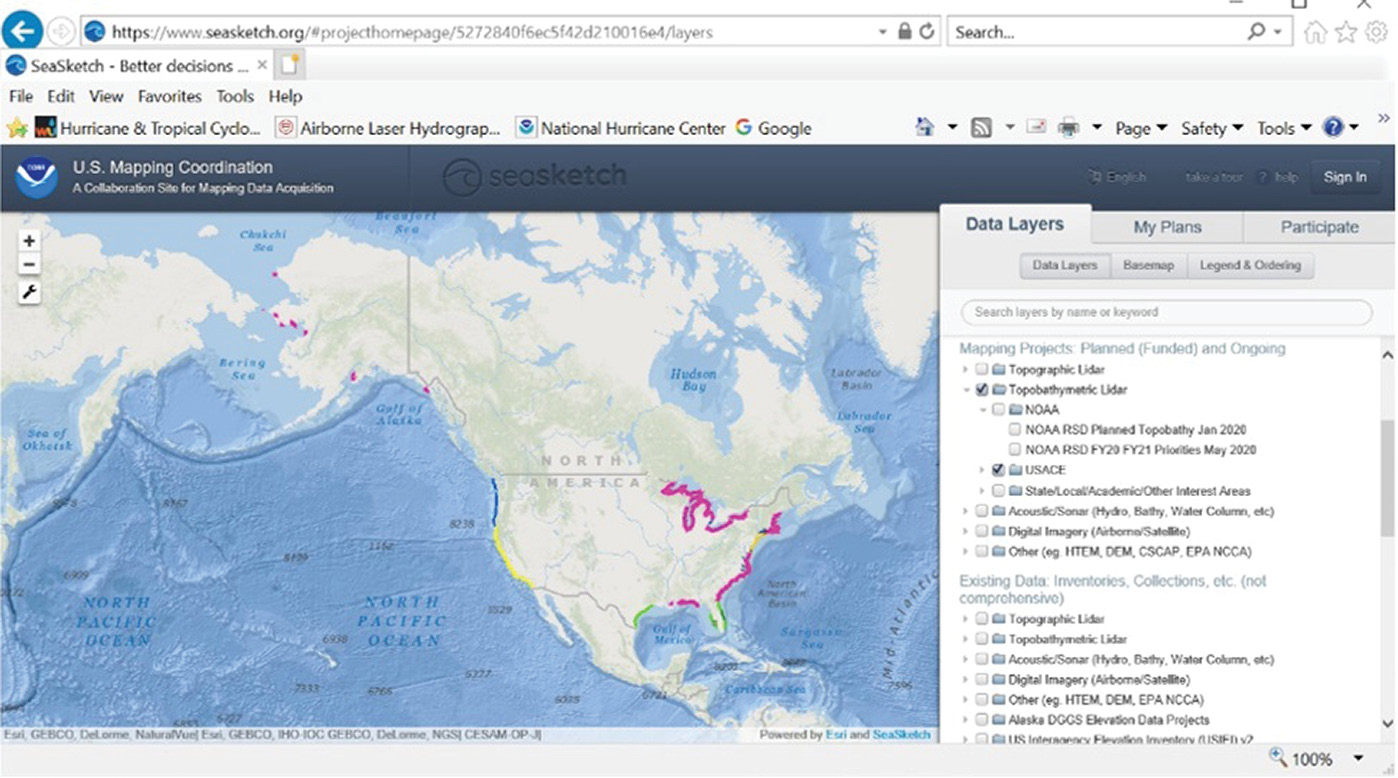
Figure 2: IWG-OCM National Planning Tool. Image from Seasketch website
In addition to direct outreach through the USACE districts, NCMP also works with the Federal Interagency Working Group on Ocean and Coastal Mapping (IWG-OCM), which is a working group of the National Science and Technology Council Subcommittee on Ocean Science and Technology. According to the National Ocean and Coastal Mapping Strategic Action Plan of 2009, IWG-OCM came into existence in 2006 to “facilitate the coordination of ocean and coastal mapping activities and avoid duplicating mapping activities across the federal sector as well as with state, industry, academic and non-governmental mapping interests.” IWG-OCM was established into law by the Ocean and Coastal Mapping Integration Act of 2009. To help coordinate coastal mapping programs and priorities, IWG-OCM maintains the Seasketch website (Figure 2) for U.S. Mapping Coordination2.
California mapping requirements are being developed as this article is being written and because of the flexibility of the planning tools and daily operations, new requirements may be added throughout the flying mission. If areas extend beyond the priorities identified by USACE districts, costs may be covered by federal, state or local agencies under agreements with USACE to transfer funding. This has proved to be very efficient and economical over the years, without requiring new contracting or mobilization expenses, while resulting in more area coverage. For example, it has led to mapping the Niagara River and Green Bay, during the mapping of the Great Lakes. Also, this year two inland California dams will be flown to support research and development efforts, including the development of digital twins to support these flood control structures.
Mapping the California coast
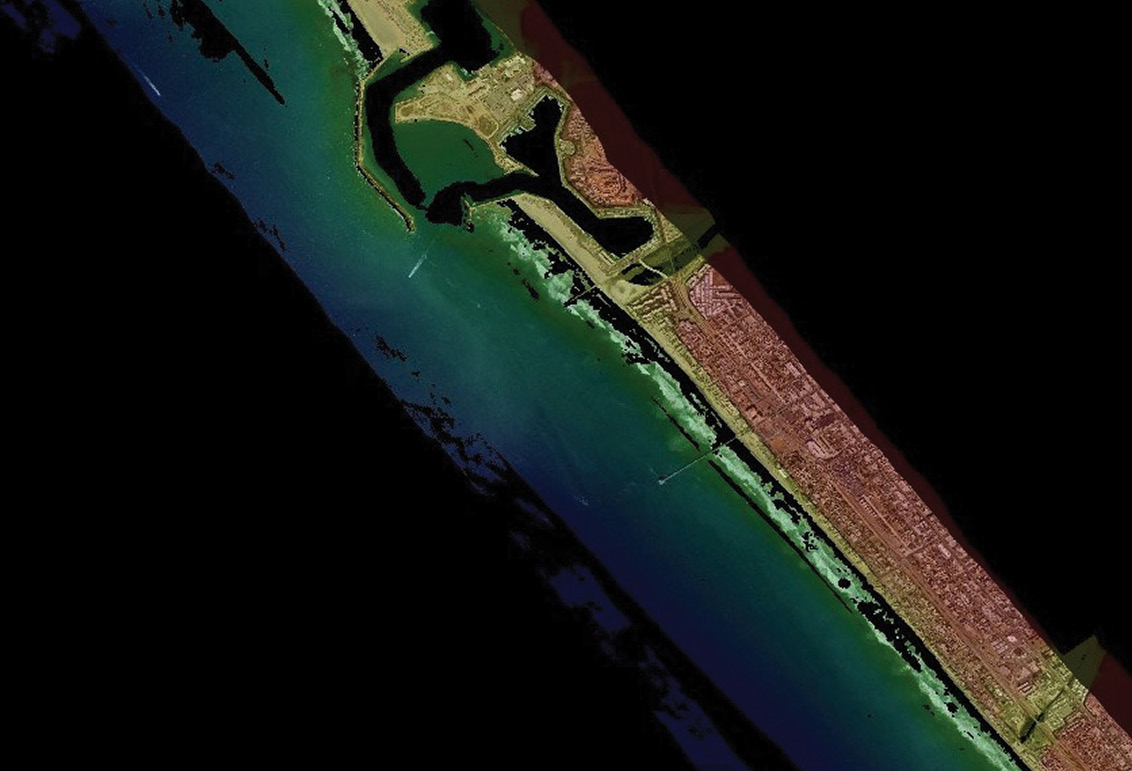
Figure 3: Oceanside, California, topobathymetric lidar collected in 2014. Image courtesy of USACE/JALBTCX
NCMP mapped the California coast in 2009-2010 and again in 2014-2015, so it is familiar with and understands the regions and their variations. Figure 3 shows topobathymetric lidar collected in 2014 at Oceanside, California. Coverage was complete and very thorough. For example, the 2015 California survey flew 1113 flight lines over 93 days, conducting 104 survey flights and covering over 2700 square kilometers along central and southern California. NCMP contributed to an interagency data collection of the California coast in 2016 following an El Niño year wracked by severe storms. It is often the case that NCMP’s recurring surveys provide the pre-storm conditions that are used with post-storm surveys to calculate storm damage and coastal impact, helping design more resilient repairs and project adaptions, as was the case with the 2016 El Niño surveys. Additionally, the flight lines from these previous missions form an excellent first cut for planning the 2021 mission, which include USACE navigation projects with channels, jetties and breakwaters; coastal flood risk management projects with beaches and dunes; and ecosystem projects to look at overall condition and measure change.

Figure 4: Change analysis at Oceanside, California, from 2009 and 2014. Data courtesy of USACE/JALBTCX, analysis courtesy of Bowhead.
Comparing elevations from the 2009 and 2014 NCMP surveys immediately demonstrates the value of these repeat datasets (Figure 4). The nearshore bar has clearly migrated between the two time periods, with most of the other areas relatively stable. Quantifying these changes lets coastal managers know what is changing and how fast change is happening. It informs decisions on where to focus resources to reduce future damages and increase coastal resilience. Similar comparisons may be made using NCMP imagery and spectral information. USACE uses the imagery to look at jetties and breakwaters to quantify movement of armor stone or indications of internal erosion of the structures and analyzes the spectral data to map land use and ecosystem health changes, such as those caused by invasive species.
Mapping products
The basic products that will result from the coastal California surveys are combined topobathymetric elevations, or point clouds, in LAS format, digital surface models (DSMs), digital elevation models (DEMs), air photo mosaics, hyperspectral image mosaics, a zero contour, all with accompanying metadata compliant with Federal Geographic Data Committee standards. These products have been developed over the years to facilitate ease of use of NCMP data and images by USACE, other agencies, coastal engineers and managers, as well as the public.
DEMs and DSMs are often used in numerical coastal process models that calculate wave runup and storm surge or compare pre-storm and post-storm surveys to calculate volumes of sediment erosion or accretion and, after extreme storms, to determine where buildings were damaged or destroyed. Comparison of zero contours provides a quick indication of what has changed since the last survey. Where change is extensive, the coastal engineer or manager may want to conduct high-resolution 3D change analyses of the beach and nearshore zone to determine the quantity and possibly cause of change.
Image mosaics provide a simple visual record of the condition of coastal jetties and breakwaters and aid inspections by identifying displaced or damaged stones. With centimeter-resolution images, even identifying cracks in rubble mound armor stone or fabricated concrete armor units like the dolos on the Crescent City, California, breakwater is possible. Hyperspectral images are used in combination with lidar elevation data to produce land cover and seabed classifications. Classification of specific vegetation species can aid in the mapping of and design of effective management strategies for invasive species, such as giant reed on the Santa Ana River adjacent to Newport Beach, California. When compared to previous collections, it is possible to calculate landscape changes, such as how much green space has become developed or change in area of seagrass beds.
Emerging tools and capabilities
NCMP has developed a set of geospatial analysis tools that standardize production of key coastal information. The USACE Volume Change Toolbox standardizes computation of beach and nearshore volume change from 3D coastal datasets for sediment budgets and post-storm impact assessments. NCMP initially developed the Toolbox to systematically compute volumes along long stretches of coast for development of regional sediment budgets. USACE Volume Change Toolbox outputs link to the USACE Sediment Budget Analysis System through web services for faster regional sediment budget development. USACE researchers have used the Toolbox extensively to compute regional beach elevation change, shoreline change, and volume change after hurricanes Sandy, Matthew, Irma, Maria, Michael and Sally, and after a strong winter storm season in New York in 2020. The USACE Volume Change Toolbox is a set of Python scripts that guide a user through all the steps needed to compute elevation change, shoreline change and volume change in a systematic way for long stretches of coast (hundreds of miles). The Toolbox operates in an ArcGIS environment and is semi-automated, which means that once a user has set up each step, it runs automatically through the input datasets to produce a result.
The USACE Coastal Geomorphology Metrics Toolbox automates the extraction of coastal metrics such as dune crest location and height, dune toe location and height, bluff crest location and height, bluff toe location and height, beach width, beach slope, and sandbar location and depth. Algorithms for metric extraction were developed in collaboration with scientists in the USGS Coastal and Marine Geology Program. These metrics are used in multiple applications, such as the generation of a barrier island breachability index for the state of Texas, and the computation of bluff recession rates for sediment budget development in the Great Lakes. The Coastal Engineering Resilience Index Tool uses a number of these metrics along with wave, water level, and sediment models and data to estimate the relative resilience of the coast from an engineering perspective. The USACE Volume Change and Coastal Geomorphology Metrics Toolboxes are currently being converted to Python 3 for use in the ArcGIS Pro Environment.
The USACE Dune Vegetation Metrics Toolbox combines dune geomorphology with NCMP imagery to compute several vegetation metrics relevant to coastal studies. The presence of vegetation on a dune stabilizes the dune and increases its protective benefit in the event of a high wave or water level event. The custom toolbox was designed with the Python programming language and integrates ArcGIS Pro geoprocessing tools with ENVI image analysis software capabilities to enhance spatial analytics and spectral-band math algorithms used to derive the metrics.
The USACE Coastal Geomorphology and Dune Vegetation Metrics toolboxes are currently being validated by field data and tested for differing environments around the U.S. coastline.
Summary
Since 2004, there have been over 45,000 separate downloads of NCMP data from the Digital Coast website, amounting to over 10,500,000 MB of data. This is a key performance indicator of the value of the NCMP data and resulting products. This summer, coastal California will be mapped, data will be processed, and standard products will be created and sent to USACE districts in California. They will also be loaded into the Digital Coast for easy public discovery and access. In no time, coastal engineers, scientists and managers will be using this data with results from 2010 and 2015 to inform decisions and target investments that protect the public and raise coastal resilience.
1 Philpot, W. (ed.), 2019. Airborne Laser Hydrography II, Cornell eCommons. 279 pp. https://doi.org/10.7298/jxm9-g971.
2 https://www.seasketch.org/#projecthomepage/5272840f6ec5f42d210016e4.