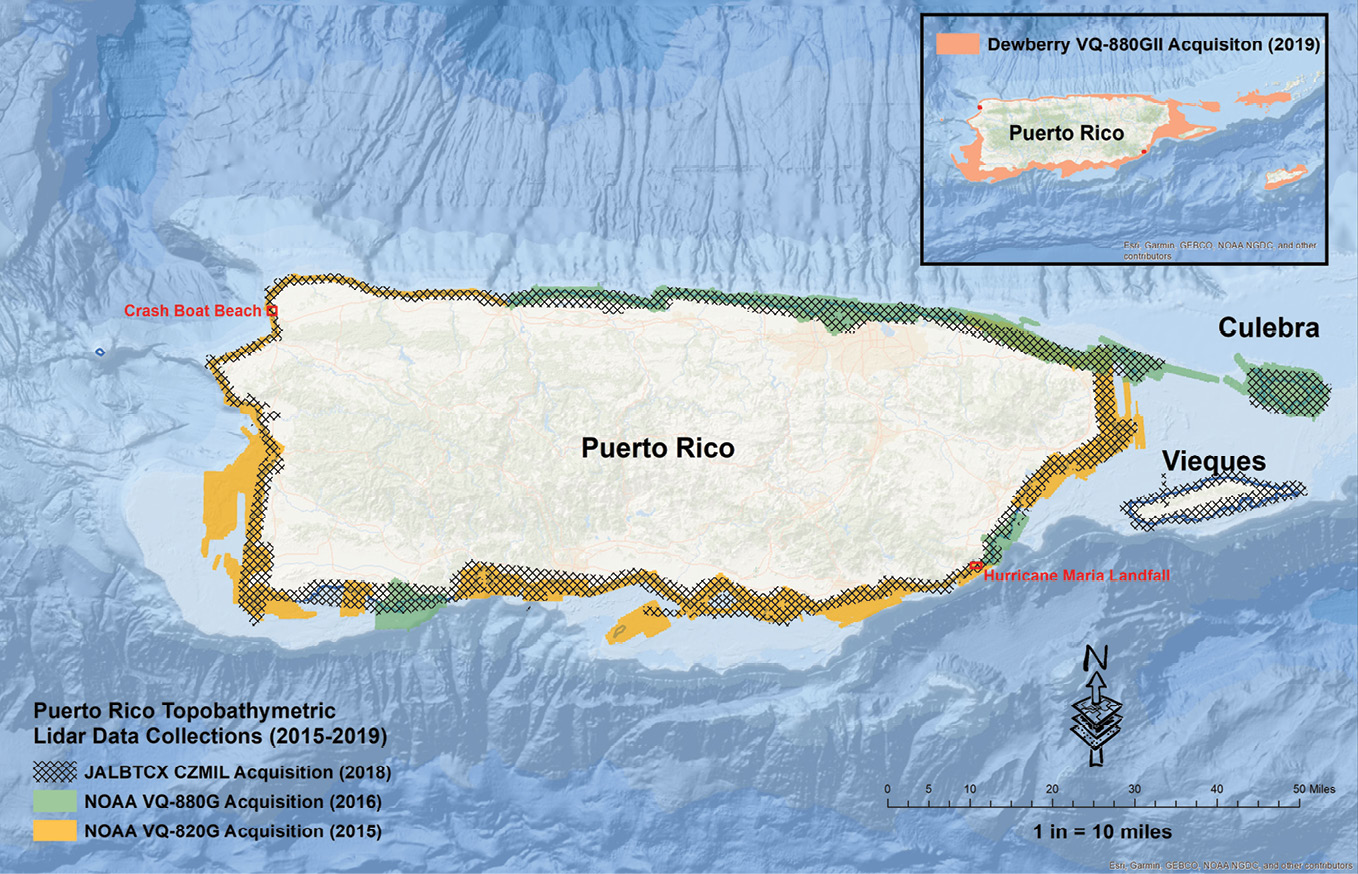
Figure 1: Topobathymetric lidar acquisitions between 2015 and 2019. The NOAA 2019 topobathymetric survey is shown on the inset map; the USGS 2019 topographic survey is not shown.
This is a follow-up to an earlier article by the same authors: Karlin, A., R. Miller and A. Nayegandhi, Measuring Maria’s havoc: evaluating hurricane damage with multi-temporal lidar, LIDAR Magazine, 3(5): 26-33, October/November 2020.
One of the classic questions posed to geography students is, “How long is the coastline?” The answer, of course, is that it depends—on the measurement techniques, the scale of reporting, the timeframe of the question (because coastlines are dynamic and always changing), and several other factors. The importance of the coastline for defense and commerce, however, was recognized in 1807 by President Thomas Jefferson, when he signed “An Act to provide for surveying the coasts of the United States”, which created the US Coastal Survey Office, one of the oldest scientific agencies in the United States. Through the decades after Jefferson, the US Coastal Survey Office’s name changed several times, until 1970, when it became part of the National Oceanic and Atmospheric Administration (NOAA).

Figure 2: Paths of Hurricane Irma (6 September 2017) and Hurricane Maria (20 September 2017).
After 1897, as new territories were added, commerce increased and, with the discovery of gold in California and Alaska, the importance of the coastal mapping effort grew. Each coastal chart would be built from two types of surveys: a nautical (or hydrographic) survey, which mapped offshore hazards and the depths of coastal waters; and a topographic survey, which mapped the land, including the shoreline, natural and cultural features, and elevations above the sea.
Just as the name of the US Coastal Survey Office has changed since 1807, so have the techniques for mapping the coastline. The early surveys, like the survey of New York harbor, were conducted with conventional lead soundings, levels and transits. Cameras deployed from dirigibles at the turn of the 20th century gave way to fixed-wing aerial photogrammetric surveys and, most recently, lidar technologies for both topographic and bathymetric survey.
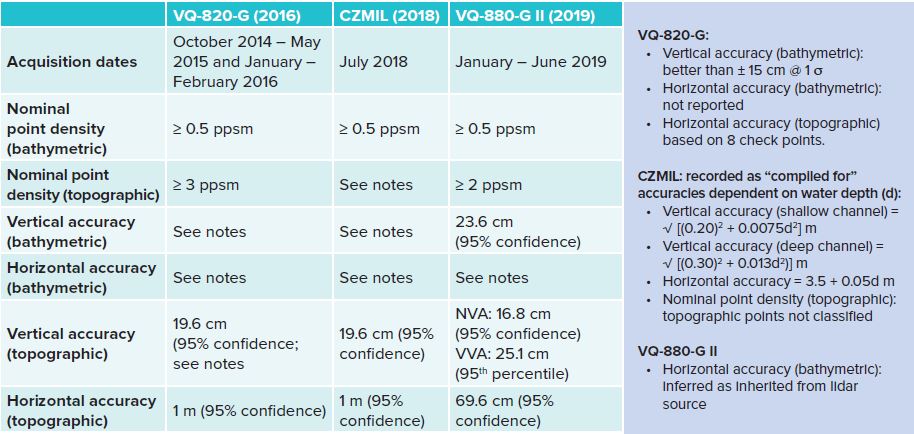
Table 1: Topobathymetric lidar acquisition parameters.
In the early 2010s, with commercially available topobathymetric sensors, i.e. “green lasers”, operating at 532 nm, capable of measuring range distances both on land and through moderate depths of water, hydrographic and topographic surveys could be accomplished simultaneously to facilitate the process of shoreline mapping. The surveys that previously took months to produce can now be conducted in hours or a few days. This increase in mapping efficiency permits revisits over coastal areas following storm events to assess coastal changes in the shoreline. As a result of a combination of planned and unforeseen natural events between 2015 and 2020, the shoreline of Puerto Rico was surveyed three times using topobathymetric lidar sensors.
Topobathymetric lidar shoreline surveys in Puerto Rico
2014-2015: NOAA (the first survey)
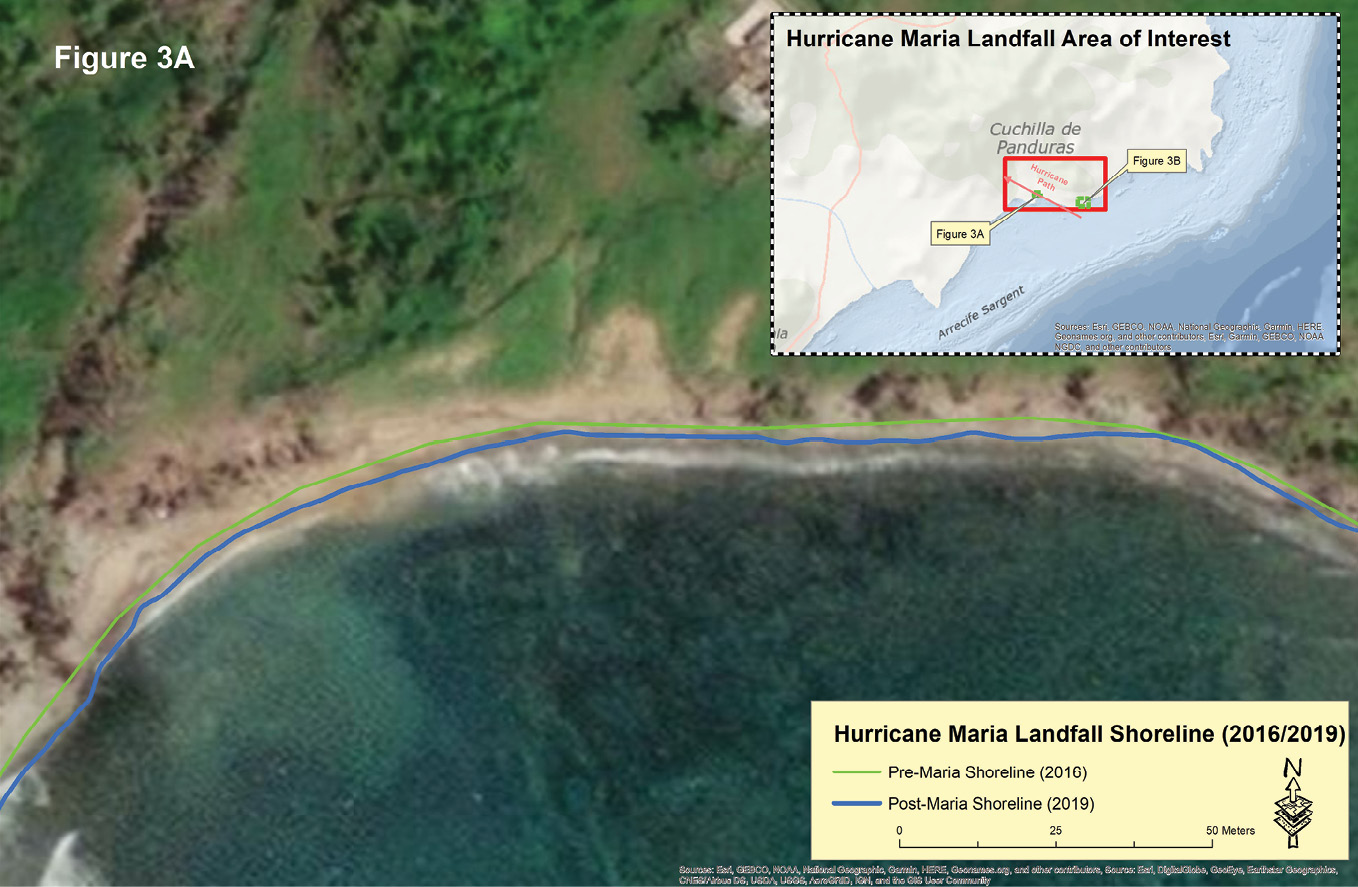
Figure 3: Changes in shoreline geometry in Puerto Rico near the landfall of Hurricane Maria (2016 – 2019). Figure 3A shows a section of shoreline where shoreline accretion occurred; Figure 3B shows a section where shoreline loss occurred.
In mid-2016, Dewberry received a Task Order through the NOAA Coastal Mapping Program to assist with processing Riegl VQ-820-G topobathymetric lidar data collected by NOAA between November 2014 and May 2015. This project included approximately 310 square miles (800 miles of coast) of the island of Puerto Rico including the island of Culebra (Figure 1; data available on NOAA DigitalCoast1). The data was intended for high-resolution shoreline mapping at scales from 1:5000 to 1:20,000 for both the mean high water (MHW) level and the mean lower low water (MLLW) level to 2000 feet inland. Later in 2016, NOAA revisited selected areas along the coast of Puerto Rico and surveyed using a newer Riegl VQ-880-G topobathymetric lidar sensor.
2018 JALBTCX (the second survey)
 Following the 2017 hurricane season, when Hurricane Irma drifted past the northern coast of Puerto Rico (6 September 2017) and then, two weeks later, on 20 September 2017, Hurricane Maria made landfall as a Category 5 storm (Figure 2), the coastline was resurveyed. The Joint Airborne Lidar Bathymetry Technical Center of Expertise (JALBTCX) acquired topobathymetric lidar using the Coastal Zone Mapping and Imaging Lidar (CZMIL) sensor along the coast, shown as the hatched area in Figure 1, immediately following the storms in the early summer of 2018.
2019 NOAA/USGS/Dewberry (the third survey)
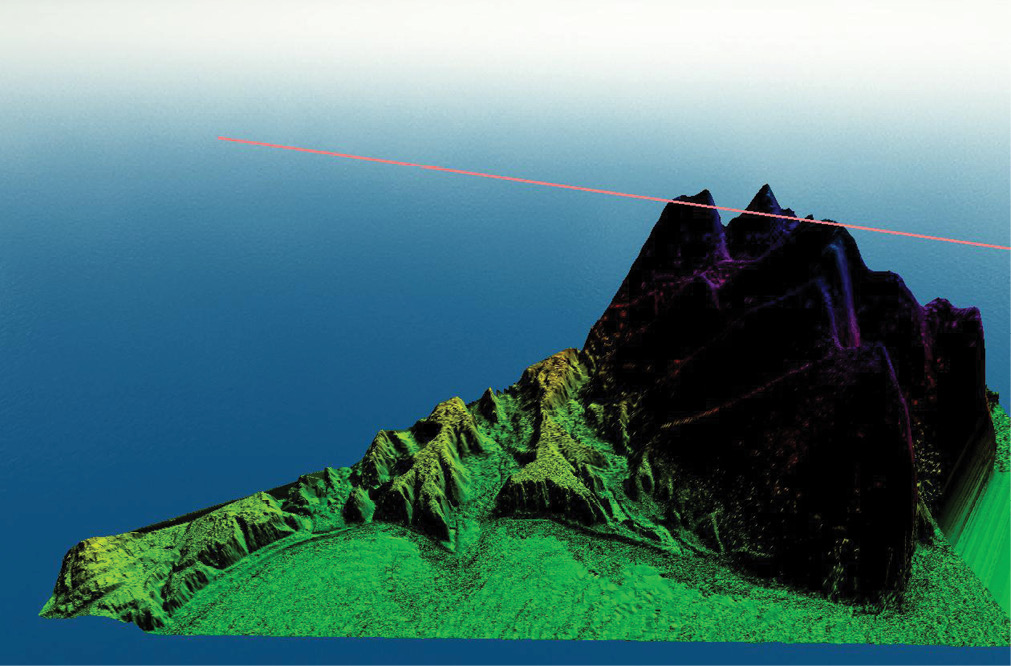
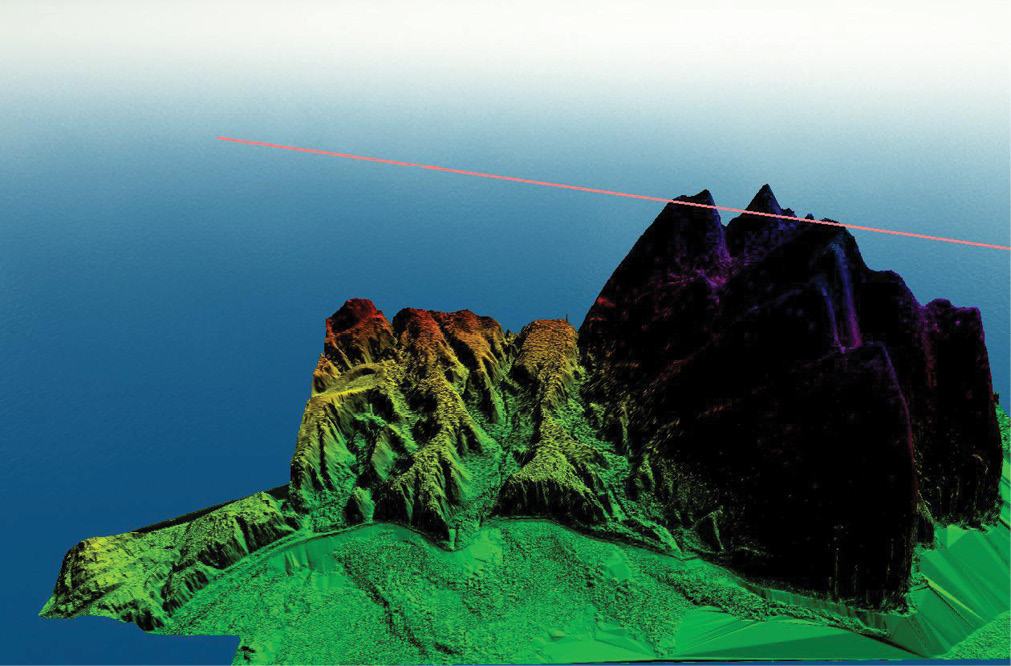
Figure 4: Topobathymetric lidar bare-earth digital elevation models of an area of the coastline of Puerto Rico near landfall of Hurricane Maria. Figure 4A shows Riegl VQ-820-G (2015) lidar data pre-Maria. Figure 4B shows CZMIL (2018) lidar data post-Maria. The pink line indicates the northwestern direction of Hurricane Maria as it passed through the alcove.
In mid-2018, USGS and NOAA tasked Dewberry to resurvey the entire island (both topography and bathymetry) and to remap the coastline following the hurricane events. Poor weather conditions in late 2018 resulted in low visibility through the water column and delayed data collection. Dewberry completed this acquisition with a new Riegl VG-880-G II sensor in June 2019.
 Thus, there were three topobathymetric lidar surveys—a NOAA survey (2015/16), a JALBTCX survey (2018) and a NOAA/USGS/Dewberry survey (2019)—of the coastline of Puerto Rico within a four-year timespan; including pre- and post-Maria surveys. Table 1 and accompanying notes detail the specifications of the three surveys. Although there were temporal and sensor differences for the three surveys, the general specifications, in terms of topographic and bathymetric point density, and horizontal and vertical accuracy, were very comparable to each other.
Hurricane Maria moved across the island on a northwestern trajectory for 30 hours, battering the island with rain and winds, until it exited the island to the west of Arecibo. We will focus attention on two locations: a 2.1 km2 area near Yabucoa Municipality, located on the southeastern side of the island close to where Maria made landfall; and a recreational area, Crash Boat Beach, on the northwest side of the island, in a vicinity affected by both Hurricane Irma and Hurricane Maria.
Landfall near Yabucoa municipality
 On 20 September 2017, Hurricane Maria made landfall in a sparsely populated area along the southeastern portion of the island near Emajagua (Figure 2) at 1015 UTC as a high-end Category 4 hurricane with winds of 155 mph. The southern portion of the island was hardest hit by the hurricane with hundreds of homes in the towns of Yauco, Guanica and Guayanilla collapsing.
Table 2 shows a detailed summary of the changes to the shoreline within the 2.1 km2 area near Yabucoa. While the total length of the continuous coastline increased by only approximately 202 m, the sinuosity coefficient, as measured within this area of interest, increased by 7%. These increases indicate that the hurricane not only changed the length of the shoreline, but also affected its shape. The most obvious shoreline features, the isolated sand bars, increased by nearly 25% in number, but decreased in average area and perimeter. Although the net shoreline change was an increase following the hurricane, the actual shoreline movement was very local. These changes are illustrated in Figure 3.
Figure 3A shows a site within the 2.1 km2 landfall area of interest, where Hurricane Maria resulted in approximately a 3 m deposition of material to the shoreline. In this alcove area, the hurricane pushed sands and sediments toward the shoreline at a uniform rate. In Figure 3B, which shows an area approximately 1 km further eastward along the coast, in a less protected location, and hence further from the hurricane landfall, there are many areas where Hurricane Maria moved sediments away from the shoreline. It is also seen in Figure 3B that many isolated sand bars (small polygonal areas) have been formed as a result of the hurricane scouring the sands and sediments. Although these shoreline changes, which are the focus of the NOAA Coastal Mapping projects, are noteworthy, the nearshore topobathymetric lidar illustrates more dramatic effects of the hurricane.
Figure 4 presents the topobathymetric lidar in the small cove (Figure 3A) before (Figure 4A; Riegl VQ-820-G) and after (Figure 4B; CZMIL) Hurricane Maria made landfall. Note that the 2019 Riegl VQ-880-G II data was collected closer to the shoreline for mapping and did not extend into the ocean. The seaward area in the pre-Maria lidar (Figure 4A) is shelf-like in appearance. The sands and other sediments are evenly distributed in the foreground. This is in sharp contrast to the rough appearance of the foreground area in Figure 4B. Hurricane Maria pushed the sands and sediments landward, resulting in mounding and uneven distribution.
Exit near Boat Crash Beach (northwestern side of Puerto Rico)
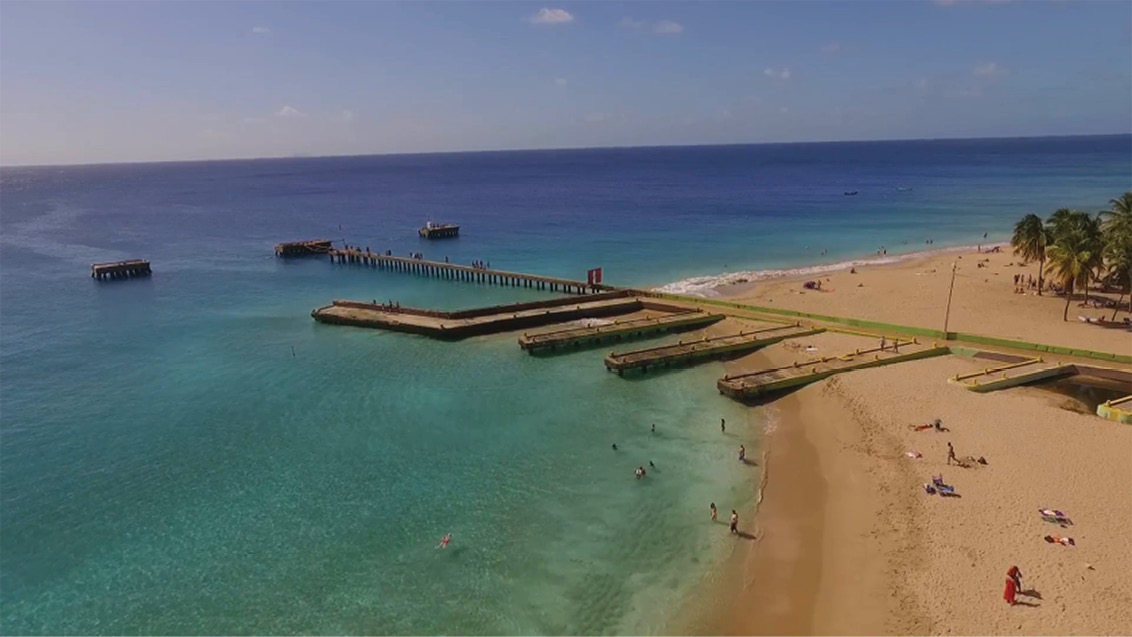
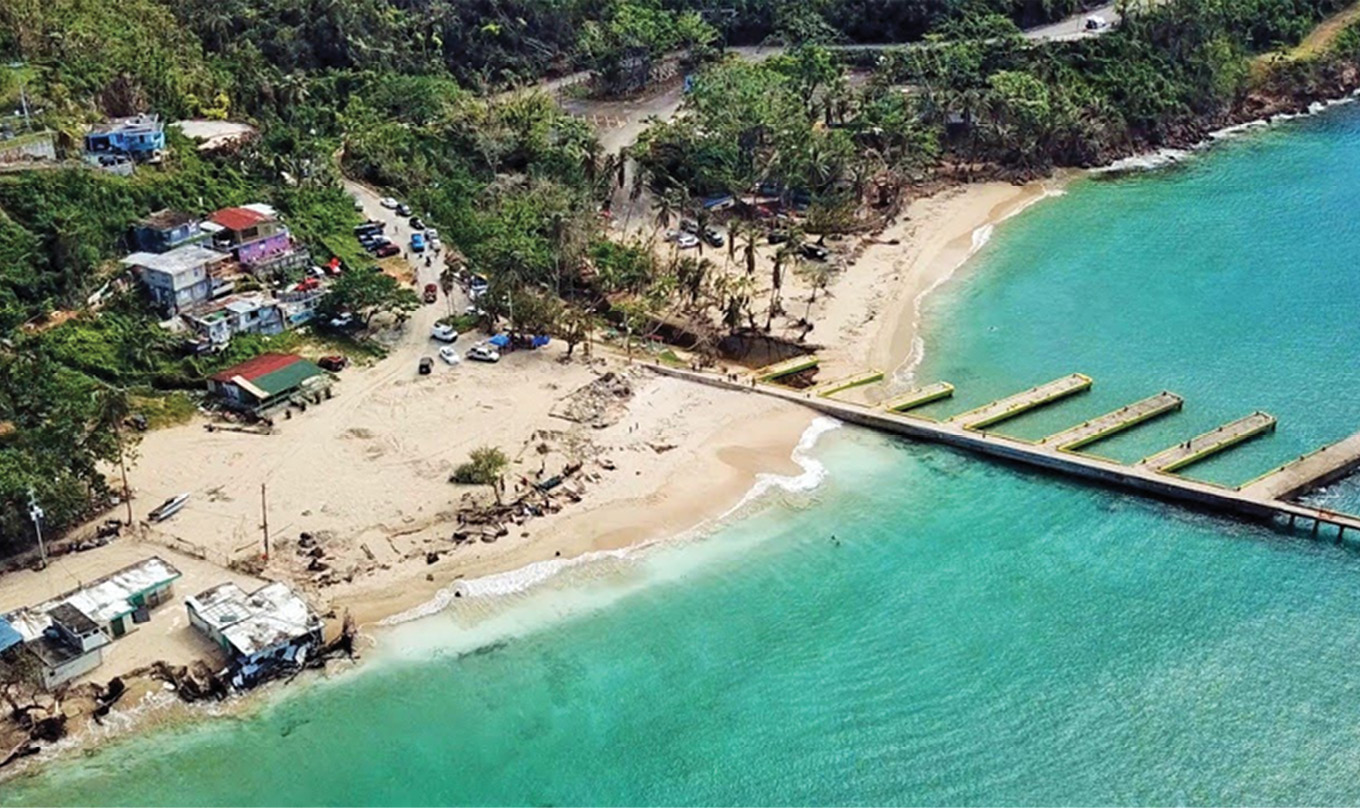
Figure 5: Oblique pictures of Crash Boat Beach prior to Hurricane Maria (Figure 5A), and shortly after the hurricane (Figure 5B).
After nearly 30 hours of battering Puerto Rico with heavy rains, over 500 mm in most spots, and winds of 145 mph or more, Hurricane Maria exited Puerto Rico on 21 September 2017 as a Category 3 hurricane. The meteorological values are estimates, because the monitoring stations on Puerto Rico were incapacitated owing to damage from Hurricane Irma, two weeks prior to Hurricane Maria.
Crash Boat Beach (Figure 5), on the northwestern side of the island, is a resort area used by both locals and tourists. It is the most popular beach in the region. The main attractions are water sports favored by the crystal clear, turquoise waters, including diving, snorkeling, swimming and surfing. Hurricane Maria exited Puerto Rico in this vicinity as a Category 3+ storm. On the exit path of the hurricane, we observed severe beach erosion as the storm carried sands and sediments seaward. The degree of beach erosion is evident in the before (Figure 5A) and after (Figure 5B) images. Comparing these images clearly illustrates that boat docks partially buried in the sands pre-Maria were exposed in the ocean (Figure 5B) post-Maria.
 The severe beach erosion is also apparent in viewing profiles of the NOAA 2016 (before) and JALBTCX 2018 (after) topobathymetric data (Figure 6). As the JALBTCX 2018 topobathymetric lidar was captured prior to the NOAA/USGS/Dewberry 2019 lidar, and the two surveys are indistinguishable from each other, Figure 6 uses the former as the post-Maria surface and shows a comparison between the NOAA (2016, in green) and JALBTCX (2018, in yellow) profiles. The arrows in Figure 6 point to the coincident locations on the 2019 aerial image and the lidar profile. Clearly, the beach that was at the arrow location in the 2016 data has receded, and the extent can be measured in the topobathymetric lidar. Similarly, the materials were carried seaward and resulted in deposition on the western (left) side of the profile.
Lessons learned

Figure 6 Profile view showing beach erosion along Crash Boat Beach. Bright-green points are from the NOAA 2016 lidar survey; yellow points are from the JALBTCX 2018 lidar survey. The arrows indicate the same locations on the imagery and profiles.
As a result of a combination of circumstances—the NOAA Shoreline Mapping Program and an unusually severe hurricane season in 2017—three topobathymetric lidar surveys were conducted along the coast of Puerto Rico between 2015 and 2019. This lidar time series illustrates:
- The dynamic nature of shorelines requires repeated surveys, particularly in areas where natural forces may produce extreme effects.
- Topobathymetric lidar is invaluable for measuring beach recession and accretion as illustrated in these repeat surveys. Topobathymetric lidar technology works very well in the tropical waters on the Caribbean.
- It is important to have “before and after” surveys. Baseline surveys at repeated intervals should be conducted, therefore, so that the changes can be captured when a natural disaster occurs.
Acknowledgements
We thank the United States Geological Survey, National Oceanic and Atmospheric Administration, Joint Airborne Bathymetric Lidar Technical Center of Expertise, Commonwealth of Puerto Rico, and the National Park Service, which funded these projects. We also thank Tim Saultz and Gail Dunn of USGS, Mike Aslaksen of NOAA National Geodetic Survey, and Jennifer Wozencraft and Chris Macon of JALBTCX for their coordination efforts and overall support.
Alvan “Al” Karlin, PhD, CMS, GISP is a senior geospatial scientist at Dewberry, formerly from the Southwest Florida Water Management District (SWFWMD), where he managed all of the remote sensing and lidar-related projects in mapping and GIS. With Dewberry, he serves as a consultant on Florida-related lidar and imagery projects, as well as general GIS-related projects. He has a PhD in computational theoretical genetics from Miami University in Ohio. He is the immediate past president of the Florida Region of ASPRS, an ASPRS Certified Mapping Scientist – Lidar, and a GIS Certification Institute Professional.
Raymond Miller, Jr., CP, CMS, GISP is a project manager in Dewberry’s Tampa, Florida, office. He has extensive experience in GIS, remote sensing, and relational database management. He has developed geospatial solutions for water resources, floodplain mapping, and hazard mitigation projects for clients that include the SWFWMD, NOAA and the Florida Division of Emergency Management. His experience includes lidar data production and analysis, digital terrain modeling, watershed evaluation and management planning, floodplain mapping, and geodatabase management. He is a Certified HAZUS Professional, ASPRS Certified Mapping Scientist – Remote Sensing, and a GIS Certification Institute Professional.
Amar Nayegandhi, CP, CMS, GISP is a senior vice president and director of remote sensing at Dewberry. He oversees the geospatial and technology services group for Dewberry’s contracts with federal, state, and commercial clients. With more than 20 years of experience, he is a recognized expert in topographic and bathymetric lidar data acquisition and processing. Amar has a bachelor’s degree in electrical engineering from the University of Mumbai and a master’s degree in computer science from the University of South Florida. He is a former director of the ASPRS Lidar Division, an ASPRS Certified Photogrammetrist and Certified Mapping Scientist – Remote Sensing, and a GIS Certification Institute Professional.