
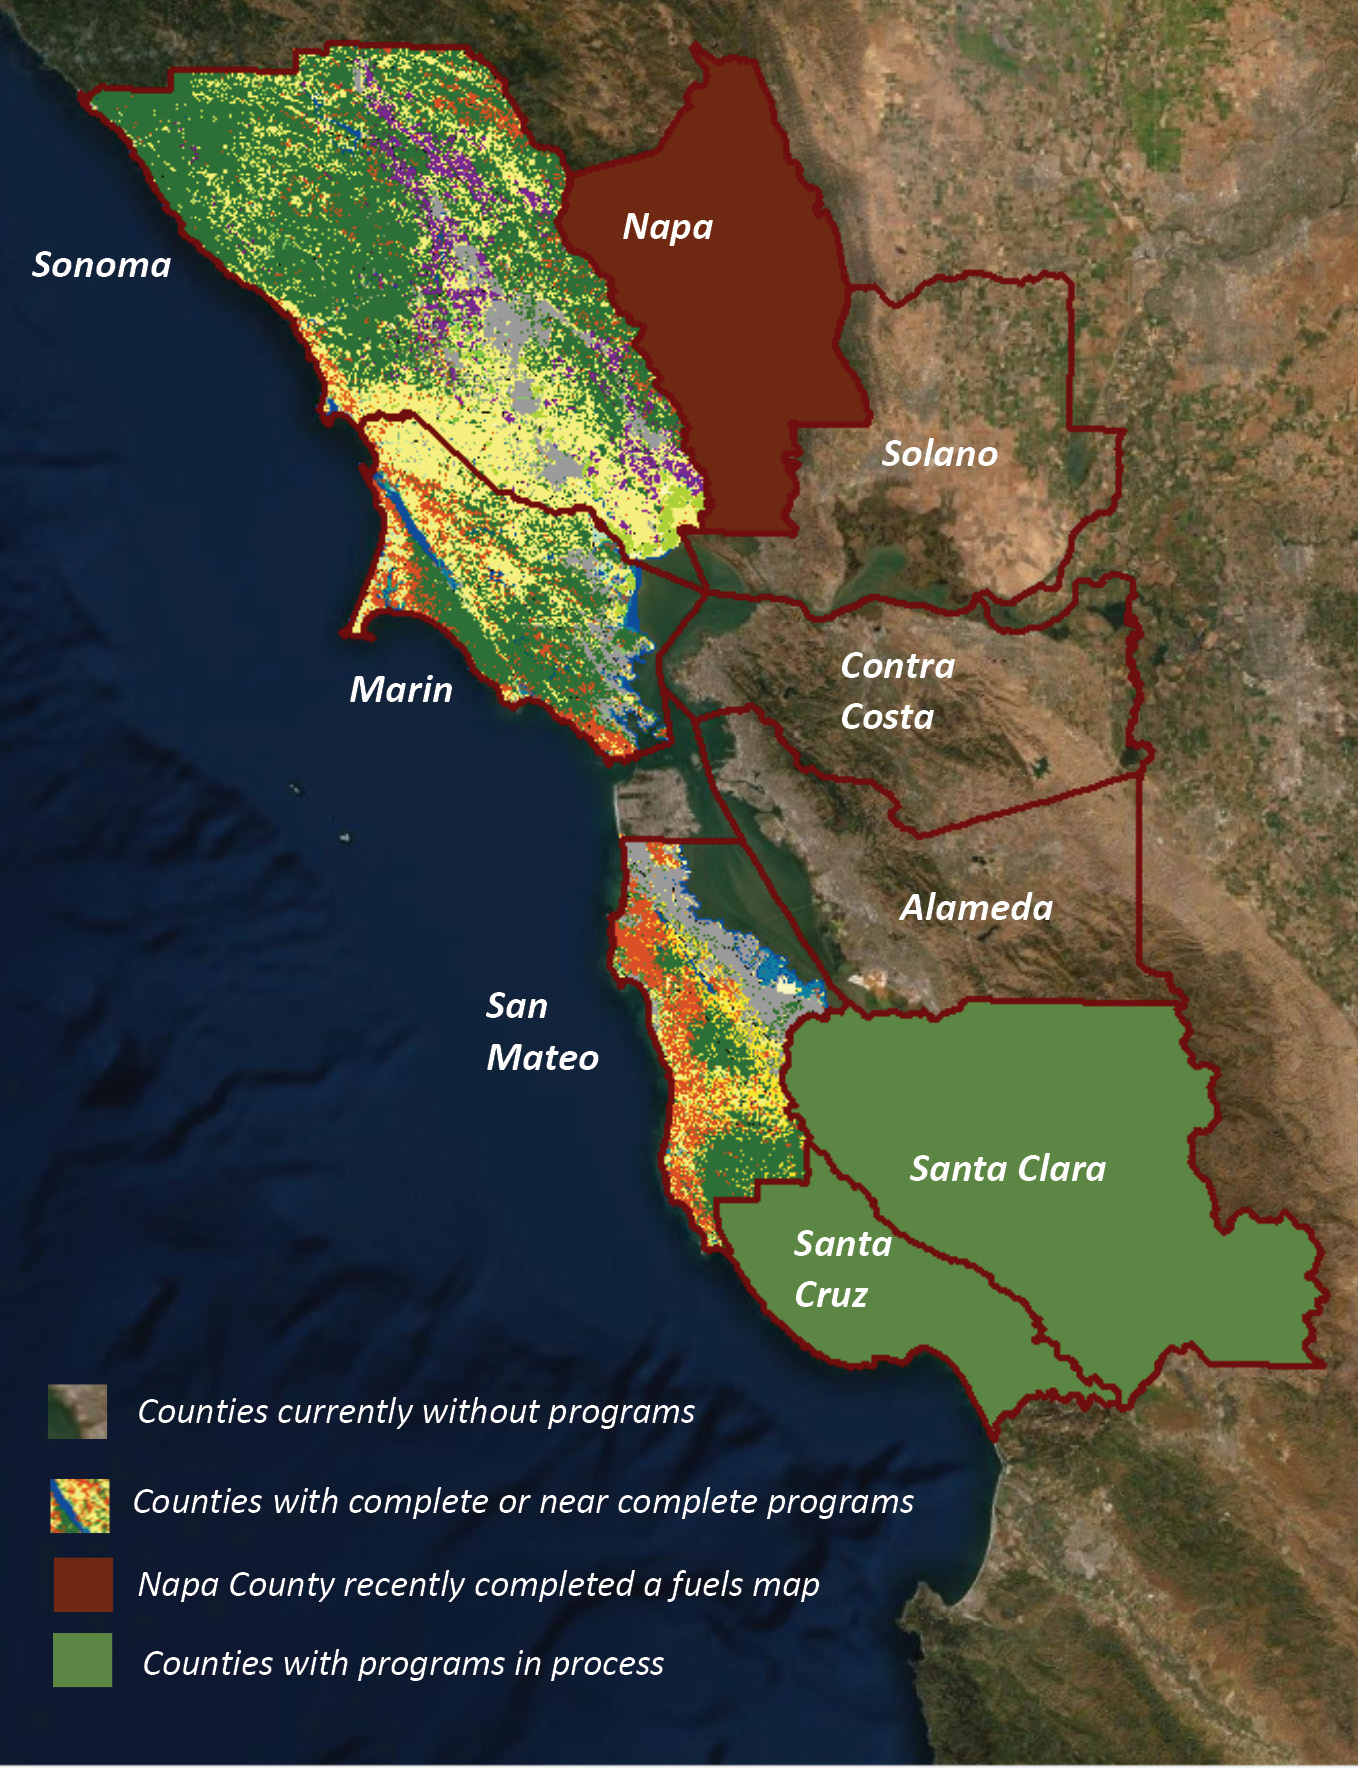
Figure 1: San Francisco Bay Area counties with fine-scale vegetation and landscape data programs.
San Francisco Bay Area land managers and stewards have the responsibility of caring for one of the most populated, but also most ecologically rich and beloved places in the United States, if not the world. Home to 7.7 million people and 1.4 million of acres of protected open space, the area’s wild and working lands provide residents and visitors with water, varied recreation opportunities, scenic vistas, wildlife habitat, and vital refuges for many threatened, endangered, and special status species. Conversely, the Bay Area also experiences dramatic natural disasters from floods to earthquakes, and, most recently, intensifying wildfires.
To effectively care for the Bay Area’s ecosystems and infrastructure and prepare for natural disasters, citizens, landowners, politicians, managers and government agencies must know the location and distribution of resources across the landscape over time. Managing and monitoring carbon stocks, fire and flood hazards, critical habitat and climate resiliency require up-to-date, fine-scale maps and databases of the area’s vegetation and topography. Without accurate maps, there is no way to plan for and comprehensively measure and monitor the impact of human decisions and natural disasters on Bay Area landscapes over time.
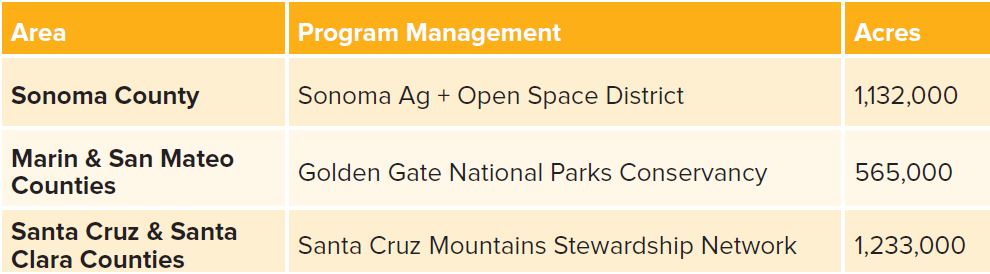
Table 1: Fine-scale vegetation and landscape database programs in the San Francisco Bay area.
Until recently there have been serious gaps in knowledge about the landscapes of the Bay Area. Existing vegetation maps were piecemeal, out of date, or at a statewide scale incapable of supporting local decision-making. Topographic data was coarse or non-existent. As a result, managers and decision-makers labored with maps that were severely out of date, crude, and often incorrect. Over the last seven years, however, numerous organizations in the Bay Area have banded together to create consortia for funding fine-scale vegetation and landscape data sets for much of the region, including Sonoma, Marin, San Mateo, Santa Clara, and Santa Cruz counties (Table 1 and Figure 1). Each of these programs includes the collection of QL1 lidar data to support a variety of applications ranging from vineyard management, to wildfire risk mitigation and response, flood planning, conservation easement prioritization, tax assessment, wetland restoration, endangered species habitat protection, and engineering. This article summarizes the evolution of these programs, focusses on innovative uses of the programs’ lidar data, and highlights the factors which led to the programs’ success.
Program evolution
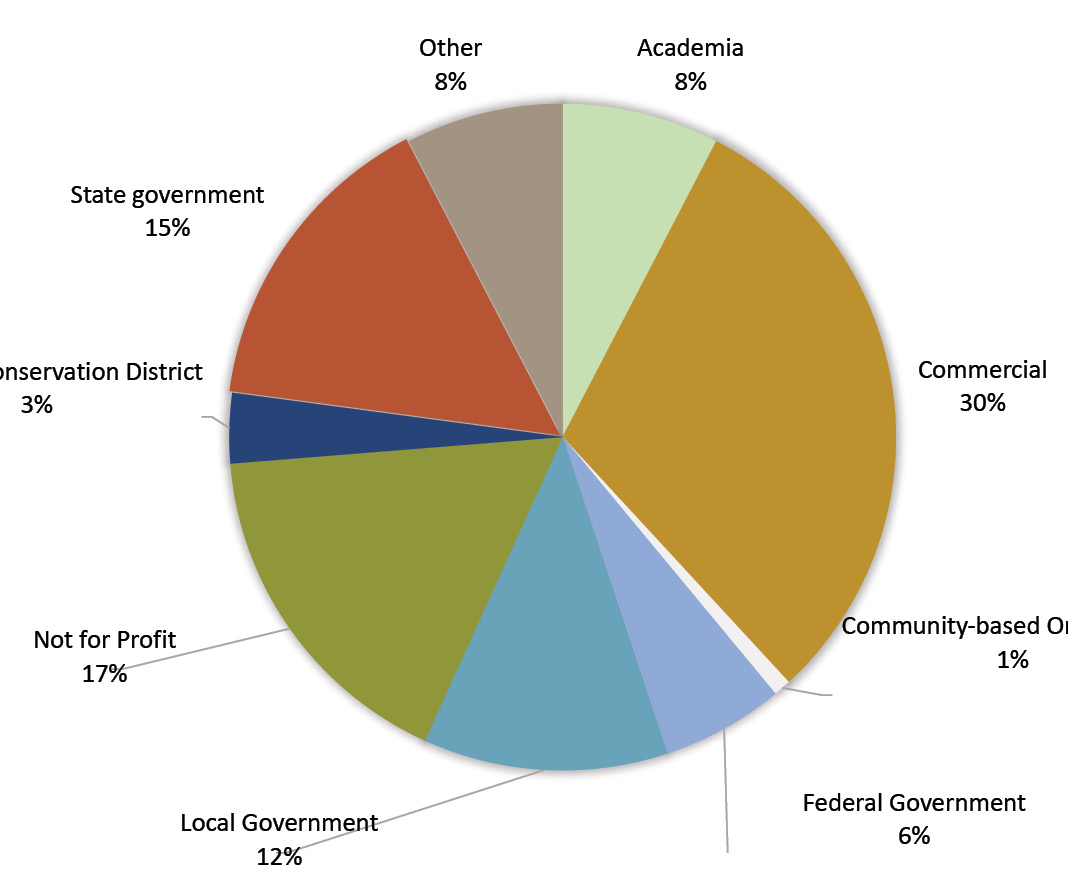
Figure 2: The broad base of users of Sonoma Ag + Open Space program products. Source: Sonoma County Ag + Open Space Lidar and Veg Map User Survey (2019).
When Sonoma’s Ag + Open Space District1 conceived of the first Bay Area vegetation and landscape program, it was initially focused on vegetation mapping only, and the District did not include lidar data because of its expense and the perception that lidar data could add little to the program. Through a series of fortunate events, however, the District was simultaneously included in a successful proposal to NASA’s Carbon Monitoring System by Ralph Dubayah and George Hurtt of the University of Maryland (grant NNX13AP69G). Upon award of the NASA grant, plus additional funding from USGS’s 3DEP program, the District contracted with Quantum Spatial2 to capture QL1 lidar for all of Sonoma County along with the 6-inch resolution, 4-band imagery already slated to be collected to support the mapping program. Upon delivery, the value of the lidar data was instantaneously recognized. As stated by Karen Gaffney, conservation planning manager at Sonoma County Ag + Open Space, “It was a revelation. We immediately understood the value of the lidar data for guiding our land conservation investments, and then there was a rapid emergence of multiple uses and applications. Not only did the lidar data improve the quality of the vegetation maps, it also supported climate change action, public safety, biodiversity protection, agricultural conservation, and watershed health. There was an amplified impact—it felt like 1 + 1 equaled 1000.”
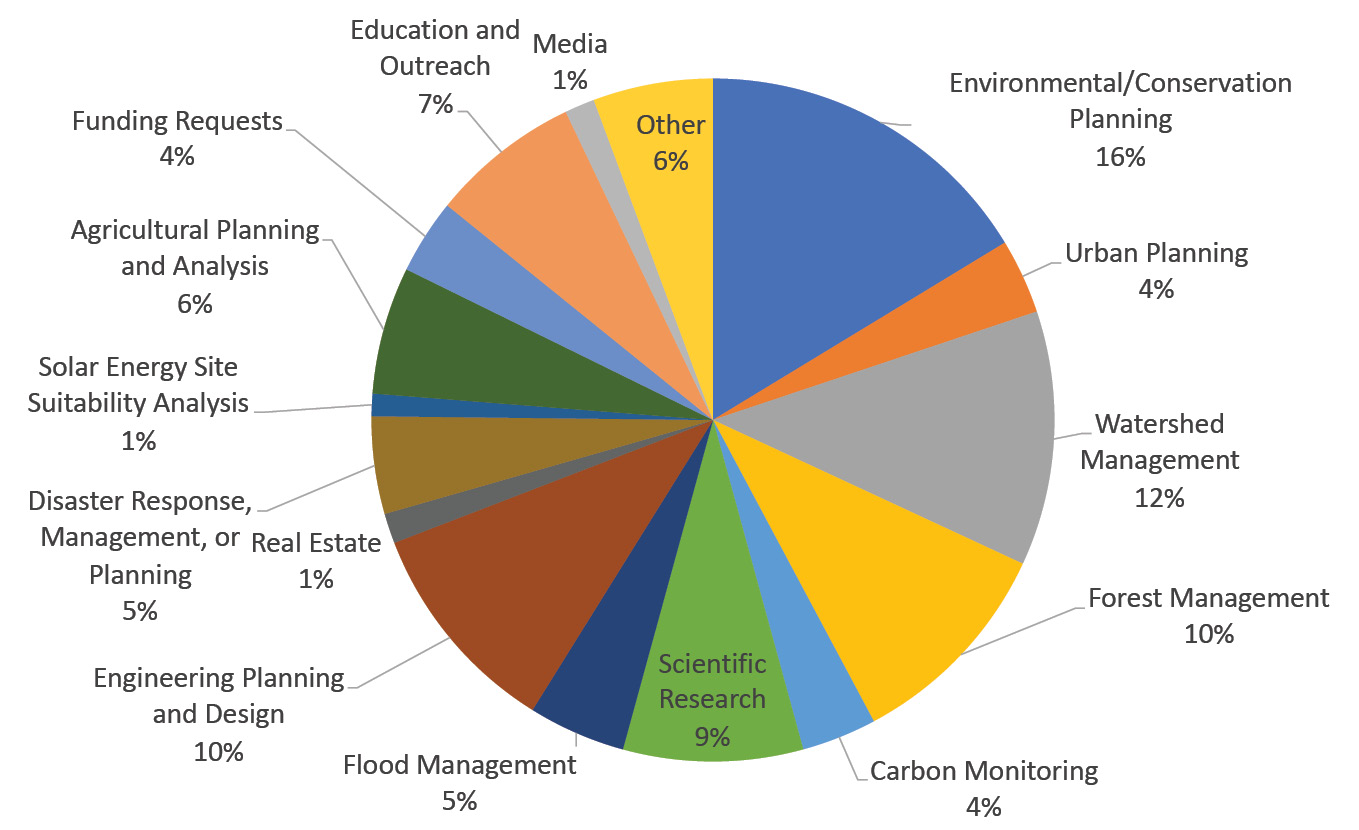
Figure 3: Wide-ranging applications of Sonoma Ag + Open Space program products. Source: Sonoma County Ag + Open Space Lidar and Veg Map User Survey (2019).
Shortly after the ground-breaking Sonoma County fine-scale vegetation map and landscape database products were made public in 2017, One Tam3 decided to move forward with a similar project, which was initially scoped to include only Marin Municipal Watershed District, National Park Service lands, and county and state park lands in Marin County. However, awareness of the project grew quickly and before long the consortium raised enough funding to map the entire county, with the program managed by the Golden Gate National Parks Conservancy4. Soon, interest spread to organizations in San Mateo County, and funds were raised to expand the program to include all of San Mateo County. To date most of the products for this program have been delivered, with the final product—the fine-scale vegetation maps—scheduled for completion in May 2021 for Marin County, and in January 2022 for San Mateo County.
Primarily because of the usefulness of the Sonoma fine-scale data in understanding the behavior of the Sonoma 2017 Complex wildfires, another consortium, the Santa Cruz Mountains Stewardship Network (SCMSN)5, expressed interest in creating similar fine-scale products for Santa Clara and Santa Cruz Counties. Funding has been raised and that program is well underway.
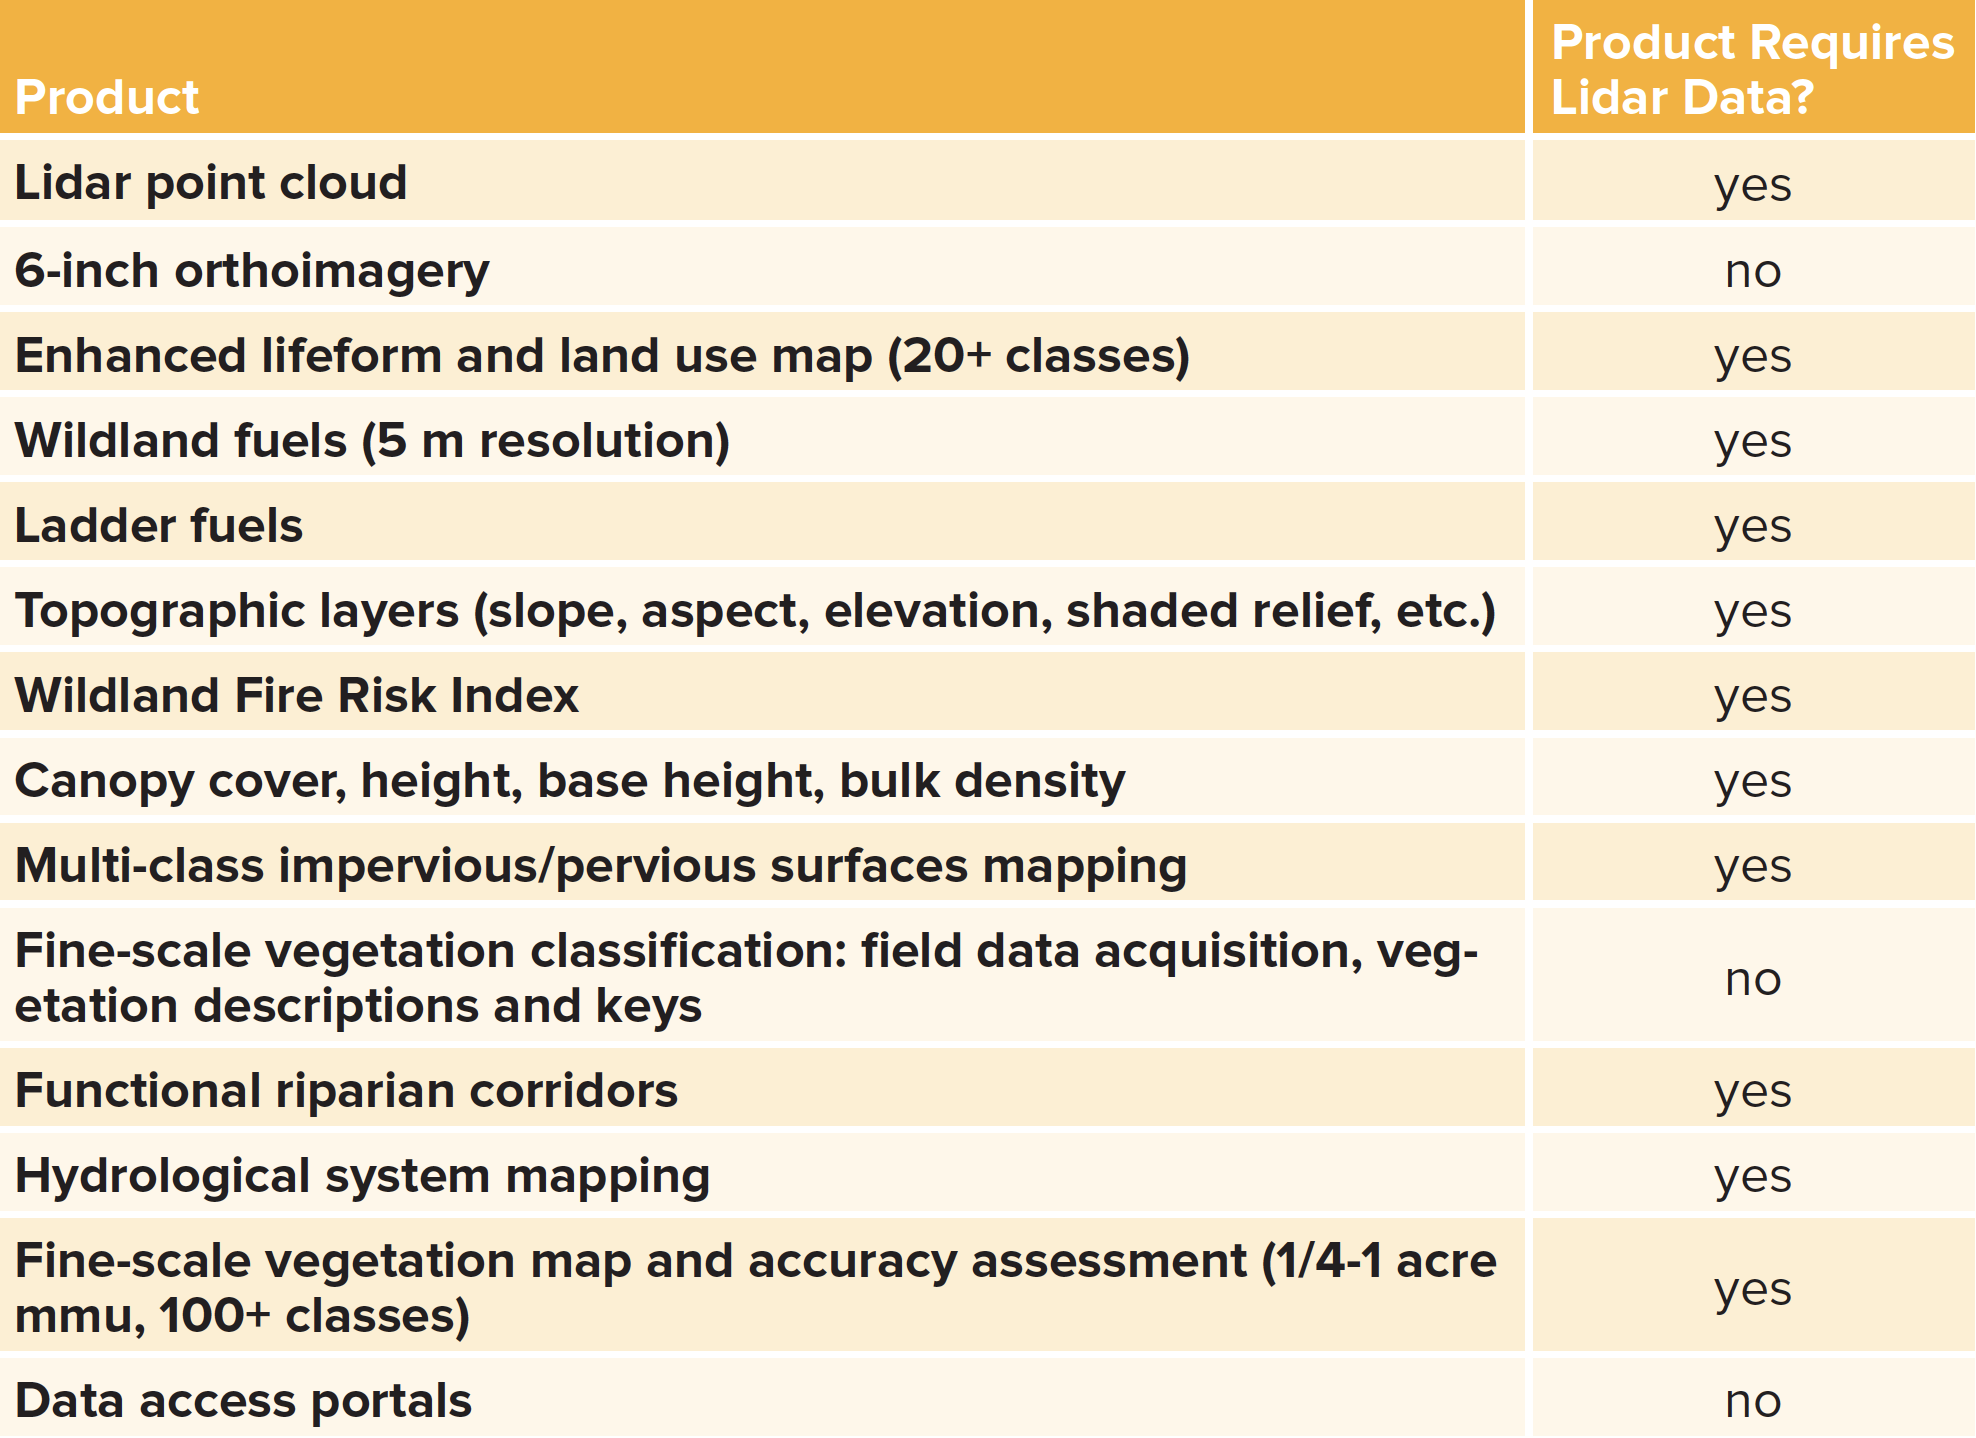
Table 2: Products created for the San Francisco Bay Area fine-scale vegetation mapping and landscape database programs. Products delivered vary by county.
Lidar data is critical to the creation of most of the fine-scale products being created across the five-county area (Table 2). Danny Franco, project manager at the Golden Gate National Parks Conservancy, recently expressed the value of the lidar data to these programs, “Lidar has become a foundational component for planning climate adaptation strategies and environmental conservation at the regional scale because with lidar we can measure, locate, and quantify landscape variables essential to prioritizing and designing projects, as well as tracking change over time. Lidar data and derivative products are the cornerstone of our landscape level strategic planning efforts.”
Example applications

Figure 4: Lidar-derived slope in riparian corridors is used in flood hazard assessments. Source: Tukman Geospatial.
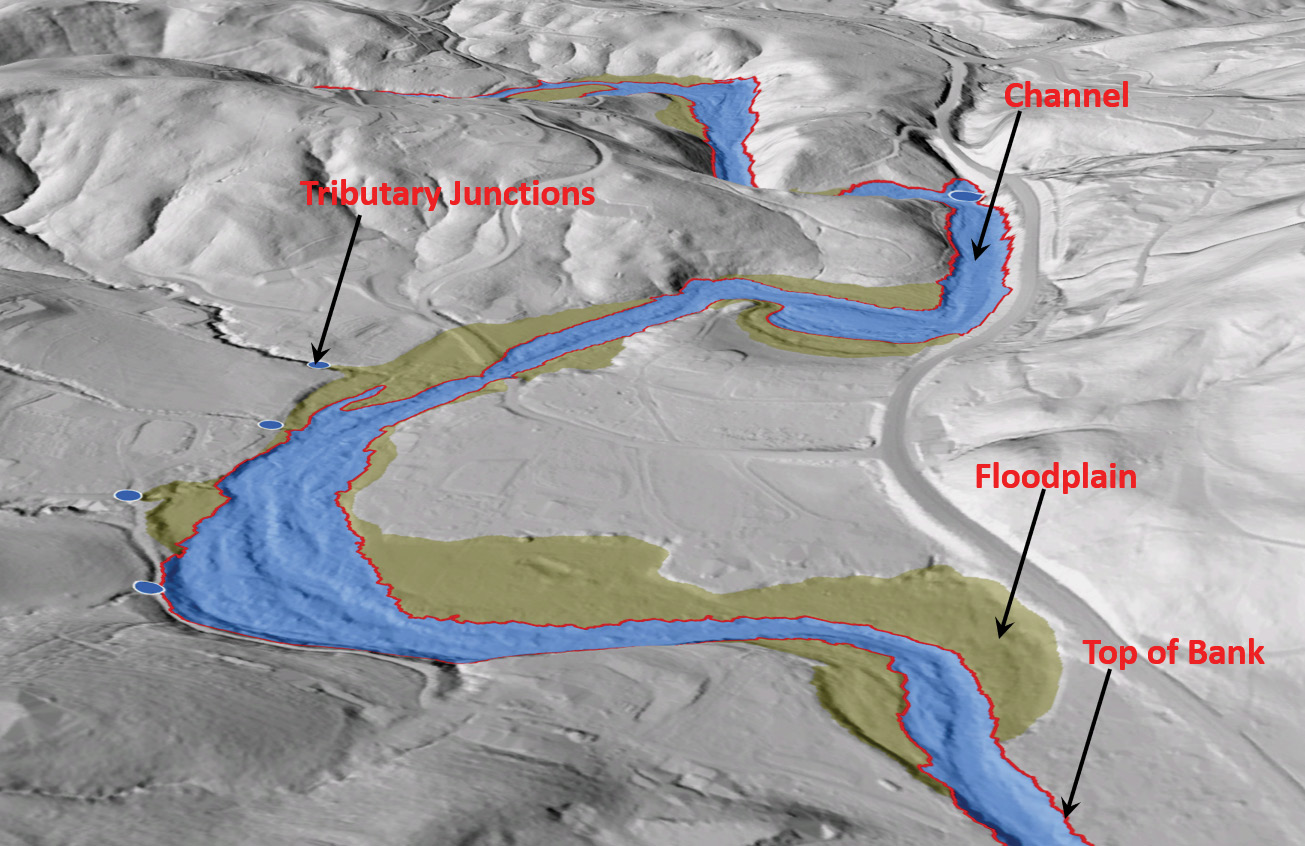
Figure 5: Functional riparian corridor map used in riparian restoration and conservation planning. Source: Tukman Geospatial.
Figures 2 and 3 display the results of a survey of users conducted by the Sonoma Ag + Open Space District in 2019 that shows the diversity of users and applications of Sonoma’s data sets. This diversity in use and application of program products has extended to the other four counties. Applications of the lidar data in the five-county area include vegetation and wildland fuels mapping, pre-construction site assessments, modelling of flood inundation (Figure 4), forest health assessments, landslide and debris flow risk analysis, functional riparian corridor mapping (Figure 5), bird density modelling, impervious/pervious mapping, prioritizing and planning field work and site assessments, improving the National Hydrological Dataset, wildlife habitat gap analysis, and identification of late seral forest habitats. This section focuses on two applications, vegetation mapping and wildfire risk assessment and response.
Vegetation mapping
Remote sensing analysts make maps by exploiting the relationships between variation on the ground and variation in the data being used to create the map (e.g., imagery, slope, aspect, elevation). Common data elements relied upon include tone/color, shape, size, pattern, shadow, texture, location, context, date, and height. Until the advent of lidar, fine-scale measures of vegetation height were unavailable, or very expensively obtained from stereo imagery. Lidar data provides not only fine-scale measures of vegetation height, but also measures of crown shape, crown density, and canopy base height. Additionally, lidar data can provide high-resolution riparian corridor delineation, and measures of slope, slope position, aspect and elevation—all critical variables that affect vegetation species distribution, and are, therefore, useful in creating a vegetation map. As a result, lidar data supports increased map detail, while also reducing costs and improving map accuracies. “Lidar data allows us to see underneath the canopy and measure the structure of the vegetation and the geomorphology of the landscape,” said Mark Tukman of Tukman Geospatial6, the mapping contractor for the Bay Area programs. “When used to develop independent variables for machine learning, mapping accuracies improve because so many of the lidar variables are significant predictors of vegetation type. In essence, lidar brings the landscape into focus”.
Wildfire risk assessment and emergency response
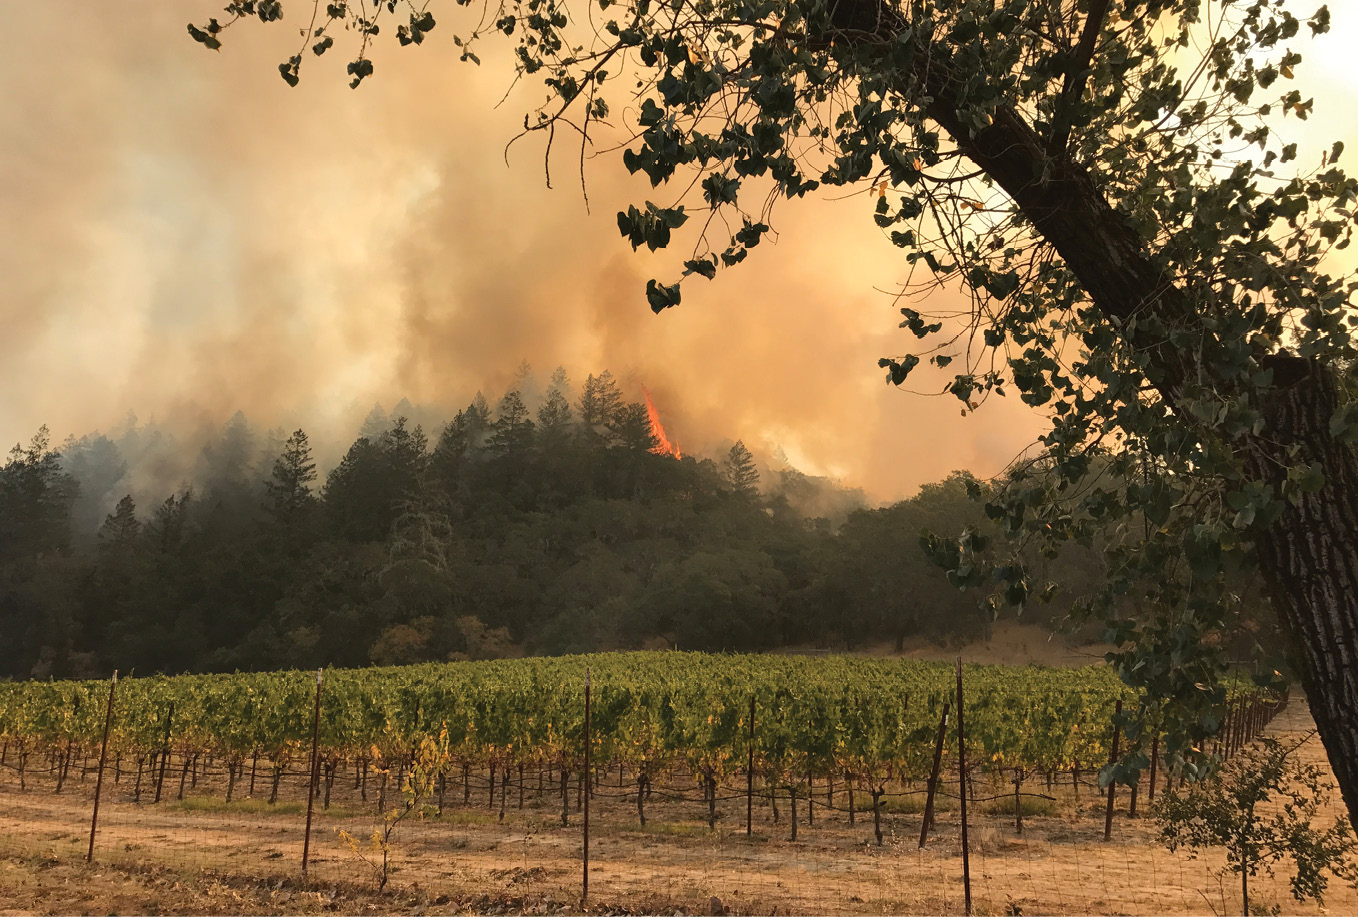
Figure 6: Wine Country fires threaten agriculture and homes. Source: Karen Gaffney.
In the late evening hours of October 8, 2017, six separate wildfire events ignited almost simultaneously in California’s counties of Sonoma, Mendocino, and Napa. Collectively known as the Wine Country Fires, they were driven by raging northeasterly winds and consumed all types of fuel in their pathways, ranging from cozy suburban enclaves to urban businesses and schools, vineyards, ecological preserves, parks, ranchlands, and forests. When finally contained 20 days later, the fires left 43 people dead, at least 6625 structures destroyed, 90,000 residents displaced and a total of over 198,800 acres burned (Figure 6).
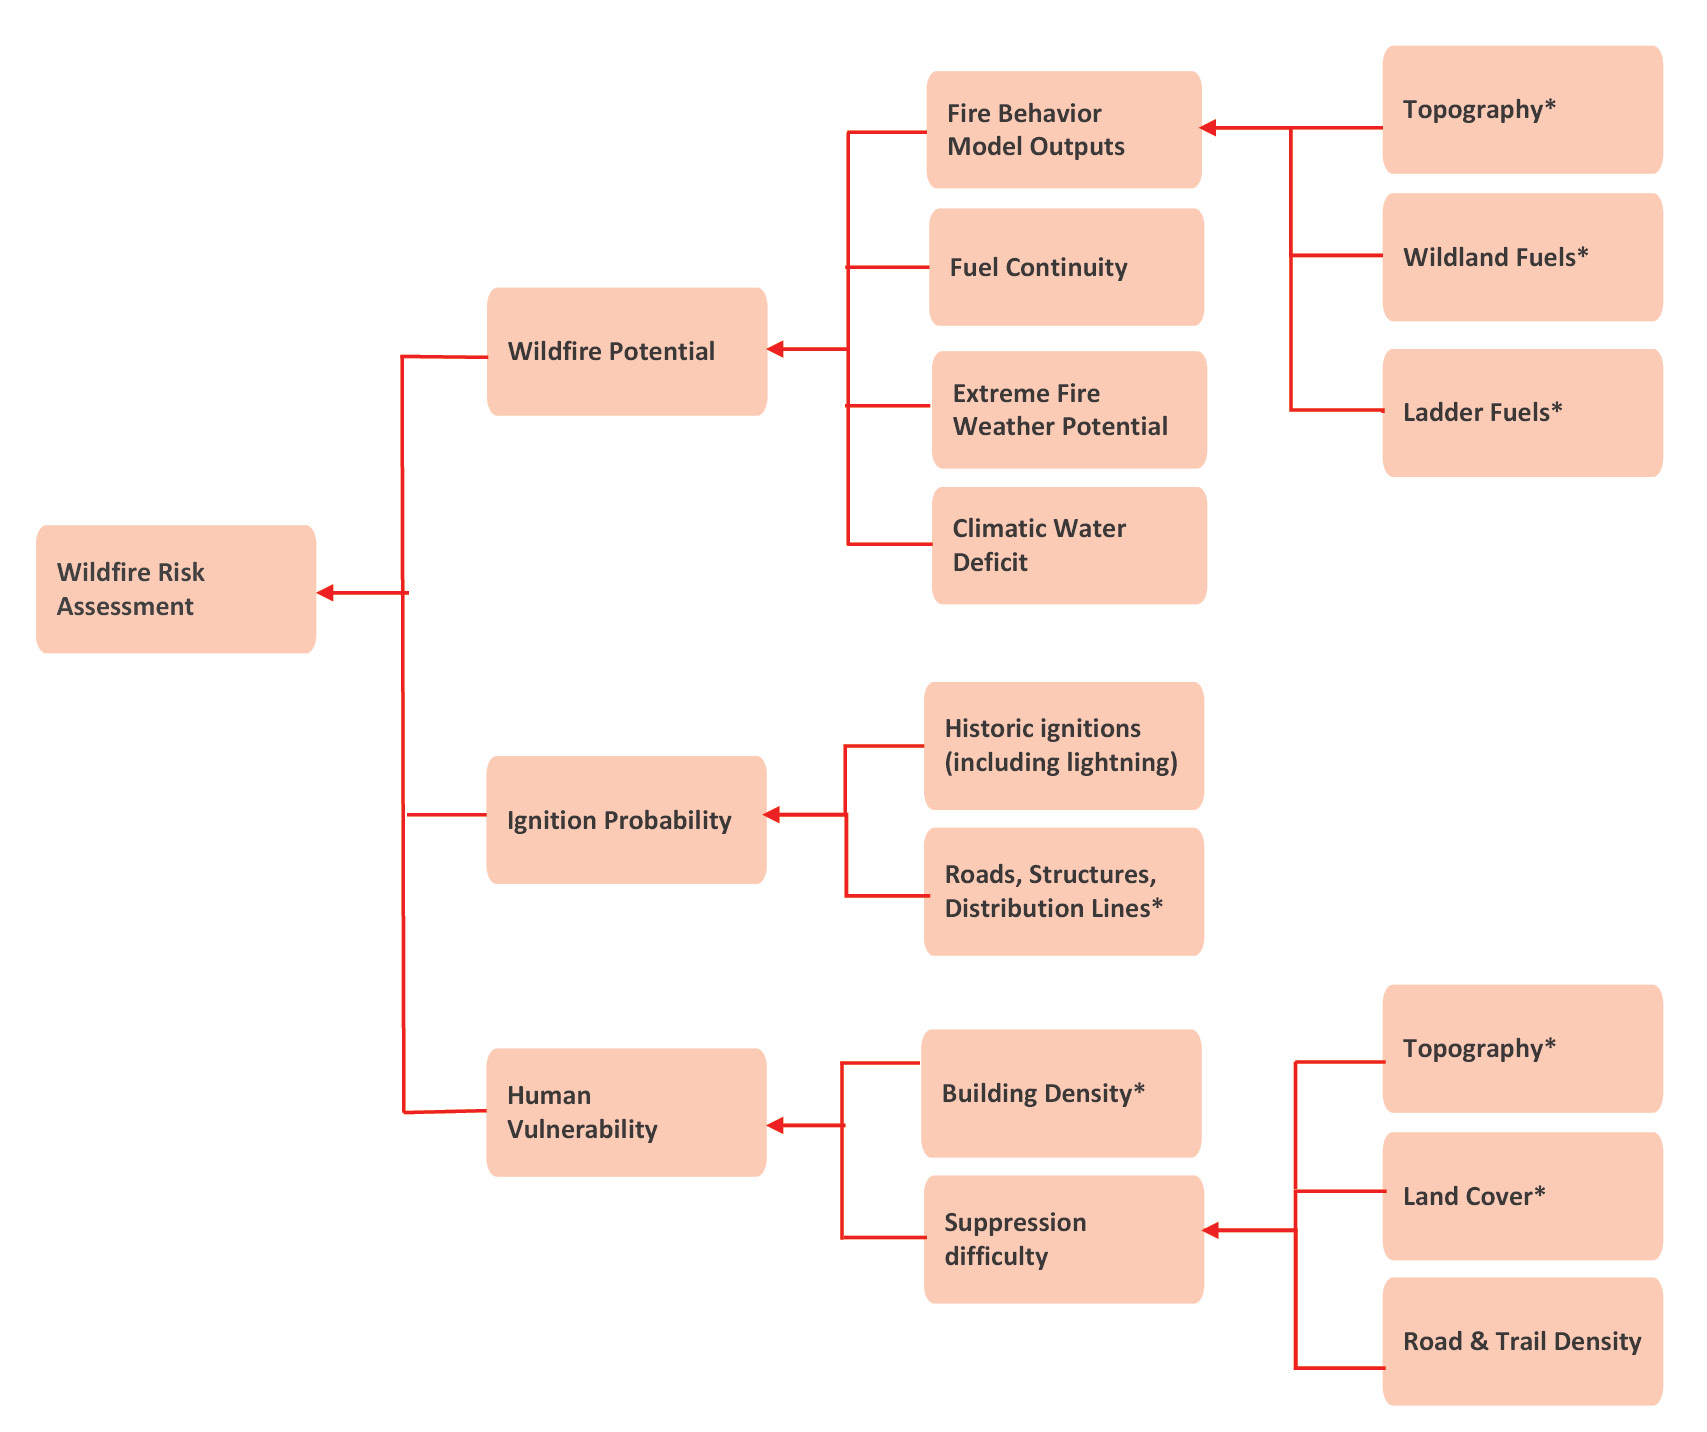
Figure 7: Conceptual model for the Wildland Risk Indices being developed for Sonoma, Santa Clara and Santa Cruz Counties. Layers with an * require lidar data.
Soon after the fires were extinguished, Sonoma Ag + Open Space successfully submitted a proposal for Rapid Response funding from NASA to immediately analyze the impact of the fires on the landscape, and to fully identify the landscape characteristics that contributed to the wide variety of fire behavior. The resulting analysis showed that six variables—ladder fuels7, canopy density, vegetation type, weather/climate variables, slope, and distance from streams—were the primary drivers of post-fire woody canopy condition following the fires8. Incredibly, five of the six variables were created using lidar data. The identification of ladder fuels as an important predictor of wildfire impacts was a major impetus that led each of the three Bay Area programs, plus Napa County, to include maps of wildland fuels and ladder fuels in their wildfire planning and prevention projects. Sonoma, Santa Clara, and Santa Cruz are also moving forward with the development of county-wide Wildfire Risk Indices, also based heavily on lidar products (Figure 7).
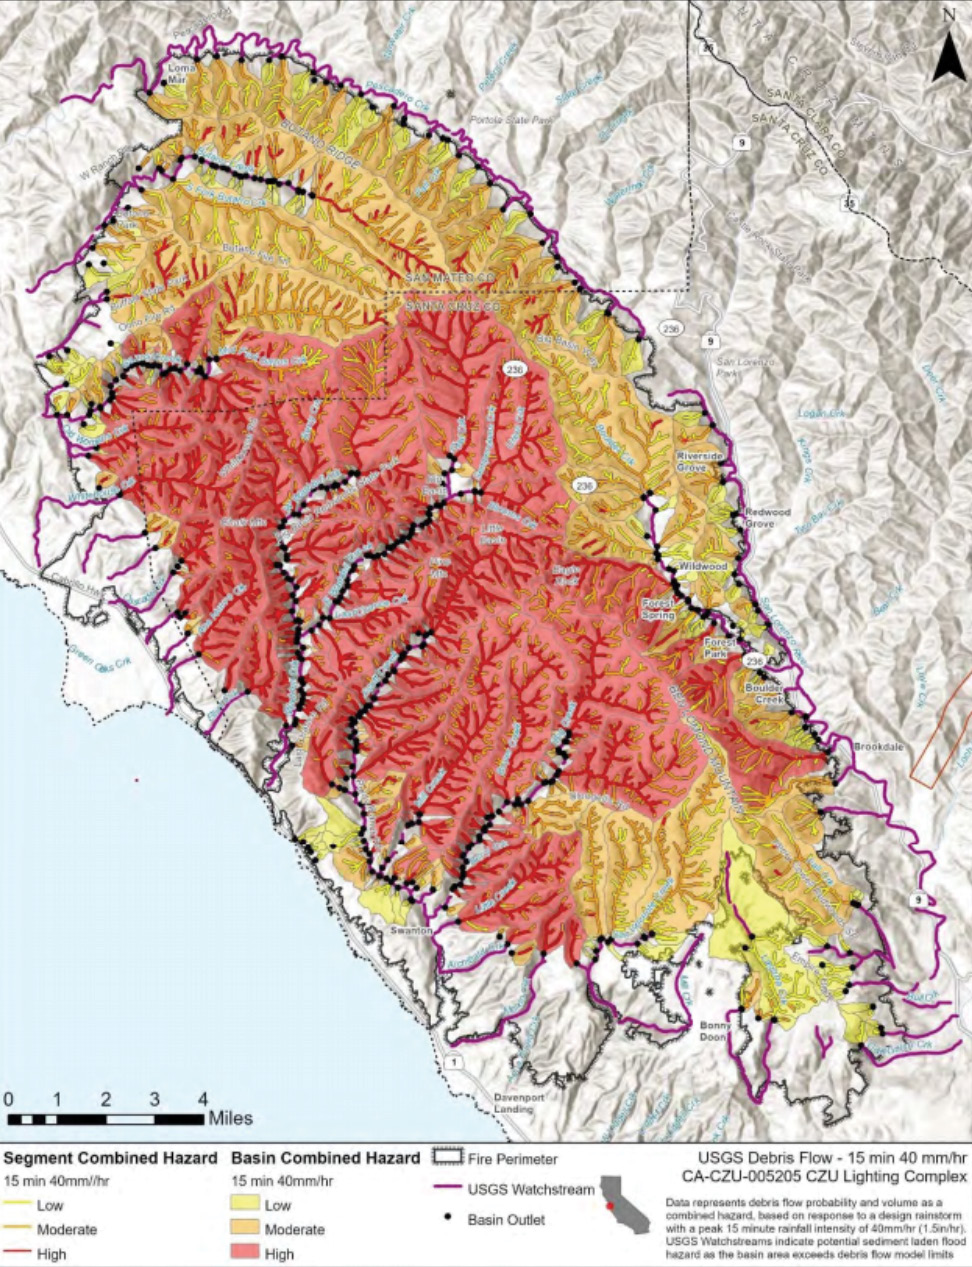
Figure 8: Watershed Emergency Response Team evaluation of CZU Lightning Complex CA-CZU-005205 October 1, 2020.
Lidar products have also been critical in post-fire emergency response. As part of the Santa Clara and Santa Cruz program, SCMSN had QL1 lidar flown for Santa Cruz County in the early summer of 2020 by Quantum Spatial. The point cloud was delivered very shortly before a lightning storm initiated the CZU Complex fires on August 16, 2020. Tukman Geospatial was able to quickly produce a canopy height model, normalized digital surface model, hillshade, and digital terrain model from the Santa Cruz lidar data, which was immediately made available to the public on Midpeninsula Regional Open Space District (a network member) servers. Agency use of the products was widespread and the products were quickly incorporated into the work of Cal Fire and the California Department of Conservation for their CZU Watershed Emergency Response Team (WERT) evaluations of landside and debris flow risk in the burn areas9 (Figure 8). As Rich Sampson, Cal Fire San Mateo and Santa Cruz Division Chief mentioned, “The lidar derived topographic layers delivered in the immediate aftermath of the CZU fire prompted the WERT team to remark that they felt as though their work had finally entered the 21st century.”
Factors for success
While the genesis and organization of each of the three programs were different, they share common factors which have led to their success, including:
- Standardized map legends. All of the lidar data was produced to USGS 3DEP standards. The California Native Plant Society and the California Department of Fish and Wildlife developed the vegetation classification schemes, descriptions and keys for each of the programs. The fuel models follow the rules and standards established by Scott and Burgan10 nationwide. As a result, the maps are specific enough to support on-the-ground local management decisions, but also fully synchronized to enable regionwide analysis.
- Coordinated management and technical teams. While each program is overseen by a different umbrella organization, the strategy, fundraising, day-to-day management, and technical teams have remained basically unchanged, allowing for the capture of economies of scale between programs and maintenance of standards across the region.
- Easy access to the products. All of the products are placed in the public domain via intuitive data access tools. As an example, Sonoma Ag + Open Space provides three different methods for users to access their program products. All of them are easy to use and do not require GIS expertise11. As a result, product use is considerable.
- Decentralized, diverse, motivated and engaged consortium members who remain committed throughout the program. Some consortium members, like USGS, have been involved in all three programs. Other members are interested in only a specific area within one of the counties. While each program has its own members and emphasis, each program’s success is wholly dependent on the alliance that develops between organizations and individuals, who are focused on the common goal of providing foundational fine-scale landscape data sets to support decision-making and resource management over time. Nothing is more important to the success of a program than the commitment of its constituents.
- Finally, the inclusion of lidar data has made the program products more detailed, precise, accurate, and robust. This has guaranteed their adoption and use. SCMSN manager Dylan Skybrook summarized, “The lidar products are going to guide land management decisions for years to come and provide foundational data upon which collaborative and long-lasting landscape-scale stewardship projects can be built.”
Kass Green is the President of Kass Green & Associates, and the lead author of Imagery and GIS: Best: Best Practices for Extracting Information from Imagery12. She has had a long career in remote sensing and is currently supporting all three of the Bay Area vegetation and landscape database programs.
2 In December 2020, Quantum Spatial changed its name to NV5 Geospatial: further information about the company is available on quantumspatial.com and nv5.com/services/geospatial-technology/.
3 The One Tam partnership is a collaboration of the National Park Service, California State Parks, The Marin Municipal Water District, Marin County Parks and Golden Gate National Parks Conservancy, focused on ensuring a vibrant future for Marin County’s Mt. Tamalpais: onetam.org.
7 Ladder fuels are vegetation (live or dead) below the canopy of a forest that can allow a fire to leap from the ground into the forest canopy. The accumulation of ladder fuels has long been identified as a contributor to fire intensity. The Sonoma research showed lidar-derived ladder fuels were key indicators of wildfire behavior.
8 Green, K., M. Tukman, D. Loudon, A. Schichtel, K. Gaffney and M. Clark, 2020. Sonoma County Complex Fires of 2017: remote sensing data and modeling to support ecosystem and community resiliency, California Fish and Wildlife Journal, Fire Special Issue 2020: 14-45.
9 Watershed Emergency Response Team (WERT), 2020. Watershed Emergency Response Team Evaluation CZU Lightning Complex, CA-CZU-005205, October 1, 2020, 205 pp.
10 Scott, J.H. and R. E. Burgan, 2005. Standard Fire Behavior Fuel Models: A Comprehensive Set for Use with Rothermel’s Surface Fire Spread Model, USDA Forest Service, Rocky Mountain Research Station, General Technical Report RMRS-GTR-153, 72 pp.
12 Green, K., R. Congalton and M. Tukman, 2017. Imagery and GIS:: Best Practices for Extracting Information from Imagery, Esri Press, Redlands, California, 418 pp.