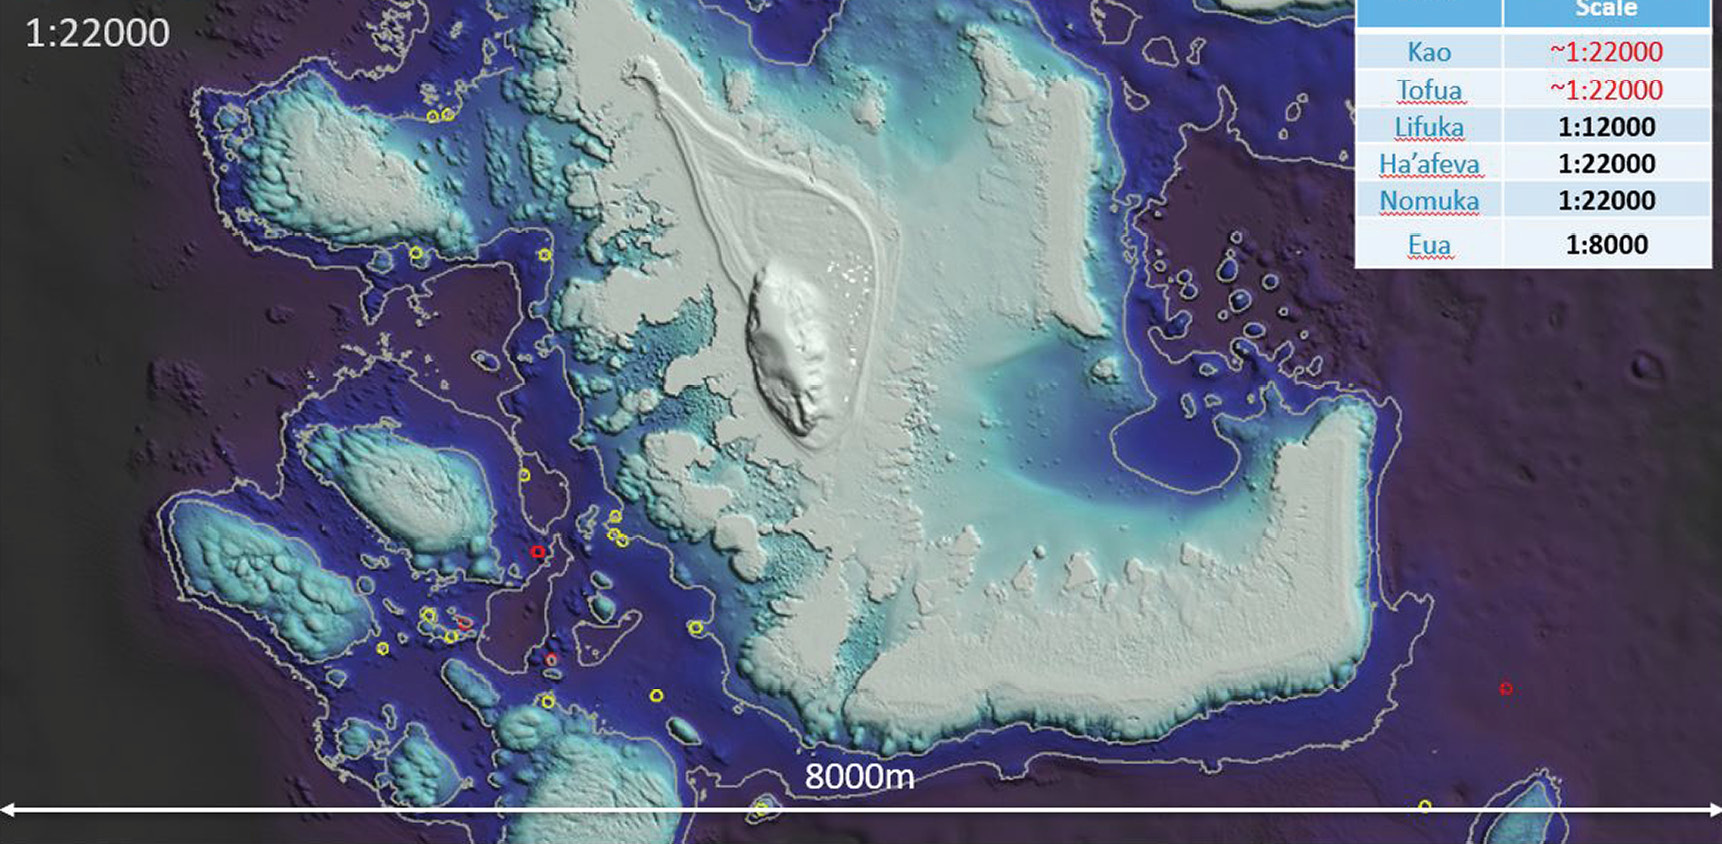
Figure 1: Multibeam sonar data and bathymetric lidar data are combined to detect hydrographic objects larger than 2 m by 2 m on the navigation surface of Nomuka, an island in the South Pacific. Difference locations are circled. Image courtesy of Woolpert.
In 2018, Woolpert and iXblue teamed up to map the coastline of Tonga in support of nautical charting for Land Information New Zealand (LINZ). The project was part of the Pacific Regional Navigation Initiative (PRNI), the goal of which is to allow safe and reliable passage through Pacific waters, while protecting fragile ocean environments and allowing the economies of Pacific island countries to develop.

Figure 2: This aerial photo of the coastline on the island of Lifuka, Tonga, depicts one of the areas surveyed. The project consisted of surveying a wide variety of environments, from coral reefs and complex seabed surfaces to steep, sloping volcanic islands. Image courtesy of Woolpert.
Tonga is comprised of hundreds of islands in the South Pacific Ocean, but, for this LINZ project, the team set out to detect hydrographic objects with dimensions of at least 2 meters by 2 meters around six main islands—Kao, Tofua, Lifuka, Ha’afeva, Nomuka and ‘Eua. The project used a combined sensor approach, with satellite-derived bathymetry results generated first, followed by Woolpert providing airborne topobathymetric lidar with its Leica Chiroptera 4X system, followed by iXblue acquiring multibeam sonar data.
The topobathymetric lidar data, collected four to five months ahead of the multibeam, was planned to provide coverage to a 20 m depth, with the sonar targeting greater depths. The lidar was acquired to extinction in most locations, however, and the multibeam data came in shallower where it was safe to do so. This resulted in a large overlap between the two datasets, from a depth of 5 m to 45 m over approximately 50 square kilometers, allowing for valuable statistical analyses.
Methods and processes
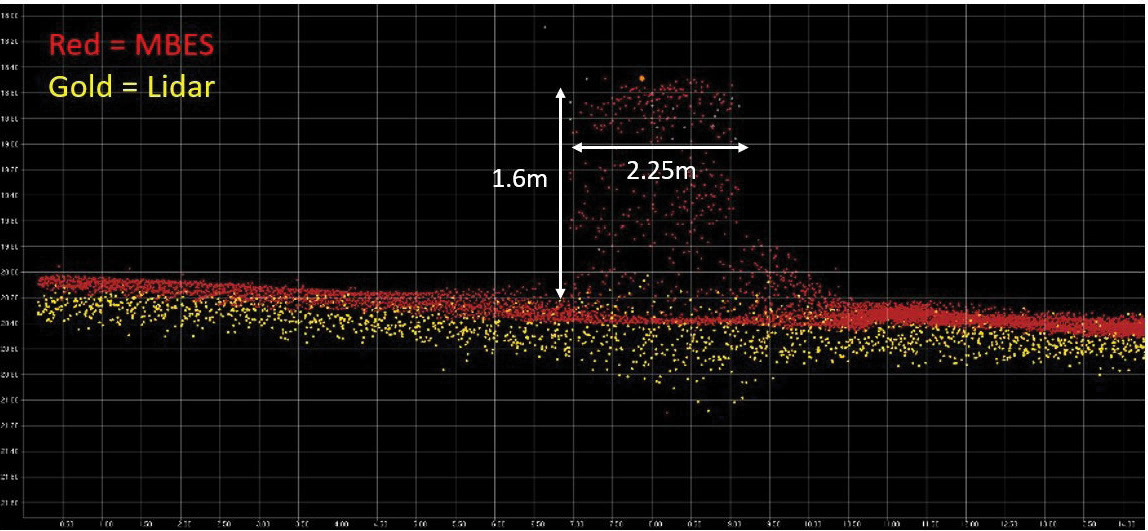
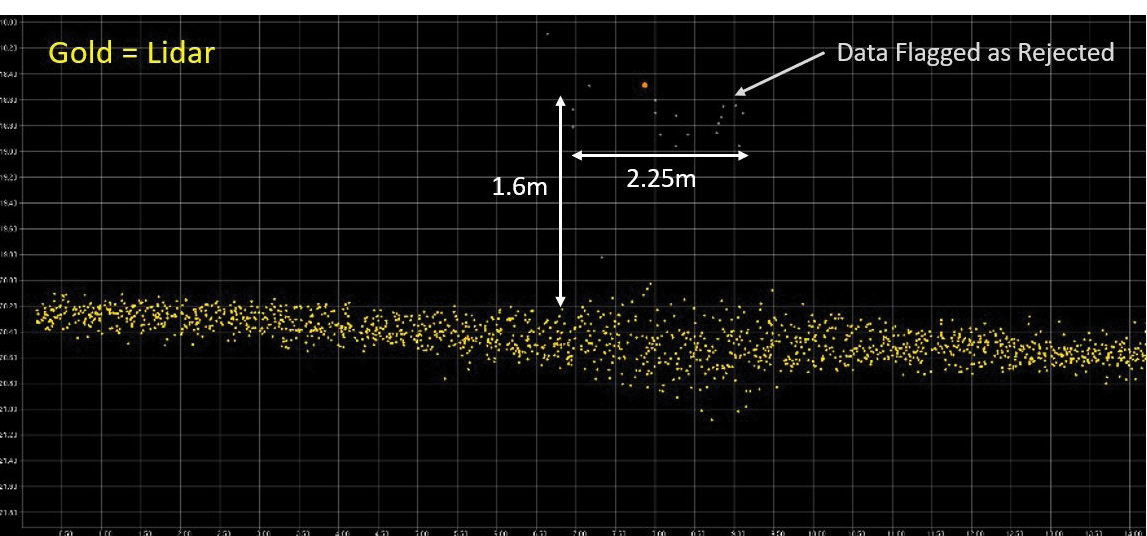
Figure 3: The lidar points in these images indicate that an object was detected, but the faint points at the top were flagged in the editing process and removed, which caused a difference between the lidar and multibeam datasets. Images courtesy of Woolpert.
Since lidar can survey shallow water more efficiently than multibeam, analyses were conducted to assess how reliable the lidar hydrographic object detection was with a modern sensor.
In the past, object detection analyses have been conducted by examining specific objects at the point-cloud level, but this can lead to tunnel vision, focusing on differences that have no impact on the final product. It’s also very difficult to scale this approach to large areas. To identify differences that would have meaning for a mariner, the team wanted to do the analyses on the chart product, or a proxy for that product.
 A proxy for the largest-scale production chart in each area was used. Focal statistics were used to interrogate the lidar and multibeam final bathymetric surfaces to determine where the multibeam-only chart would differ from one derived from lidar data. If the lidar and multibeam surfaces agreed to within the allowable vertical uncertainty, within 2 mm horizontally at the largest production chart scale, then the charts were considered to match. Otherwise a difference location was generated (Figure 1).
A closer look at difference locations
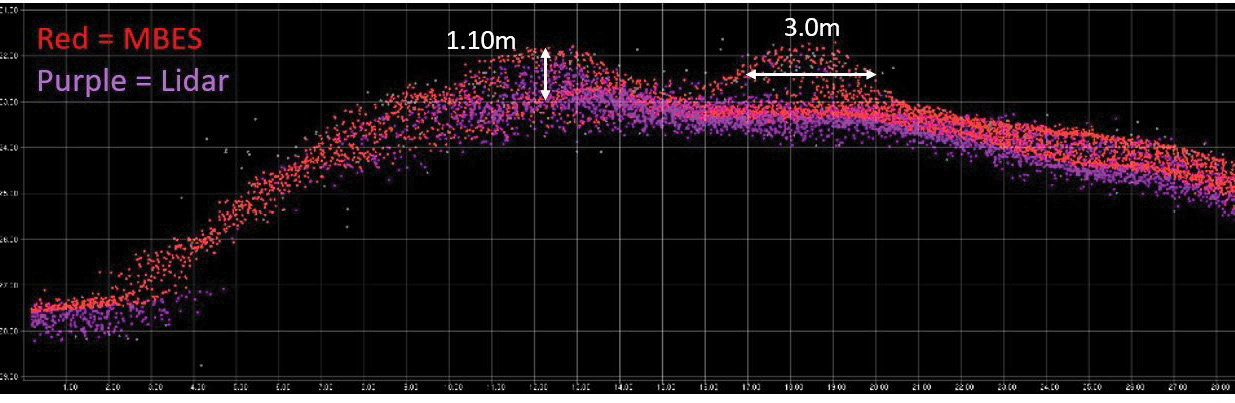
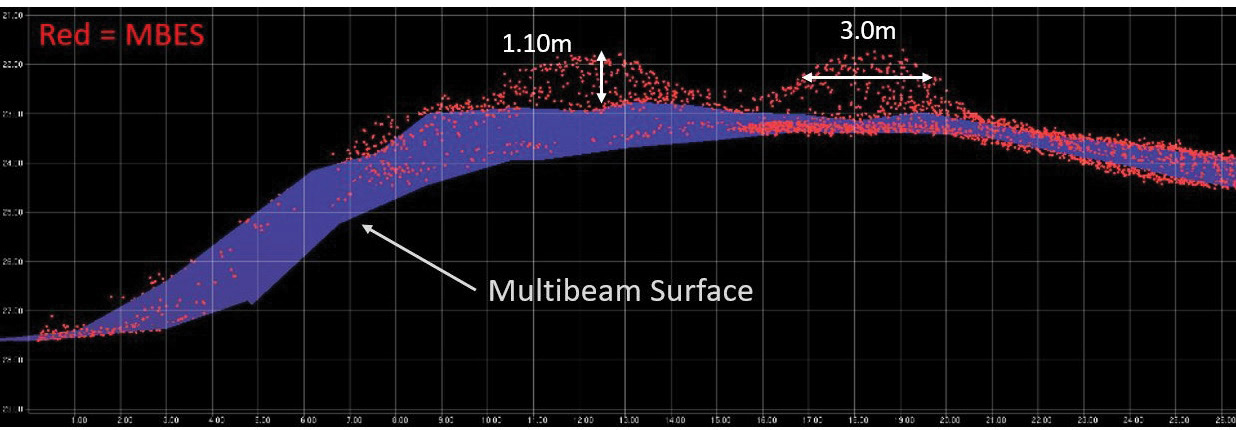
Figure 4: This final multibeam surface is not pulled up to the shoalest points in the point cloud. This discrepancy highlights the importance of knowing the largest-scale chart for which the surface will be used, since the surface is the basis for charting. Images courtesy of Woolpert.
The terrain covered was challenging and widely varied, from coral reefs comprising a complex seabed to volcanic islands that sloped steeply into the ocean (Figure 2). The difference locations were initially assessed to see if there was any correlation to water depth or seabed type, but no strong correlation was found.
 The comparison surface used for analyses comprised 12,625,000 grid cells at 2 m resolution. There were 71 grid cells in which multibeam identified something where lidar had no correlating object, and 76 grid cells in which lidar identified something where multibeam had no correlating object. Over 12.6 million grid cells, or 99.9994%, had no discrepancy.
When analysts looked more closely at the locations where the two datasets did not match, two types of discrepancies were apparent. In the first example from Nomuka, multibeam clearly detected the object. Lidar also detected the object, but the data on the top of the object had been flagged as rejected. This is an editing error. The team also saw examples of this in reverse where multibeam was flagged as rejected (Figure 3).
In the second example, it appears that the object was represented correctly by both the multibeam and lidar point clouds. However, the multibeam surface was not pulled up to the shoalest sounding. This was by far the most common discrepancy found and highlights the importance of knowing the largest-scale chart for which the surface will be used, as the surface is the basis for charting (Figure 4).
There are techniques to highlight potential surface representation issues at a given scale, prior to finalizing the surface for client delivery. But that scale must be known and communicated early. This enables a full workflow to be established with the end product in mind, specific to its use and scale. This approach would likely result in far fewer discrepancies in the quality control and acceptance phases of future surveys. It would also provide greater confidence in the dataset for allocating Zones of Confidence classifications.
Using the right tool at the right time in the right location
Being able to analyze the data in the overlapping areas of the two collections revealed some new considerations for surveyors. It is important to distinguish between object detection and object recognition. In most cases, the sensors detected the objects, but they weren’t always recognized as such during editing. There were editing anomalies in both lidar and multibeam, because there is still a human factor present in the processing of these complex datasets.
Scale still matters. Once raw data is acquired, it can be processed and classified very differently depending on the required project scale and purpose, with potentially very different levels of effort required. In the case of hydrographic surveys, it directly affects shoal sounding designation.
Even with the differences identified, it’s important to note that the two datasets showed agreement across the overlap area to near absolute certainty, with a 99.9994% success rate.
Lastly, the combined multi-sensor project approach was very successful in achieving the goals of PRNI. Using the right tool at the right time in the right location allows survey to be collected more efficiently and effectively. These analyses show that lidar is the right tool to provide efficient, high-resolution surveys in many hydrographic environments.