
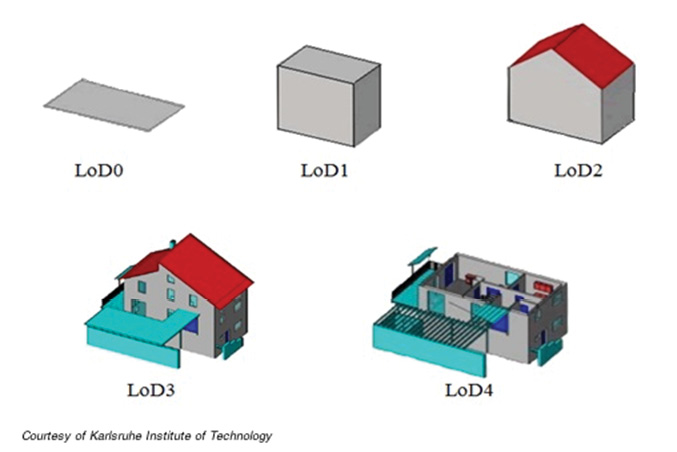
Figure 1: Schema showing the different Levels of Detail (LoDs) for building models.
Although physicists have recently determined the theoretical possibility of a two-dimensional (2D) universe, most of us are perfectly happy living in our three-dimensional (3D) world. It is a natural progression, therefore, for our GIS data to evolve from traditional 2D maps to a 3D representation—essentially creating a duplicate of the physical world by creating a ‘digital twin’ base map. There are numerous capabilities and advantages related to working in a 3D virtual environment. For instance, imagine a 9-1-1 dispatcher who receives a call and is then able to enter a digital twin 3D virtual environment to access real-time video feed from rooftops or other lines of sight; or to use a floor-by-floor geospatial reference for a multi-story structure, providing emergency personnel with information to better respond. This scenario just touches the surface of capabilities represented by 3D data. Sanborn has developed an array of 3D building modeling and digital twin/visualization products and services, deliverable in several formats and available for a wide variety of uses. This article provides an overview of the following:
- Types of architectural building models
- Building model generation
- Additional features to enhance a building model for development of a digital twin
- Applications
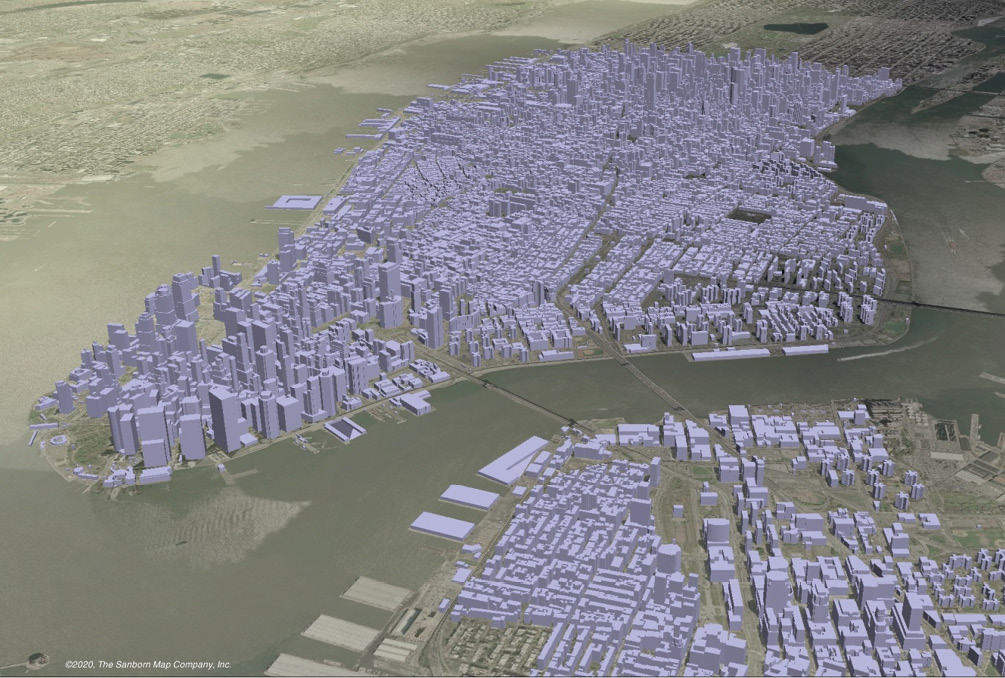
Figure 2: LoD1 building model of Manhattan and Brooklyn, New York.
3D models are designed for 3D visualization, GIS applications, architectural modeling, 3D modeling, 3D graphic design, and 3D simulators.
Types of architectural models
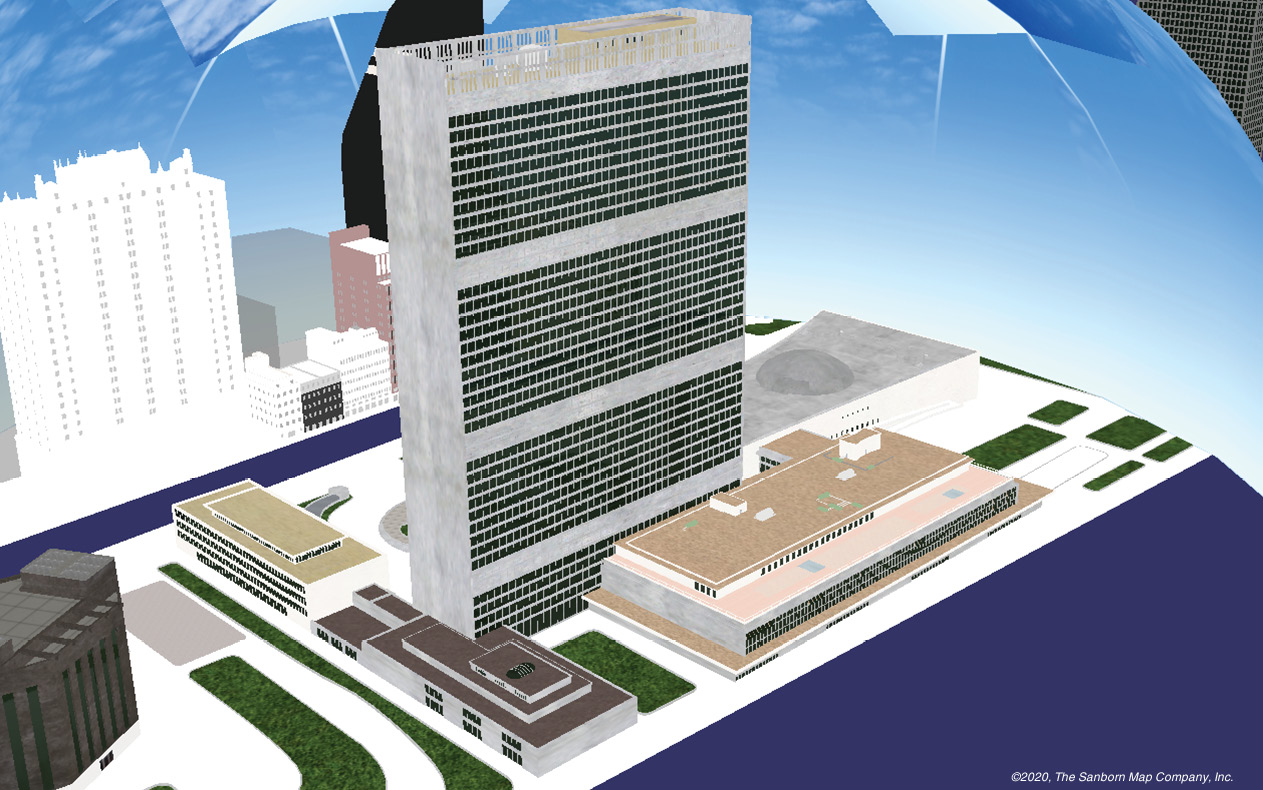
Figure 3: LoD3 building model of United Nations building in New York, with computer-generated texture.
Sanborn uses an enhanced version of City Geography Markup Language (CityGML) to classify the unique Levels of Detail (LoDs) for building models. The various LoDs display different levels of building architecture and are delivered as accurate, geo-registered (X,Y,Z) models ready for seamless integration into most 3D application software. The complexity and detail of the model increases with each level, and the five (5) standard LoDs are described below (see also Figure 1). Please note that each LoD type model can be void of texture, have a computer-generated texture, or have actual or photo-realistic imagery texture applied.
- LoD0 is actually a 2D footprint/outline—many of us are familiar with these and already have them in our GIS datasets—but is the basis for building the other LoDs.
- LoD1 uses the elevation of the top of the building and the ground level LoD0 footprint to construct a simple ‘sugar cube’ model type (Figure 2). Although it does not have detailed architecture, it provides the highest point of the building, which can be used for some limited line-of-sight analysis or simple modeling.
- LoD2 provides additional architectural detail. For example, the Empire State Building would be a simple block if defined according to a LoD1 model. The LoD2 model would illustrate the tiered roofline or ‘wedding cake’ components of the building. Domes are also modeled, as well as slanted rooftops.
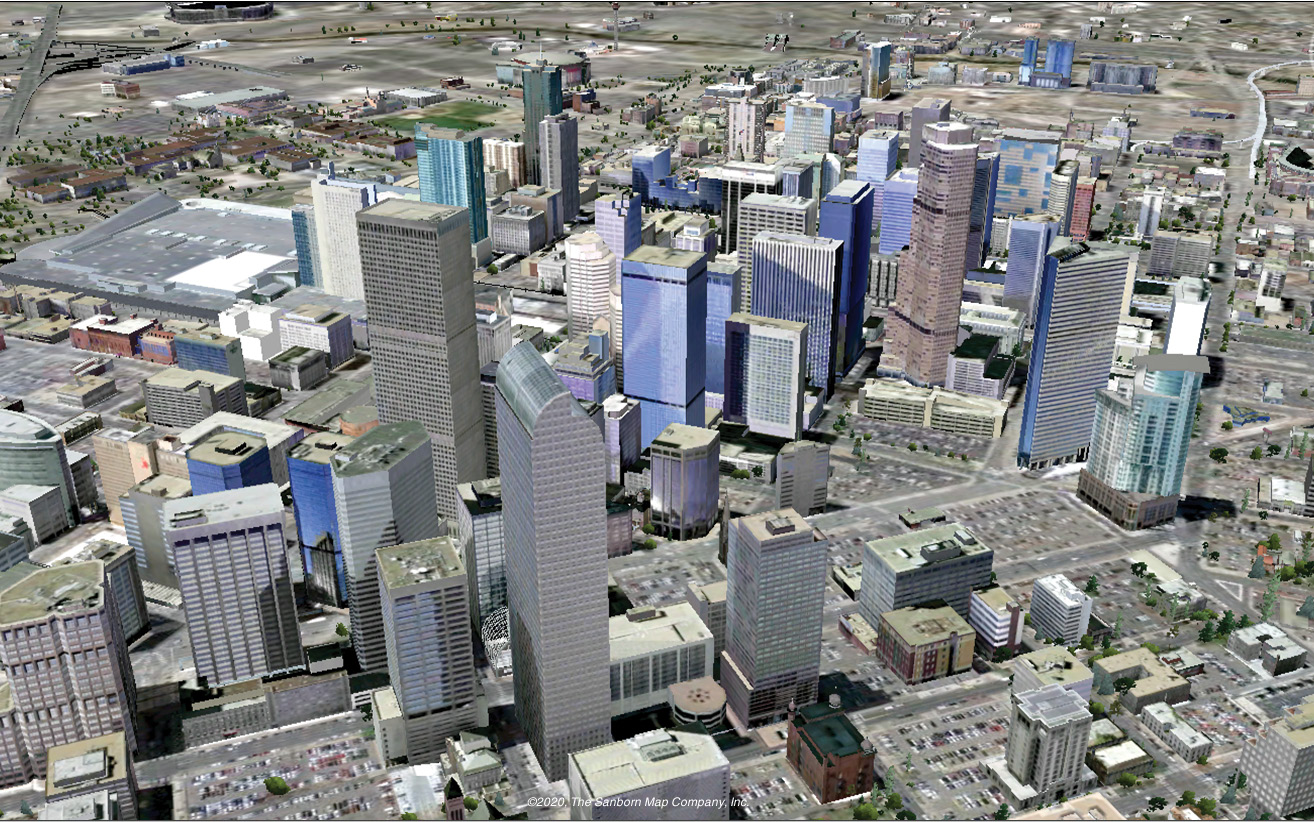
Figure 4: LoD3 building model of part of Denver, Colorado, with photo-realistic texture.
LoD3 has increased complexity, and provides additional detailed modeling that includes all small building appurtenances such as exterior stairways and rooftop component details (Figures 3 and 4).
LoD4 is more complex yet and includes modeling the interior of the building (Figure 5).
Model generation
There are three primary sources for developing a 3D model: nadir imagery, oblique/nadir imagery, and lidar.
A 3D model can be developed from a vertically oriented imagery sensor in a photogrammetric 3D environment. Features and buildings can be extracted using automated methodology, and verified/enhanced by experienced stereo-compilation technicians.
Oblique imagery typically provides five views created by four cameras each tilted at 45 degrees and arrayed in 90° arcs around one vertically mounted camera. It provides views of the sides of the structure additional to the familiar nadir one.
Lidar is very successful for creating 3D models. Typically, a density of 2 to 4 points per square meter produces a relatively good result, but a higher point density can increase the quality of the 3D geometry. Automated software can provide an acceptable base model but will also need review/enhancement by experienced technicians to repair errors in the model where buildings and vegetation or other anomalies overlap. If photo-realistic texturing is desired, imagery will also need to be obtained.
Texturing
There are multiple sources of computer-generated textures to provide exterior detail to models—anything from very simple shading to more customized façades indicating brickwork, mirrored surfaces, colors, etc (Figure 3).
The ideal texture source is oblique imagery, since it provides multiple building views, and the imagery can be used to show the actual façade of the buildings (Figure 4). In some instances, for example in extreme urban canyons, additional imagery may be acquired using ground-based or drone sensors.
Additional features to enhance a building model into a digital twin
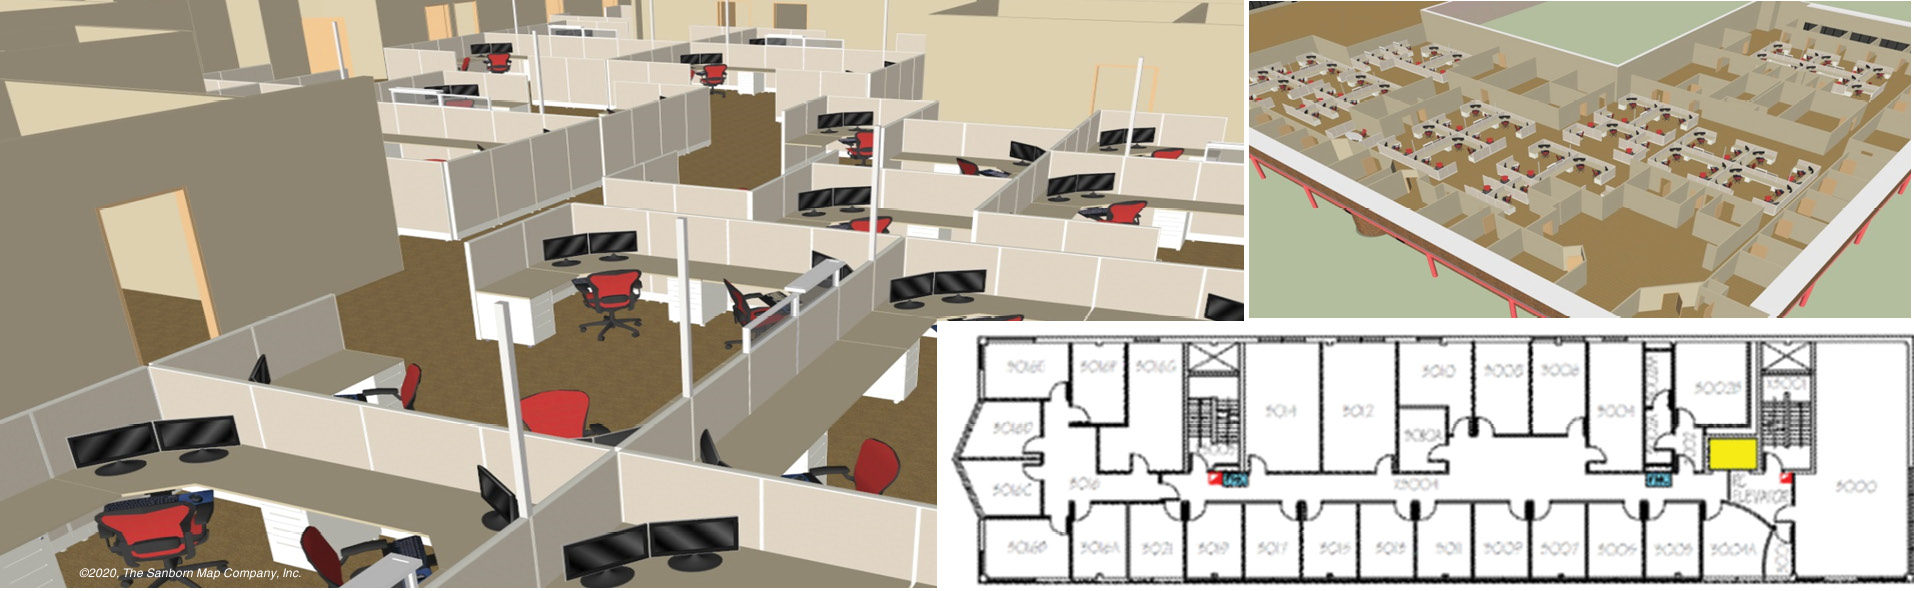
Figure 5: Views of an LoD4 building model of an office building showing interior detail of cubes, furniture etc. The floorplan is shown for reference.
Using a high-quality and accurate building model as a base, we progress to a more robust “digital twin” by expanding/adding other significant vector features and attribute data. A digital twin combines different assets and their information in one place, facilitating improvement of operational efficiency and expanding the practical applications of a building model. It also enables users not only to view the geospatial complexities of a 3D model, but also to simulate future environments and aid in strategic planning—thus making the physical area represented more resilient and manageable.
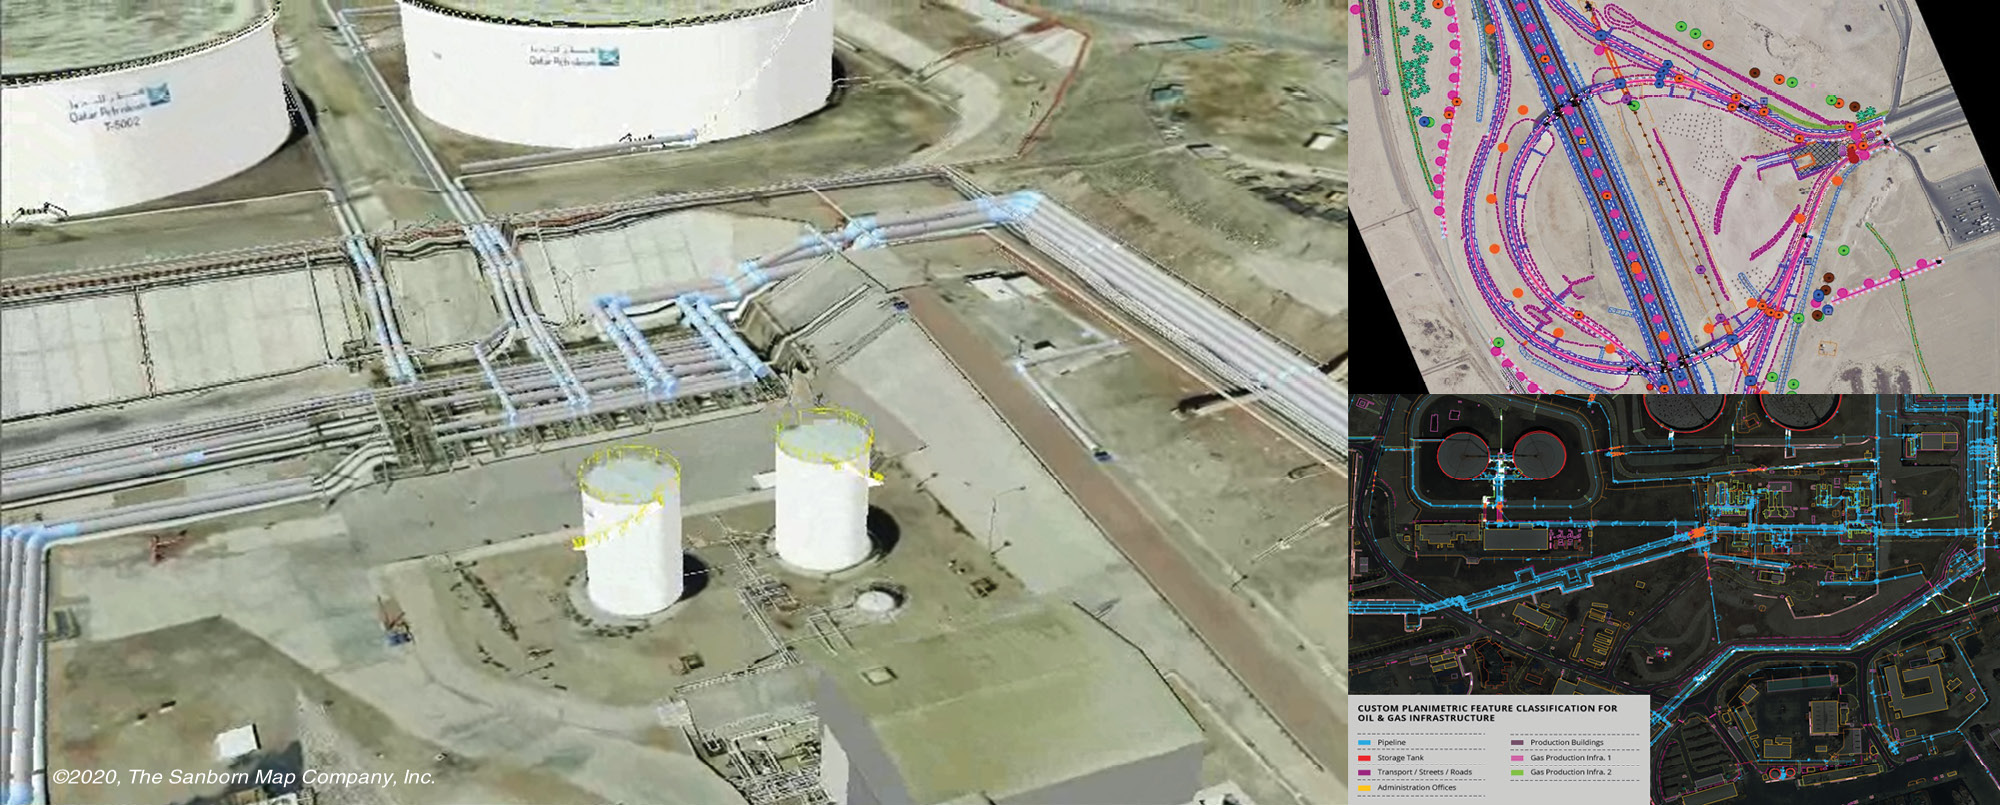
Figure 6: Views of oil and gas infrastructure. LoD3 building model with photo-realistic texture (left), orthoimagery with stereo-compiled features superimposed (top right) and incorporation of asset information (bottom right).
Sanborn uses multiple techniques to extract additional features using semi-automated processes from either imagery or lidar data. Features are extracted in 2D and/or 3D and enhanced with information from the sensor or other auxiliary data sources such as as-built drawings and databases of information/attribution. An example of a digital twin for utility asset mapping is illustrated in Figure 6.
Applications
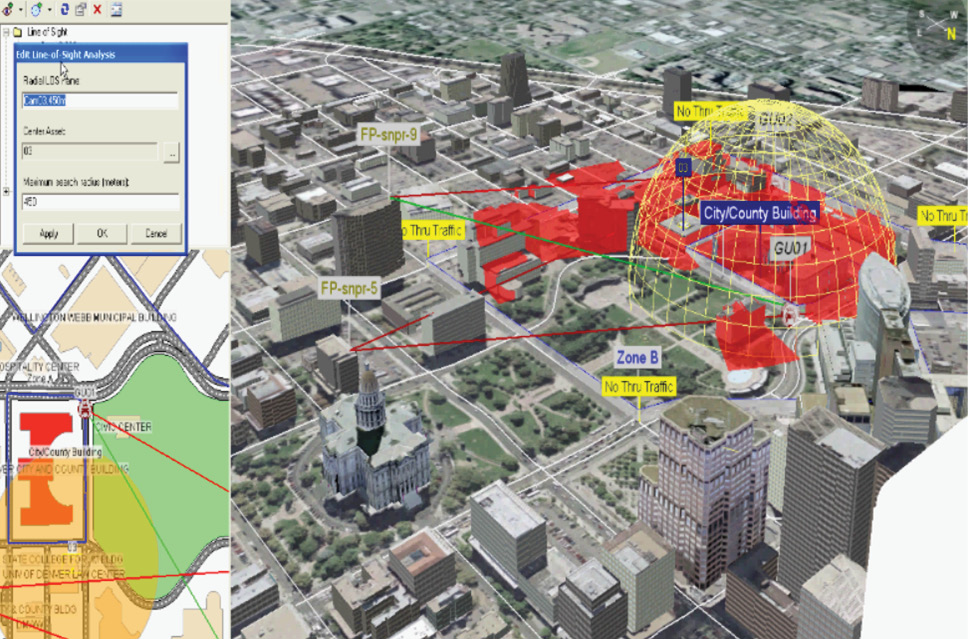
Figure 7: The use of a digital twin in operation planning related to the City and County Building, Denver, Colorado.
3D models and digital twins provide a wide variety of enhanced applications. Examples include:
- Emergency response—A digital twin provides the X, Y, Z location for 9-1-1 responders and is especially valuable in high-rise or multi-unit complexes. It can aid in coordinating evacuation plans, real-time video surveillance, operation planning for coordination/line-of-sight analysis/dissemination, and crime analysis (Figure 7).
- Building information modeling—The digital twin aids in determining optimal occupancy and facilities management for large commercial complexes. It provides the capability for urban design, where new construction design can be integrated into the existing model, and provides site analysis from an accurate virtual environment.
- Finance/Insurance—The digital twin improves an agency’s ability to calculate value based on location and proximity to desirable features such as shopping and schools, and to assess vulnerability from natural hazards such as floods, fire, hurricanes, etc.
- Property investment/management—Attributes can be added to the model for property valuation, environmental hazards, and community trends. The digital twin model provides a tool to determine and track tenant acquisition and retention, especially in high rise buildings, whether commercial or residential. It allows real estate transactions to occur more easily without an onsite visit.
- Asset management—The digital twin improves the efficiency of asset management, including maintenance, tracking, and upgrade.
- Real-time directories—A digital twin model has extensive practical applications in education, marketing, advertising, tourism, etc., especially for virtual tourism and other opportunities to view locations and buildings remotely.
Conclusion
3D modeling and enhanced digital twins will continue to expand our GIS capabilities and open up opportunities for applications that make our lives better and safer, and GIS data more robust. Digitizing our 3D world can aid us in decision making and planning with advanced GIS simulation environments to provide vital information for line-of-sight analysis for high-profile route planning, strategy preparation, property management, engineering, urban design, contingency planning and safety concerns, etc. Making geographic information more accessible, including the ability for additional ecological analysis, will help our communities improve their resiliency and environmental sustainability.
With over ten million buildings modeled for locations across the US and around the world, Sanborn is an industry leader in the 3D visualization field.