Editor’s note: A PDF of this article as it appeared in the magazine is available HERE.
Since 2004 and the first commercial use of aerial lidar bathymetry with the Optech SHOALS 1000T sensor2, topobathymetric lidar has faced three basic challenges: the physics of light traveling through different media (air and water); the albedo of the submerged bottom; and water column turbidity resulting from dissolved particulate/organic matter, known as KD, which is recognized to have an important role in obscuring the bathymetric ground from topobathymetric lidar sensors. Inland waterways in Florida, known for dark, muck-covered bottoms, combined with tannic, dark waters, make for exceptionally challenging conditions for surveying with light-based sensors regardless of the wavelength of the laser.
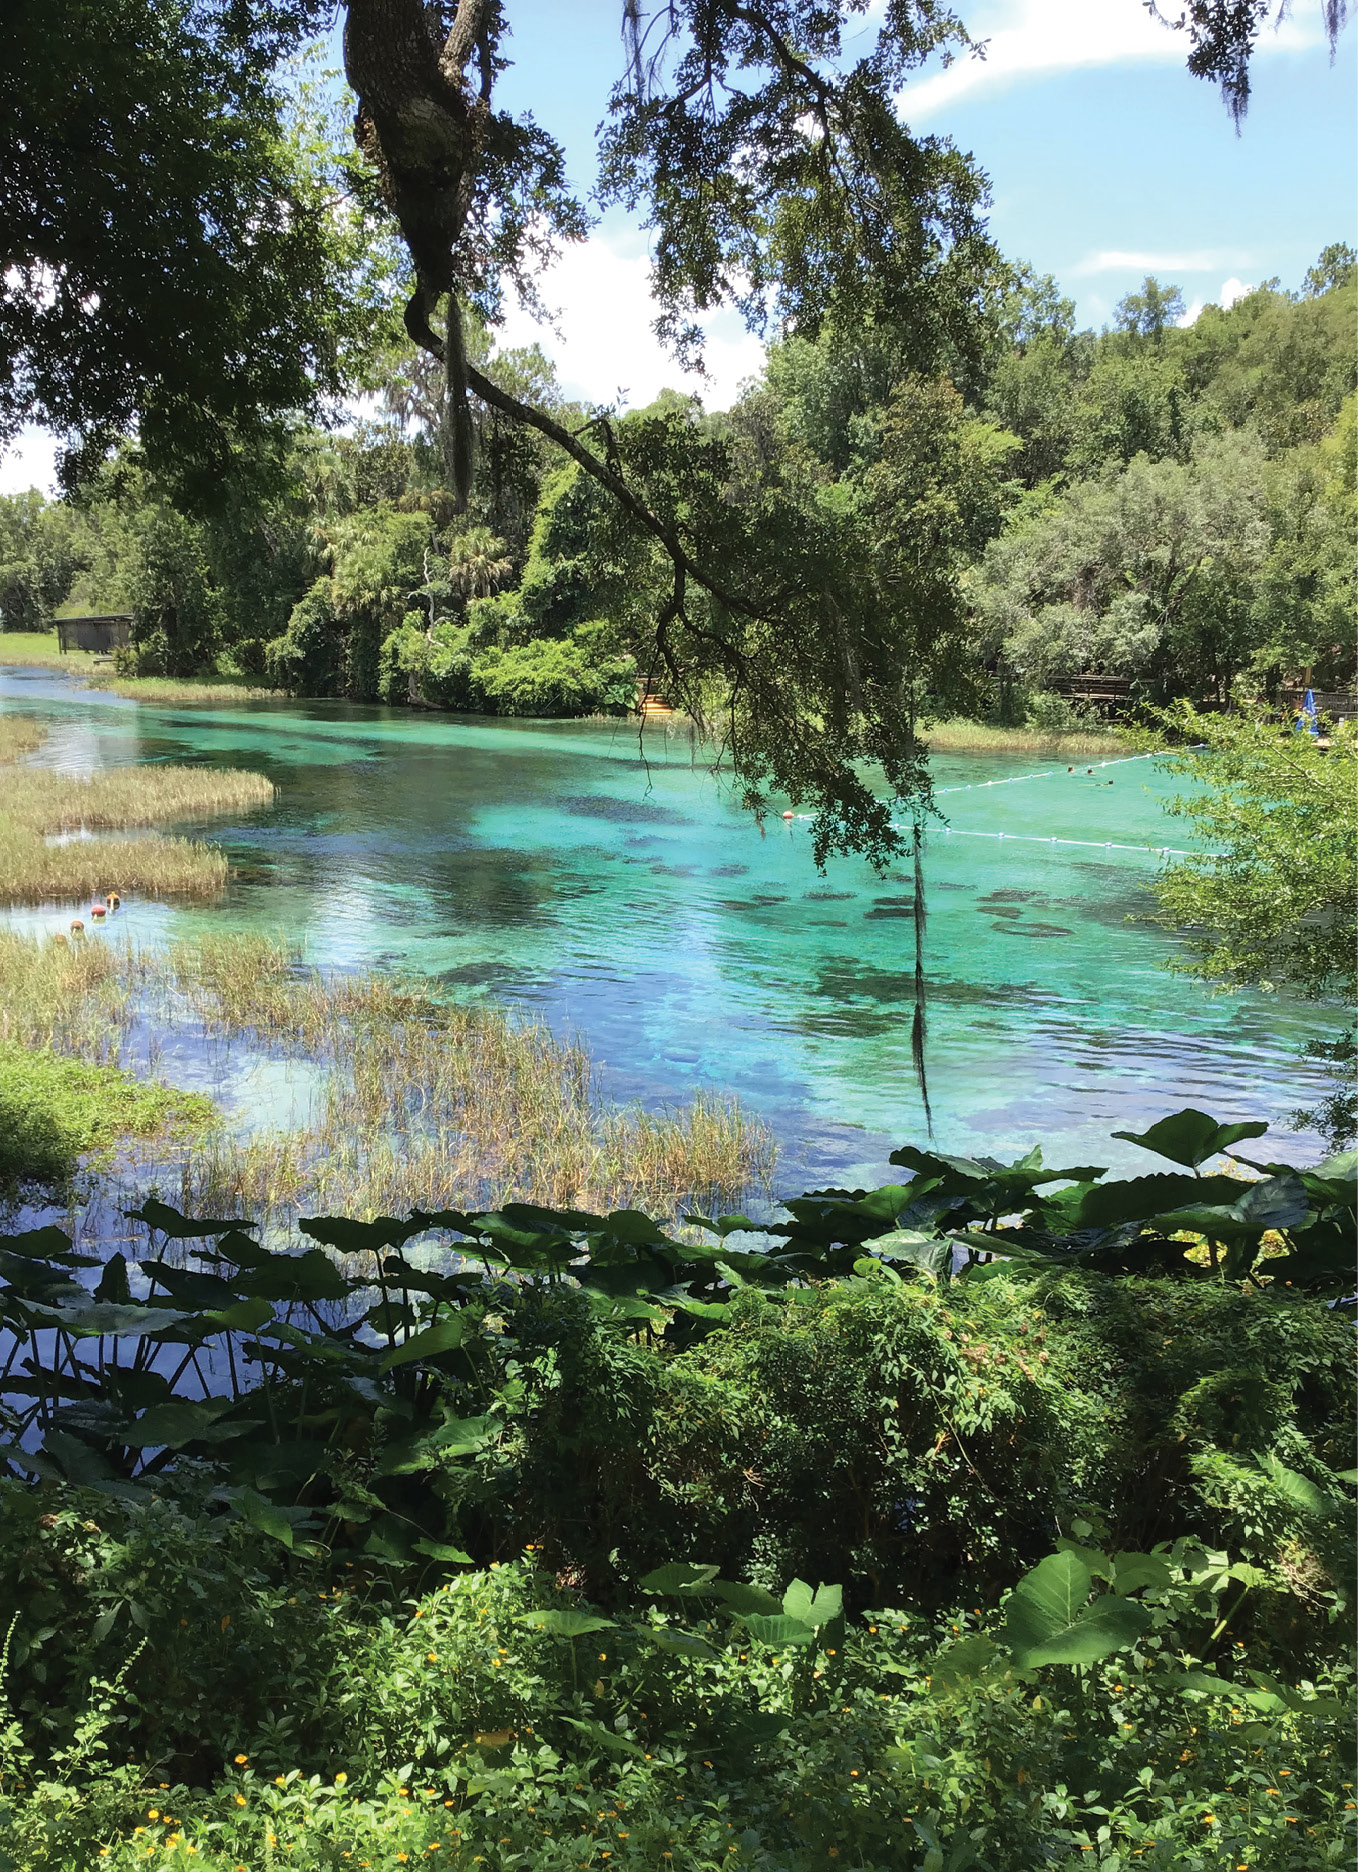
While the physical and hydrological characteristics of most of the larger inland waterways in Florida more closely resemble the Withlacoochee and Suwannee Rivers—with their slow moving, tannic water and dark bottoms—there are also several spring-fed river systems. Spring runs like the Crystal River, named because of the more than 20 first-order springs that supply the river with clear water, the Manatee Springs run into the Suwannee River, and the Rainbow River—a short tributary of the Withlacoochee River—are spring-fed with clear water and a hard, karst, lime rock substrate, making them good inland waterway candidates for topobathymetric lidar survey.
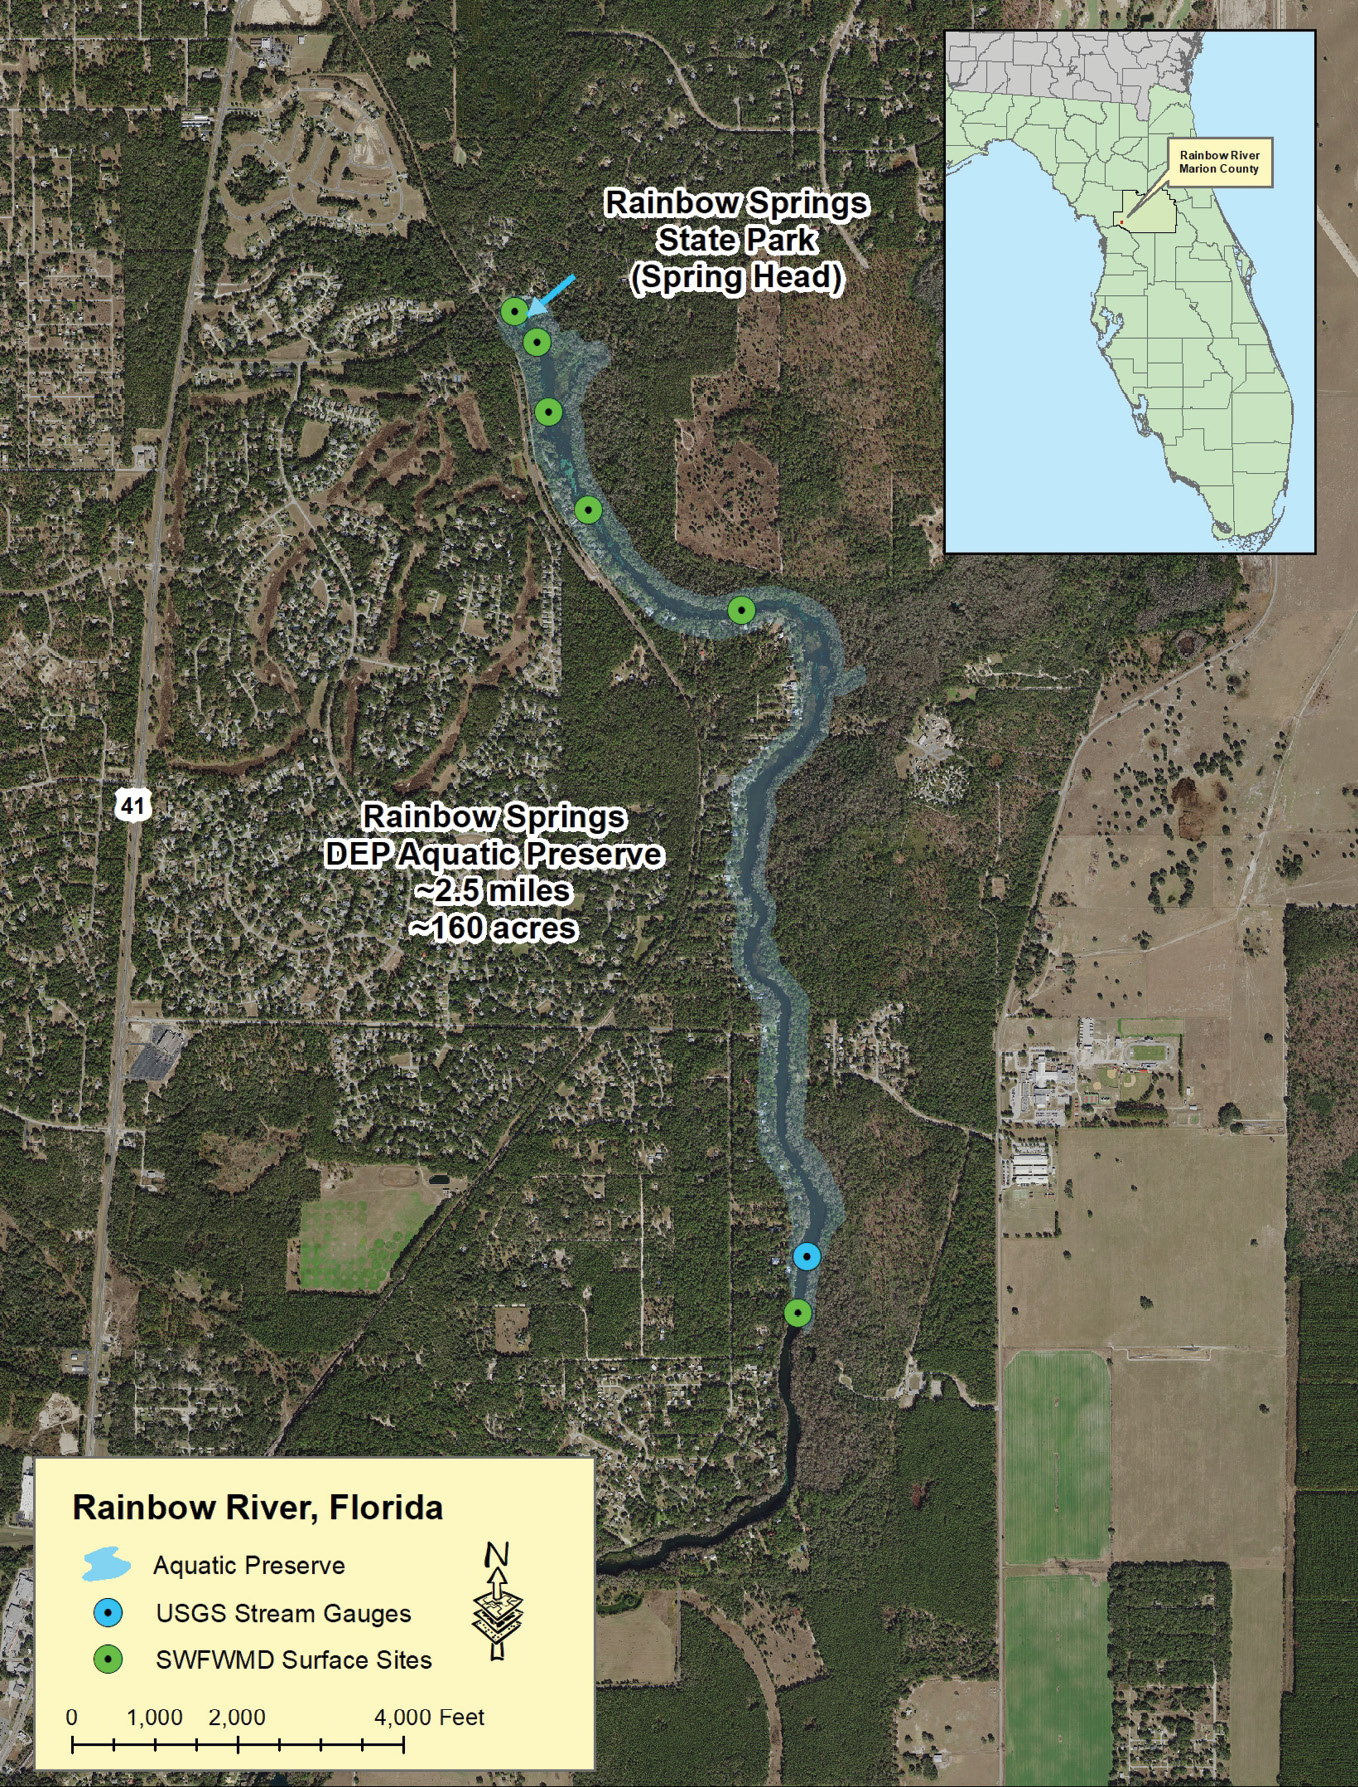
Figure 1: Rainbow River Aquatic Preserve in southwestern Marion County, Florida.
The Rainbow River (Figure 1) is a relatively short river run, about 5.8 miles from the first-order springheads in the Rainbow River State Park to the confluence with the Withlacoochee River in southwestern Marion County. Because of its natural beauty, the upper reach was designated by the state of Florida as an Aquatic Preserve in 1986 and an Outstanding Florida Water in 1987. The Florida Department of Environmental Protection (FDEP) manages the springhead as a state park, and the aquatic preserve for recreation, including tubing, rafting, and swimming. While resort housing has developed on the lower reaches of the river and along the Withlacoochee River near Dunnellon, FDEP closely regulates activities on the upper portion of the Rainbow River and has restricted most development. The Southwest Florida Water Management District (SWFWMD) participates with FDEP in monitoring water conditions, nutrient content, submerged aquatic vegetation (SAV), and setting the minimum flows and levels, along the entire Rainbow River reach.
SWFWMD has been monitoring and mapping the SAV and bathymetry of the Rainbow River since the early 2000s. When these studies began, hydrographic mapping of the bathymetry was performed with single-beam echo sounder (SBES) technology. Profiles in proximity to the banks and along the thalweg were collected, georeferenced, and manually adjusted to a surface constructed from SWFWMD and/or USGS river gauges (Figure 1). More recently, in 2016 and 2017, SWFWMD used acoustic doppler current profiler (ADCP) technology to measure flow rates in the water column and to map bathymetry, again using the SWFWMD and/or USGS river gauges to estimate the water surface (Figure 2). Then, in April 2017, while on transit to the east coast of Florida, the National Oceanic and Atmospheric Administration (NOAA) collected topobathymetric lidar data for most of the Aquatic Preserve section of the river, including the springheads, as a proof-of-concept survey for inland waterways.
Past and present technologies
SBES instruments, also known as depth sounders or fathometers, determine water depth by measuring the travel time of a short sonar pulse or ping. The sonar ping is emitted from a transducer positioned just below the water surface, and the SBES receiver listens for the return echo from the bottom. On board the boat is a global positioning system (GPS) receiver registered to the sonar emitter and recording horizontal position locations. This technology does not include adjustments for pitch, roll, and heave of the boat on the water surface, and the echo-returns are corrected to a uniform water surface. SWFWMD worked with faculty from the School of GeoSciences of the University of South Florida (USF) to perform the SBES surveys. USF collected the bathymetric data using a Teledyne-Odem Digibar Pro system SBES fathometer and a Trimble R4 RTK GPS onboard a standard 15-foot flat-bottom boat. HYPACK (6.2) software was used to convert the measured sound velocities to water depth soundings.
There are places in the river where sandy sediments accumulate and support SAV (Figure 3). In these areas, there was some doubt whether the SBES returns were reflecting from the bathymetric bottom or the vegetation. Additional measurements with a scaled-rod were used to verify SBES measurements. Where SBES measurements could not be verified, the scaled-rod measurements were used to measure the bathymetric bottom.
ADCP is a hydroacoustic current meter, similar to a sonar, used to measure water current velocities over a depth range by means of the Doppler effect of sound waves scattered back from particles within the water column. The profile recorder stops when the sonar ping returns from the bathymetric bottom surface. The ADCP was coupled to a survey-grade GPS for open water soundings, but near-shore soundings were degraded to GIS-level GPS locations because of overhanging tree coverage. The GPS receiver was mounted to the bow of a one-man kayak and the ADCP was suspended from a gunnel. GPS locations were referenced to a local base-station established on a SWFWMD geodetic marker. SWFWMD contracted with WaterCube, LLC, to perform the ADCP surveys. WaterCube used a Teledyne RDI ADCP sensor and SonTek 2G-PCM RTK-GPS receivers for multiple mapping missions on the river.
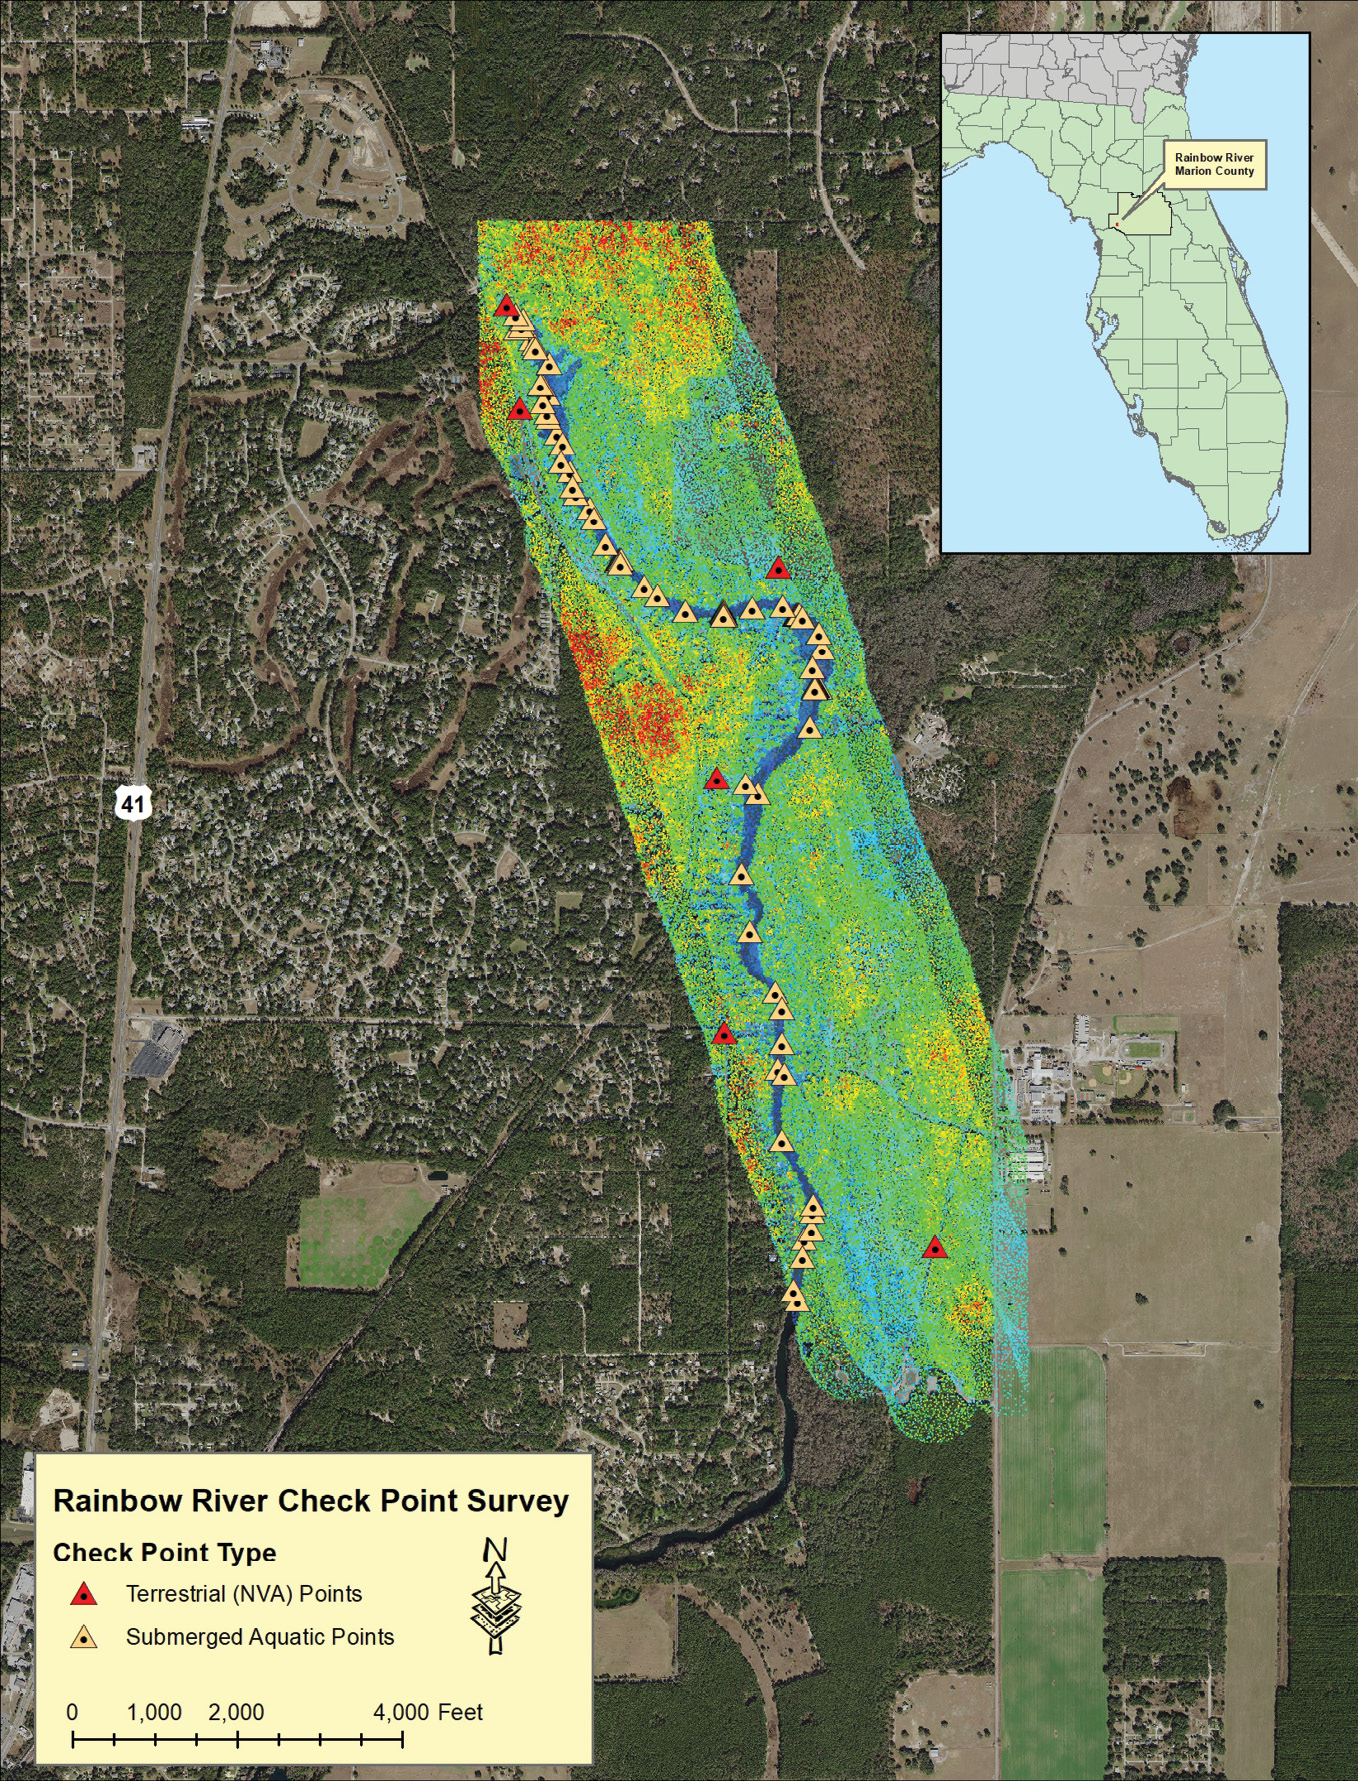
Figure 4: Distribution of vertical accuracy check points in the Rainbow River Aquatic Preserve, SWFWMD 2019.
NOAA’s National Geodetic Survey (NGS) acquired aerial topobathymetric lidar data using a Riegl VQ-880-G sensor over the upstream portion of the Aquatic Preserve area as a series of seven parallel flight lines (Figure 4). The lidar data was referenced to the Bronson, Florida (FLBR) Continuously Operating Reference Station (CORS)/Florida Permanent Reference Network (FPRN) station, approximately 20 miles north-northwest of the Aquatic Preserve, during acquisition. It’s important to note that the FPRN station at Dunnellon (DUNN) was not recording data at the time of the overflight. The lidar data was calibrated by NGS and delivered to Dewberry, a privately held professional services firm, for refraction correction and classification. The specifics of the NOAA overflight are given in Table 1.
Bathymetric lidar data must have a refraction correction applied, which adjusts the horizontal and vertical (depth) positions of each data point by accounting for the change in direction and speed of light as it enters and travels through water: this process is based on Snell’s Law. The refraction correction was performed by Dewberry using the proprietary Dewberry Lidar Processor (DLP) tool. The refraction tool uses a modeled water surface and mission-smoothed best estimate of trajectory (SBET) data to correct the ranging and horizontal placement of all green (i.e. collected with 532 nanometer laser) lidar points initially classified as water column. This classification is based on breakline placement. The refraction tool creates a new output data file and does not modify the input files. Once the refraction corrections were applied using DLP software, the number of output files was verified to match the number of input files. LAS statistics were calculated on each refracted tile. The point class statistics were reviewed and any issues (e.g. presence of extraneous classes) were resolved prior to moving forward.
Advantages of topobathymetric lidar
When appropriate and applicable, as in this case of an inland water body with clear water and a reflective substrate, there are multiple advantages to using topobathymetric lidar over either SBES or ADCP technologies for bathymetric mapping. The most obvious include data density, time efficiency, and cost, summarized in Table 2. On a per point basis, the cost decreases from roughly one dollar per point for SBES to about 50 cents per point for ADCP, and to one cent per point for lidar—with a 50 times increase in cost efficiency for lidar rather than ADCP, and more than a 100 times cost efficiency over SBES. Similarly, because lidar is a swath technology rather than a point-beam technology, the acquisition time is minimized while the cost per data point and point density are maximized.
The increased point/pulse density of the topobathymetric lidar is accompanied by several side and/or unexpected benefits.
Both of the acoustic surveys are conducted from boats on the water surface. SBES and ADCP are restricted to survey where the boat can be accommodated, and the water depth can support the beam travel time through the water column. As the acoustic surveys are collected from a boat floating on the water surface, the technology does not collect data on and above the banks. Additionally, as both the SBES and ADCP technologies are dependent on GPS to directly geoposition the soundings, and as those GPS positions are severely degraded when under dense vegetation, neither can provide accurate bathymetric and positioning data near the banks of the river.
Aerial topobathymetric lidar is not dependent on the water depth in the same manner as SBES and ADCP. While laser extinction is a function of laser power and water depth, modern sensors function well to depths of about 10 meters, depending on water clarity and bottom reflectivity. The sensor is flown in an aircraft at modest elevations, about 400-600 m above ground level. In general, flights at these elevations produce a swath with of 300-500 m. With normal pulse repetition rates, between two and eight pulses reach the surface (and below); and, with the forward-facing laser, ground/surface penetration through trees is generally good to excellent. Table 1 gives the parameters for this mission and Figure 2 illustrates 10-foot-deep profile views through the springhead and a typical section of the Rainbow River comparing the lidar profiles to ADCP survey profiles.
Although the primary goal of SBES and a secondary goal for ADCP was to map the bathymetry of the Rainbow River, SWFWMD has been monitoring and mapping the abundance and health of the submerged vegetation. The predominant SAV species, tape/eel grass (Vallisneria americana) and strap-leaf sagittaria (Sagittaris kurziana), typically grow in the soft sediments captured in depressions and holes in the porous limestone karst substrate (Figure 3). Because lidar produces multiple returns, as opposed to SBES, which produces a single return, or ADCP, which measures current flow, the SAV canopy can be measured and quantified.
Accuracy assessment
When considering accuracy assessment of the three datasets, it is important to consider that the datasets are temporally distinct from each other, with SBES being the oldest (2015), separated by several years from the ADCP and lidar missions, and that the vertical accuracy check points were surveyed by SWFWMD in 2019. As the river bottom is dynamic and continually changing, vertical accuracy statistics computed against non-concurrently surveyed check points should be considered with that caveat.
It is also important to recognize that USGS, ASPRS, and the International Hydrographic Organization (IHO) vertical accuracy specifications for topobathymetric lidar are a function of uncertain coefficients and water depth. As expected, the vertical uncertainty increases with increased water depth, but not as a linear function. Given water depths for Rainbow River of between three and nine feet, expected vertical uncertainties for QL1b through QL3b data are in the 0.25-0.30 m (10-12 inches) range (at the 95th percentile).
In 2019, SWFWMD used the FPRN and NRTK-GPS methodology to survey 106 submerged check points in the river channel and six terrestrial, non-vegetated vertical accuracy (NVA) check points along the bank (Figure 4). To verify the GPS-derived check points, independent manual soundings were made and corrected to the leveled water surface. Table 3 summarizes the accuracy statistics for SBES, ADCP, and lidar as measured by the SWFWMD vertical accuracy check point survey.
The RMSEZ errors for the three technologies are very comparable, in the 0.31–0.36 m range. It is also apparent that the mean errors for ADCP and lidar are of the same range, about 0.15 meters (six inches), but in opposite directions: lidar reported deeper bathymetry than ADCP. Finally, the most interesting result is that the error range for submerged bottom was smallest for the lidar survey, as compared with either SBES or ADCP. The narrower range of errors most likely resulted from the increased point density of the lidar survey.
Conclusions
Inland waterways present the next major challenge to topographic mapping from the tops of the mountains to the depths of the seas. In Florida, these challenges are exacerbated by mucky, non-reflective substrates and water column turbidity. However, in spring-fed reaches, such as the Rainbow River, topobathymetric lidar presents a cost- and labor-efficient alternative to more conventional hydrographic mapping. Absolute accuracies comparable or superior to those achieved through traditional single-beam echo sounders and/or acoustic doppler column profilers were achieved. Side benefits include simultaneous floodplain and bank mapping, and multiple lidar returns provide estimates of submerged features. This proof-of-concept study should be taken as a positive step for the use of topobathymetric lidar for inland waterways.
Acknowledgements
We thank Mike Aslaksen and Rudy Troche from NOAA/NGS for their assistance in making this project possible, C. Wayne Wright for helping to process the lidar data, and Danielle Rogers and Jordan Miller from SWFWMD for participating in the project.
1 Maune, D.F. and A. Nayegandhi (eds.). 2018. Digital Elevation Model Technologies and Applications: The DEM Users Manual, 3rd edition, American Society for Photogrammetry and Remote Sensing, Bethesda, Maryland, 652 pp.