USGS and Florida lidar standards

Figure 1: Puerto Rico showing the tracts of Hurricane Irma and Hurricane Maria in September 2017.
The National Enhanced Elevation Assessment Report1 (NEEA) of the U.S. Geological Survey (USGS) indicated that the greatest national return-on-investment would be experienced when lidar and terrain data met the USGS Quality-Level 2 (QL2) standards for the continental U.S. and Hawaii, and was recollected on an eight-year acquisition cycle. A similar study conducted in 2017 by the state of Florida, the Florida Statewide Lidar Assessment2, built upon the USGS NEEA study and recommended the higher USGS Quality-Level 1 standard and a more frequent, three-year acquisition cycle. These higher standards for Florida arose, in part, because the higher quality and increased acquisition cycle are necessary to adequately represent the low-lying, frequently flooded coastal areas, and to assess how hurricanes alter the landscape. Both the USGS NEEA and the Florida Statewide Lidar Assessment point to the increased benefits of multi-temporal lidar data or, at minimum, repeated ad hoc surveys.
Editor’s note: A PDF of this article as it appeared in the magazine is available HERE.
2017 hurricane devastation in Puerto Rico

Figure 2: Dewberry topographic lidar data collection missions 2016/2017. Red tiles show areas where Maria made landfall (southern side of island; Figure 3) and exit (northwestern side of island, Figures 4 and 5).
The hurricane season in late summer/early fall of 2017 was devastating to Puerto Rico. In the early evening of September 6, 2017, the eye of Hurricane Irma passed just north of the island as a Category 5 Storm and left more than a million people without power. Then, only two weeks later, on September 20, 2017, Hurricane Maria made landfall just south of Yabucoa Harbor and passed through the island as a Category 4/5 Storm (Figure 1). As the worst storm to hit Puerto Rico in more than 80 years, Hurricane Maria’s 155 mile-per-hour winds uprooted trees, downed powerlines and cell towers, ripped the roofs off houses, and left behind flooding and swollen rivers. The entire island was left without electrical power.
Lidar data collection
Not necessarily in preparation for the 2017 hurricane season—but fortuitously—USGS, under the 3D Elevation Program (3DEP) that resulted from the NEEA study, contracted with Dewberry to map Puerto Rico to the QL2 lidar specification as specified in the National Geospatial Program Lidar Base Specification (LBS) 1.23 in 2016. The survey was conducted in two campaigns (Figure 2). The first campaign occurred from January 26, 2016 through May 15, 2016 and acquired 2316 square miles of topographic lidar data. The second campaign occurred from December 8, 2016 through March 16, 2017 and acquired 1779 square miles of topographic lidar data. The 2016 topographic lidar survey project, before Hurricanes Irma and Maria, covered approximately 3451 square miles of the commonwealth of Puerto Rico, which includes the outer islands of Culebra, Desecheo, Mona, Vieques, Muertos, Cabeza de Pero, and Cayo Icacos. Lidar data collection parameters are given in Table 1. Dewberry’s intent had been to collect all 4094 square miles in one campaign, but after about 85% was collected in the 2016 campaign (3451 square miles), the weather turned and the decision was made to halt collection and resume in 2017. The data from the first campaign was processed as Delivery Block 1 (2316 square miles). The remainder of the project was flown in 2017 and then the second delivery block was processed (1779 square miles).
Following the 2017 hurricane season, USGS tasked Dewberry to perform a spring, leaf-off, 2018 lidar topographic survey of Puerto Rico, conforming to the same geographic footprint as the 2016 survey, but updated to the USGS QL1 standards as in the USGS National Geospatial Program Lidar Base Specification (LBS) v1.34 in support of disaster recovery efforts resulting from the impacts of Hurricane Maria. While many of the differences between LBS 1.2 and LBS 1.3 address ancillary and/or deliverable products—accuracy testing, and metadata—the Geoid 12a to Geoid12b update is of significance. Similarly, the upgrade in data pulse density from QL2 (2016) to QL1 (2018) was designed to provide greater ground resolution under debris and heavy canopy. Lidar data collection parameters for the 2018 topographic survey are shown in Table 2.
Lidar point clouds before and after Hurricane Maria
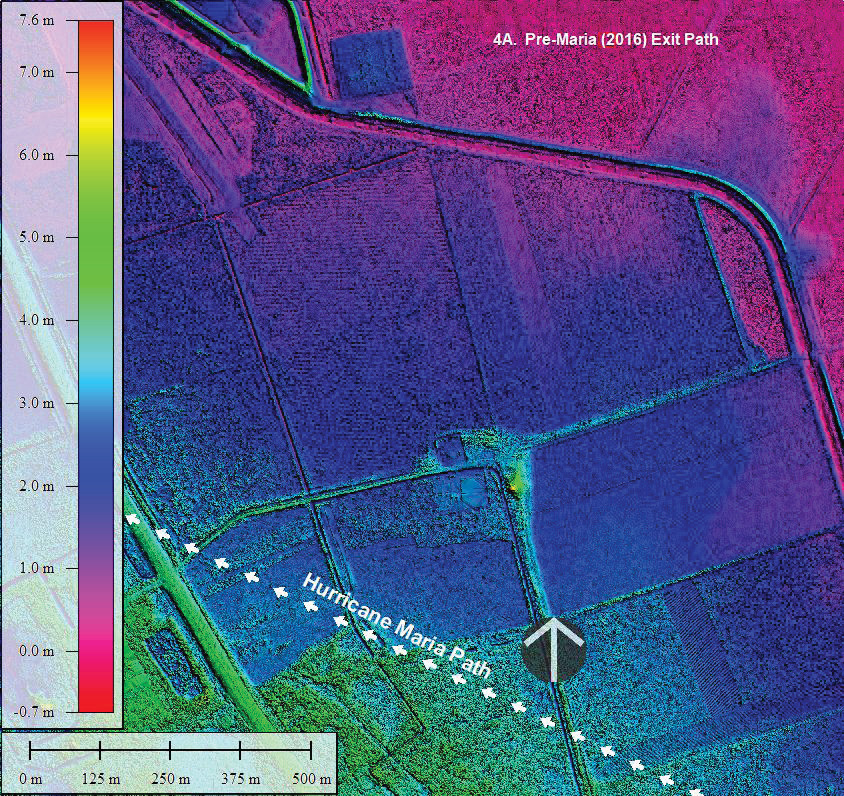
Figure 4: Full lidar point cloud, before (above) and after (below) Hurricane Maria exited Puerto Rico. The white arrows below the north points show the approximate direction of the exit path.
Hurricane Maria made landfall on the southern side of the island of Puerto Rico (Figure 1) as a Category 5 storm. The immediate area, just south of Yabucoa Harbor, is populated and the coastline is heavily vegetated. Hurricane Maria modified the beach and removed some of the vegetation along it as seen in Figure 3.
Similarly, as Hurricane Maria exited Puerto Rico along the northern coast of the island, as a Category 4 Hurricane, it leveled the landscape. The tree loss is clearly visible in the 2016 and 2018 lidar point cloud images in Figure 4.
While the hurricane’s effect on the vegetation was most obvious as the destruction of the tree canopy, the ground-level terrain elevations were also affected. Figure 5 shows the same geographic area as Figure 4, filtered to a ground-only point cloud. In Figure 5, mounding (red area) is evident along the path of the hurricane. The mounding is most pronounced along the western edge of the image and is clearer in the oblique views. Moreover, leveling of the surface accompanies the mounding as is evident northward of the large mound.
 Using this exit area as an example, we generated a difference DEM (Figure 6) to compare the pre-Maria ground surface to the post-Maria ground surface. Areas in red represent mounds, green areas experienced little elevation change, and areas in blue were scoured out. As expected, the elevation changes were normally distributed so there was no net gain or loss, but materials were relocated, forming new swales and depressions.
Project challenges
While the advantages of multi-temporal lidar missions for disaster relief and recovery are obvious from the above analysis, there were also significant challenges to this project:
- Terrain: Even though the island of Puerto Rico is relatively small—at 3400 square miles, it is the smallest island in the Greater Antilles—it is mostly mountainous. The main mountain range, La Cordillera Central (the Central Range), reaches heights of 4390 feet above mean sea level (AMSL). Two major peaks, Cerro de Punta and El Yunque (in the El Yunque National Forest) reach almost 4400 feet and 3500 feet AMSL, respectively. These terrain features present significant challenges and dangers to small aircraft.
- Environment: Related to the terrain, the environment of Puerto Rico is classified as a tropical rainforest. Temperatures are warm to hot throughout the entire year and, together with prevailing winds, produce thermals near the mountains, which is challenging and dangerous to small aircraft.
- Climate/Weather: There is no dry season in Puerto Rico. The average annual rainfall is in the range of 56 to 60 inches, averaging about five inches per month dispersed over about 18 rainy days. With coastal water temperatures about 20 degrees lower than land temperatures and the terrain, clouds form regularly in the late morning, followed by afternoon rains and humid nights. Constant rain, clouds, and nighttime humidity are all challenging conditions for lidar data acquisition, particularly in Puerto Rico’s mountainous rain forests.
- Restricted airspace: U.S. military installations in Puerto Rico are part of the U.S. Northern Command. Bases with restricted airspace include Roosevelt Roads Naval Station, Ramey Air Force Base, U.S. Naval Radio Station, Fort Allan Naval Radio Station, and several U.S. Coast Guard bases and Puerto Rico Air National Guard bases. Puerto Rico also contains several conservation areas, including El Yunque National Forest and the National Wildlife Refuges in Culebra and Vieques, where close coordination with officials was required to prevent disturbances to wildlife. Negotiating the weather in conjunction with air space restrictions was extremely challenging.
Conclusions
The fortuitous opportunity to collect topographic lidar data before and after an environmental event such as Hurricane Maria afforded the opportunity to evaluate the impact of a Class 5 hurricane. As lidar was collected at the points of both landfall and exit, it was possible to determine the effect of the hurricane traveling over Puerto Rico.
The most obvious impact of the hurricane was easily identified in the vegetation by examination of the lidar point cloud. At the point of landfall, the toppling of trees was evident even after the two-year temporal difference in the lidar missions. Similarly, the vegetation difference was obvious between the collections, even in areas as the hurricane exited land.
Most striking were the ground surface-level changes. As is documented above, in the area near the hurricane’s exit path, the hurricane-force winds and rain resulted in surface-level alterations. Ground was mounded, in some places by up to more than one meter, along the hurricane’s path, and comparable depressions, up to a meter deep, representing the soil that was transported, were created. The two-year separation between lidar surveys indicates that these land/surface alterations, which may alter long established drainage patterns, are persistent in the terrain long after the hurricane passes.
Acknowledgements
We thank USGS, the National Oceanic and Atmospheric Administration (NOAA), the Commonwealth of Puerto, and the National Park Service, which funded these projects. We also thank Tim Saultz and Gail Dunn of USGS for their coordination efforts and overall support.
Alvan “Al” Karlin, PhD, CMS, GISP is a senior geospatial scientist at Dewberry, formerly from the Southwest Water Management District (SWFWMD), where he managed all of the remote sensing and lidar-related projects in mapping and GIS. With Dewberry, he serves as a consultant on Florida-related lidar and imagery projects, as well as general GIS-related projects. He has a PhD in computational theoretical genetics from Miami University in Ohio. He is the immediate past president of the Florida Region of ASPRS, an ASPRS Certified Mapping Scientist—Lidar, and a GIS Certification Institute Professional.
Amar Nayegandhi, CP, CMS, GISP is a vice president and director of remote sensing at Dewberry. He oversees the geospatial and technology services group for Dewberry’s contracts with federal, state, and commercial clients. With more than 20 years of experience, he is a recognized expert in topographic and bathymetric lidar data acquisition and processing. Amar has a bachelor’s degree in electrical engineering from the University of Mumbai and a master’s degree in computer science from the University of South Florida. He is a former director of the ASPRS Lidar Division, an ASPRS Certified Photogrammetrist and Certified Mapping Scientist—Remote Sensing, and a GIS Certification Institute Professional.
Raymond Miller, Jr., CP, CMS, GISP is a project manager in Dewberry’s Tampa, Florida, office. He has extensive experience in GIS, remote sensing, and relational database management. He has developed geospatial solutions for water resources, floodplain mapping, and hazard mitigation projects for clients that include the SWFWMD, NOAA and the Florida Division of Emergency Management. His experience includes lidar data production and analysis, digital terrain modeling, watershed evaluation and management planning, floodplain mapping, and geodatabase management. He is a Certified HAZUS Professional, ASPRS Certified Mapping Scientist—Remote Sensing, and a GIS Certification Institute Professional.