National Center of Cartography Romania

Figure 1: Area of LAKI II project. The areas in pink had completed the QC when this map was created.
The National Center of Cartography Romania (CNC) offers specialized technical support to develop and update geodetic and cartographic databases at the national level to fulfill the tasks of the National Agency of Cadaster and Land Registration (ANCPI) and of the territorial offices of cadaster. CNC evolved in 2011 from the Institute of Geodesy, Photogrammetry, Cartography and Land Administration, founded in 1958, and is a governmental institution.
The responsibilities of CNC’s Cartography and Photogrammetry Department (SCF) include:
- permanently provide cartographic data to ensure the geospatial data infrastructure within the INSPIRE Directive
- develop, maintain and update the digital terrain model at the national level, based on the data provided by CNC and third parties
- exploit photographic images using photogrammetric systems
- develop photogrammetric products derived from national cartographic databases
- perform quality control (QC) of projects and works carried out in the field of photogrammetry and cartography.
SCF works with orthophotomaps and lidar point clouds. In these areas, CNC is the national authority that can provide QC for third parties’ products. ANCPI has an ongoing project that involves acquiring images and point clouds, to produce orthophotomaps, DSM and DTM. The project area covers six counties of Romania (Figure 1). SCF’s task for this project, called LAKI II (Land Administration Knowledge Improvement), is QC. As a parallel activity, SCF is carrying out research studies using ALS data.
Editor’s note: A PDF of this article as it appeared in the magazine is available HERE.
VOLTA project
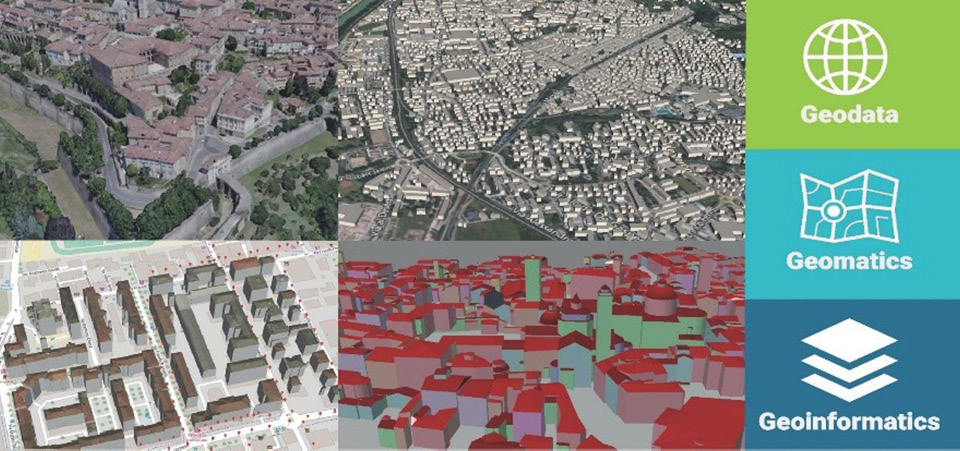
Figure 2: Topics in VOLTA project.
Another important project for CNC is the European research project 734687 — VOLTA — H2020-MSCA-RISE-2016 (innoVation in geOspatiaL and 3D daTA; Figure 2). VOLTA1 is an EU Marie Slodowska-Curie RISE (Research and Innovation Staff Exchange) action designed to realize research & innovation (R&I) among intersectoral partners by exchange of knowledge, methods, and workflows in the geospatial field. CNC’s VOLTA project plans to design and validate innovative processing and handling methodologies for 3D geospatial data to support practical applications of photogrammetric mapping approaches. To accomplish its objectives, the main R&I activities of VOLTA are divided into four interlinked work packages (WP) with two transversal ones responsible for knowledge transfer and training as well as dissemination of the project results. The research activities and knowledge transfer are performed with a series of secondments between partners. The consortium is composed of 13 partners from academic and research institutions, industrial partners and national mapping agencies:
- Fondazione Bruno Kessler (FBK)—Italy
- Technische Universität Wien (TUW)—Austria
- Leibniz Universität Hannover (LUH)—Germany
- Technische Universiteit Delft (TUD)—Netherlands
- Uniwersytet Warszawski (UW)—Poland
- Geodetski Zavod Celje (GZC)—Slovenia
- Vermessung AVT—Austria
- Vexcel Imaging—Austria
- GeoImaging (GEO)—Cyprus
- Institut National de l’Information Geographique et Forestiere (IGN)—France
- Ordnance Survey (OS)—United Kingdom
- Institut Cartogràfic i Geològic de Catalunya (ICGC)—Spain
- CNC—Romania.
 The VOLTA-CNC team is involved in 16 secondments and other events, such as workshops, summer schools and conferences, until 2021. We are proud to work during secondments with such academic partners as TUW, LUH, TUD, UW, IGN, and research institutions such as FBK.
2D-3D data fusion
In this article we show the research activity and results of the secondment from 2018, at the TUW. The secondment was part of WP: Data and sensor integration, with the task 2D–3D data fusion. The supervisor at the hosting institution was Prof. Dr. Norbert Pfeifer, head of the Research Group Photogrammetry in the Department of Geodesy and Geoinformation. Our goal was to give the third dimension to all the water surfaces in the city of Vienna.

Figure 3: Danube River in Vienna. (Source: https://hiveminer.com)
The biggest water polygons were part of the Danube River (Figure 3). The input data consisted of a classified ALS dataset with a density of 15 pts/m2 and a 2D dataset of water surfaces. We worked on 2D-3D data fusion using ALS point clouds in OPALS (Orientation and Processing of Airborne Laser Scanning data, a dedicated point-cloud software suite developed by the Research Group Photogrammetry2). It is a modular program system consisting of small components (modules) grouped together thematically in packages. The aim of OPALS is to provide a complete chain for processing ALS data (waveform decomposition, quality control, georeferencing, structure-line extraction, point-cloud classification, DTM generation) for several fields of application, such as forestry, hydrography, city modeling, and power lines.
The input data consisted of 120 million classified ALS points (X,Y,Z, class) and 28,000 water polygons (X,Y) (Figure 4). As the water polygons originated from a cartographic product, water bodies were broken into individual polygons at bridges and weirs. Some of the water bodies were so small that they were not covered by lidar points. Thus, a subset of bigger water bodies was used in the research.
To perform the 2D-3D data fusion, we considered the water surface to be flat. We also took into account that the Danube River flows through Vienna, entering from the north-northwest and exiting southeastwards. So, we went further and treated the water surface as a slightly inclined plane. With respect to geometry, the best approach is the use of robust planes.

Figure 5: Spatial Model
The first step, in our workflow, was data analysis and filtering. Dataset analysis and statistics were done using QGIS and ArcGIS for the 2D (.shp) dataset, and CloudCompare and ERDAS IMAGINE for the 3D (.las) dataset. Furthermore, data filtering and subsetting, for point clouds using water polygons as AOIs, were performed using a Spatial Model in ERDAS IMAGINE (Figure 5), resulting in 964 files. This was followed by batch processing for file attribute extraction.
Next we made a case study of errors greater than 20 m. This showed that: gross errors could occur as isolated points but for some water bodies multiple outliers occurred; outliers can be high above or far below the water surface, or both; outliers occurred over both large and small water bodies; and it was assumed that the errors could be either classification errors or incorrect range measurements. So, we had 23 water bodies with outliers for the Z value.
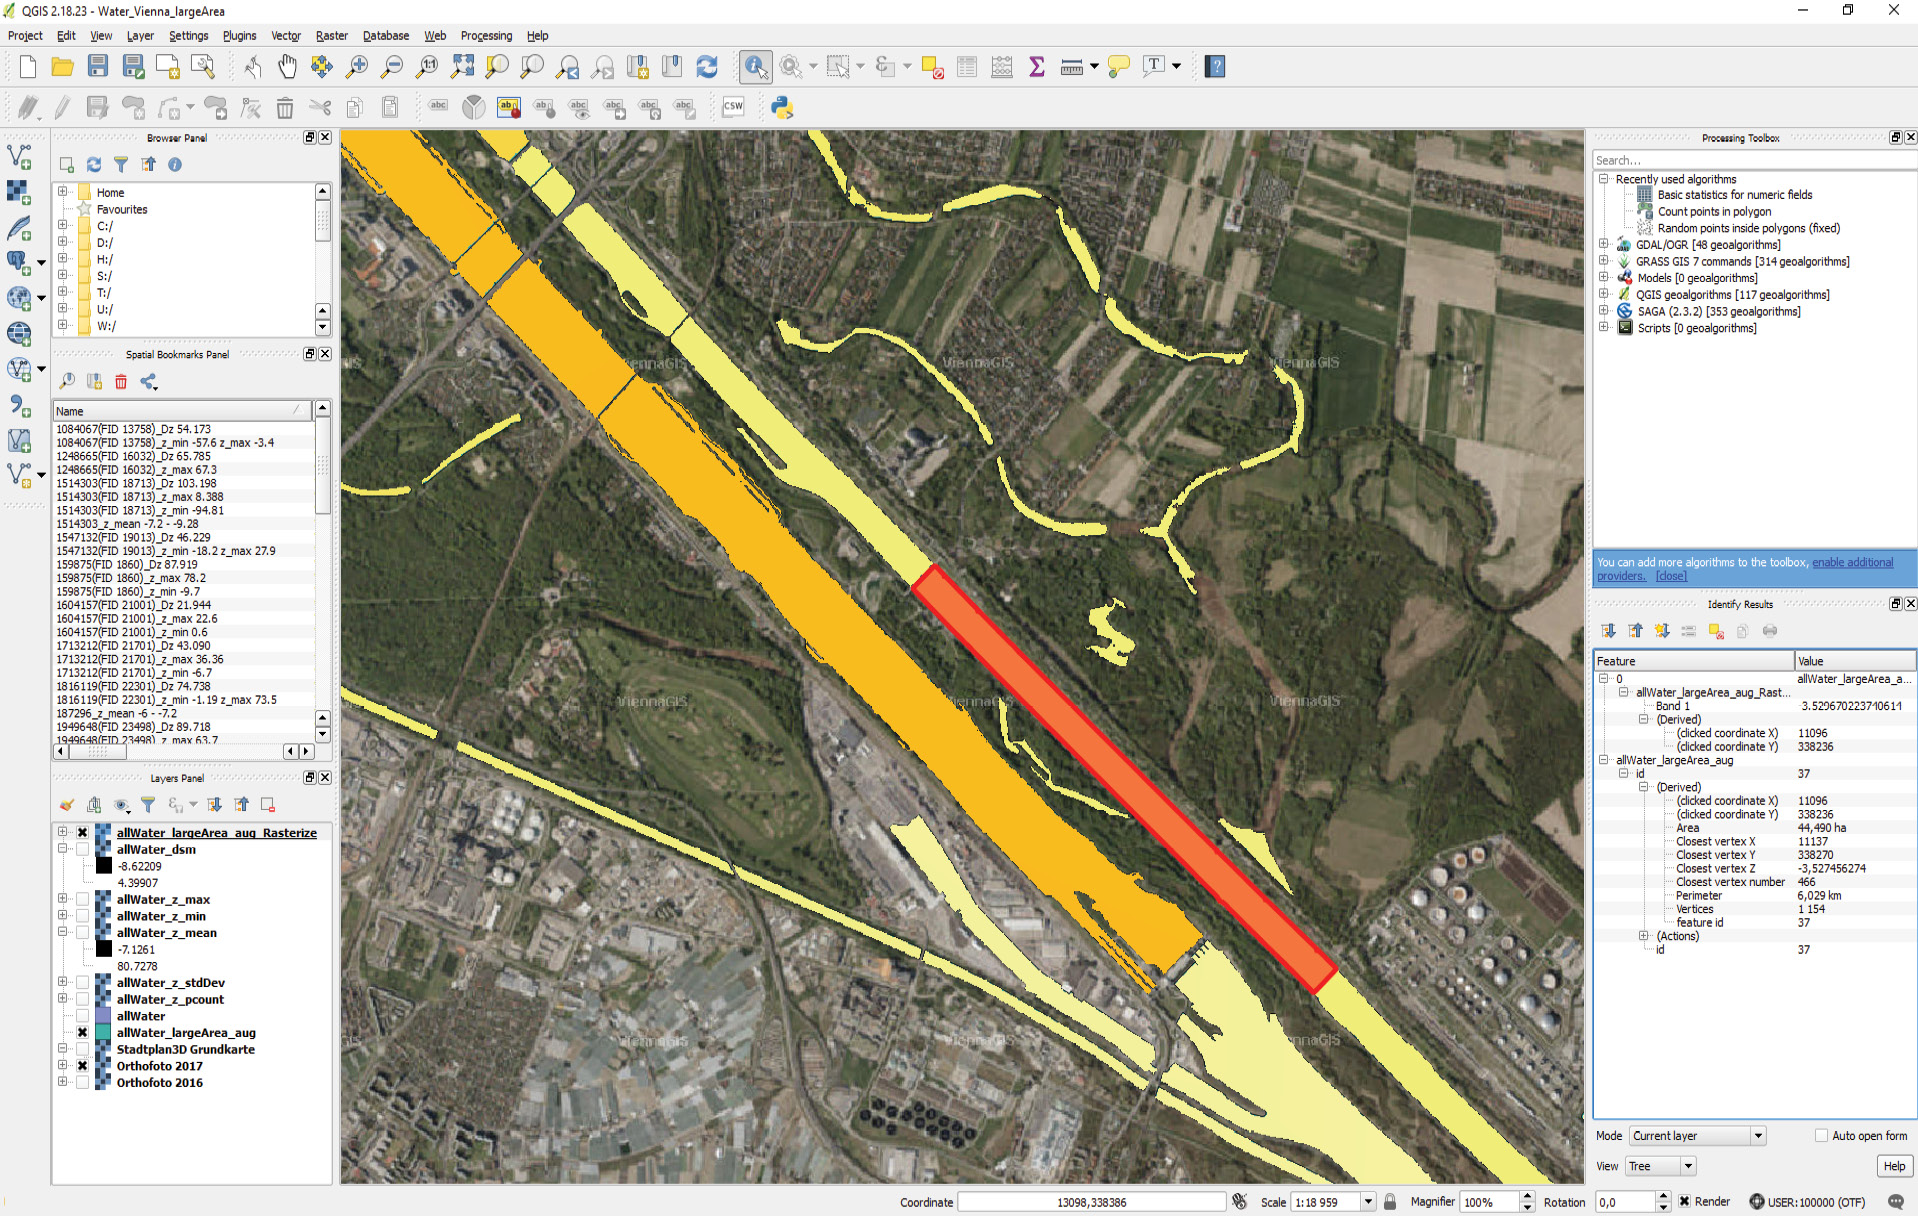
Figure 7: Output data. The background shows the orthophotomap and the water bodies are colored by their heights. One water polygon is selected and its properties are shown.
As a next step, we did a robust plane estimation, using the module ZonalFit (OPALS) for the 3D dataset, for each AOI described by the 2D dataset. The module fits geometry models to a set of data points for multiple regions of interest. Laser scanning results in point clouds describing surfaces rather than single spots of interest. In certain regions, the surface geometry is known a priori. This applies to horizontal areas, tilted planes, or simple curved surfaces. The aim of the module is to compute the best fitting geometric model by least squares adjustment for each region, to calculate the deviations (residuals) for the individual data points and to return both the parameters of the geometries and the statistics of the deviations, such as mean, median, standard deviation, histograms, etc. Robust plane estimation is used to deactivate outliers. For each successful zonal fit, the residuals are computed for all contributing data points and a histogram of the deviations is derived together with standard statistical parameters.
The processing for this step was time-consuming, because of the large number of points, so we used the filter Generic [random(uniform_int,1,N) == N]. This randomly selected every N-th point for computing the histogram.
Final results
Using the geometric parameters obtained (A, B, C, D, dX, dY, dZ, which are the plane parameters and a reference point) in the previous steps, we computed the third dimension for the polygon vertices, using a Python script (Figure 7).
It was visually verified that the water polygons were assigned correct elevations, by comparison to lidar points within the polygons and in the surrounding areas. It was necessary to consider outliers, which are points not lying on the water surface. As discussed, these outliers originated in different steps of the preceding workflow.
To conclude, it can be said that an automatic workflow for 2D-3D-fusion was successfully developed using OPALS and Python scripts. Earlier in the workflow, a rigorous data analysis was necessary, studying a number of particular cases. This step was performed using ERDAS IMAGINE software. The robust plane estimation using module ZonalFit (OPALS) was a suitable choice for computing the third dimension for water bodies, but also for the elimination of outliers.
Acknowledgments
The secondment of Adrian Pârvu was supported by the VOLTA project. The lidar point cloud of Vienna was provided for research purposes by the City of Vienna.