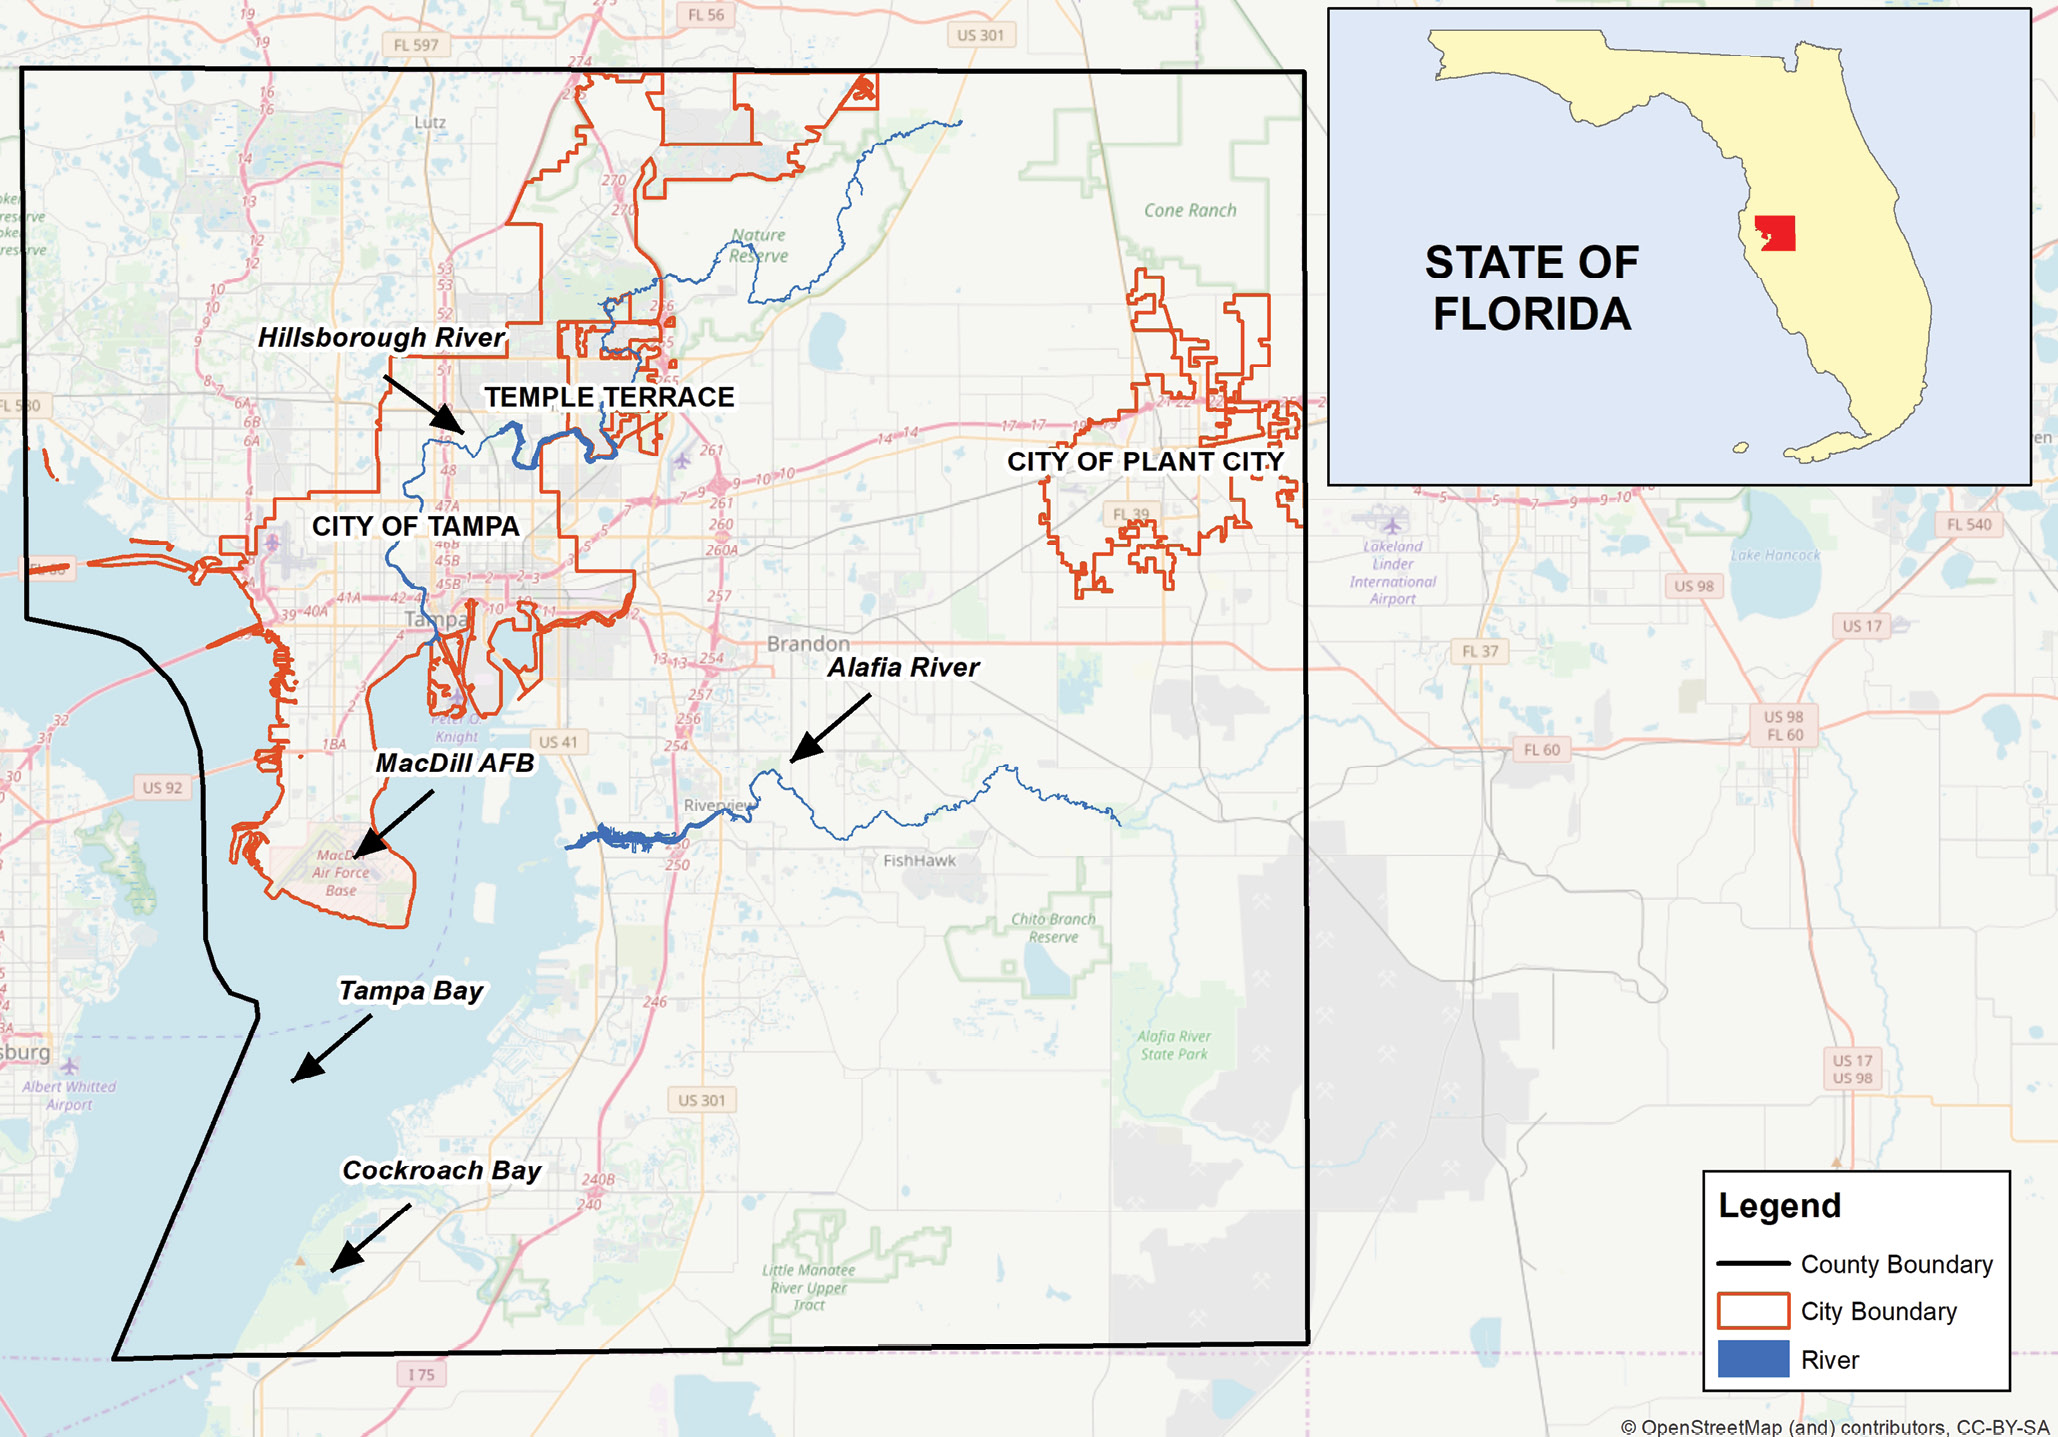
Figure 1: Location and boundaries of Hillsborough County, Florida. Source: http://www.census.gov., 2020
Tropical Storm (TS) Debby rolled through the Tampa Bay, Florida, area in late June 2012, dropping over 12 inches of rain in a 24-hour period, very close to the design storm for water modeling. Following TS Debbie, the area did not see any major tropical storms or hurricanes until the summer of 2015, when it experienced record-breaking, non-hurricane-related rainfall. In a series of summer 2015 rainfall events, the region received more than 38 inches of rain during a two-month period. These deluges led to isolated flooding throughout the region and the need to reexamine and update existing stormwater and flood models.
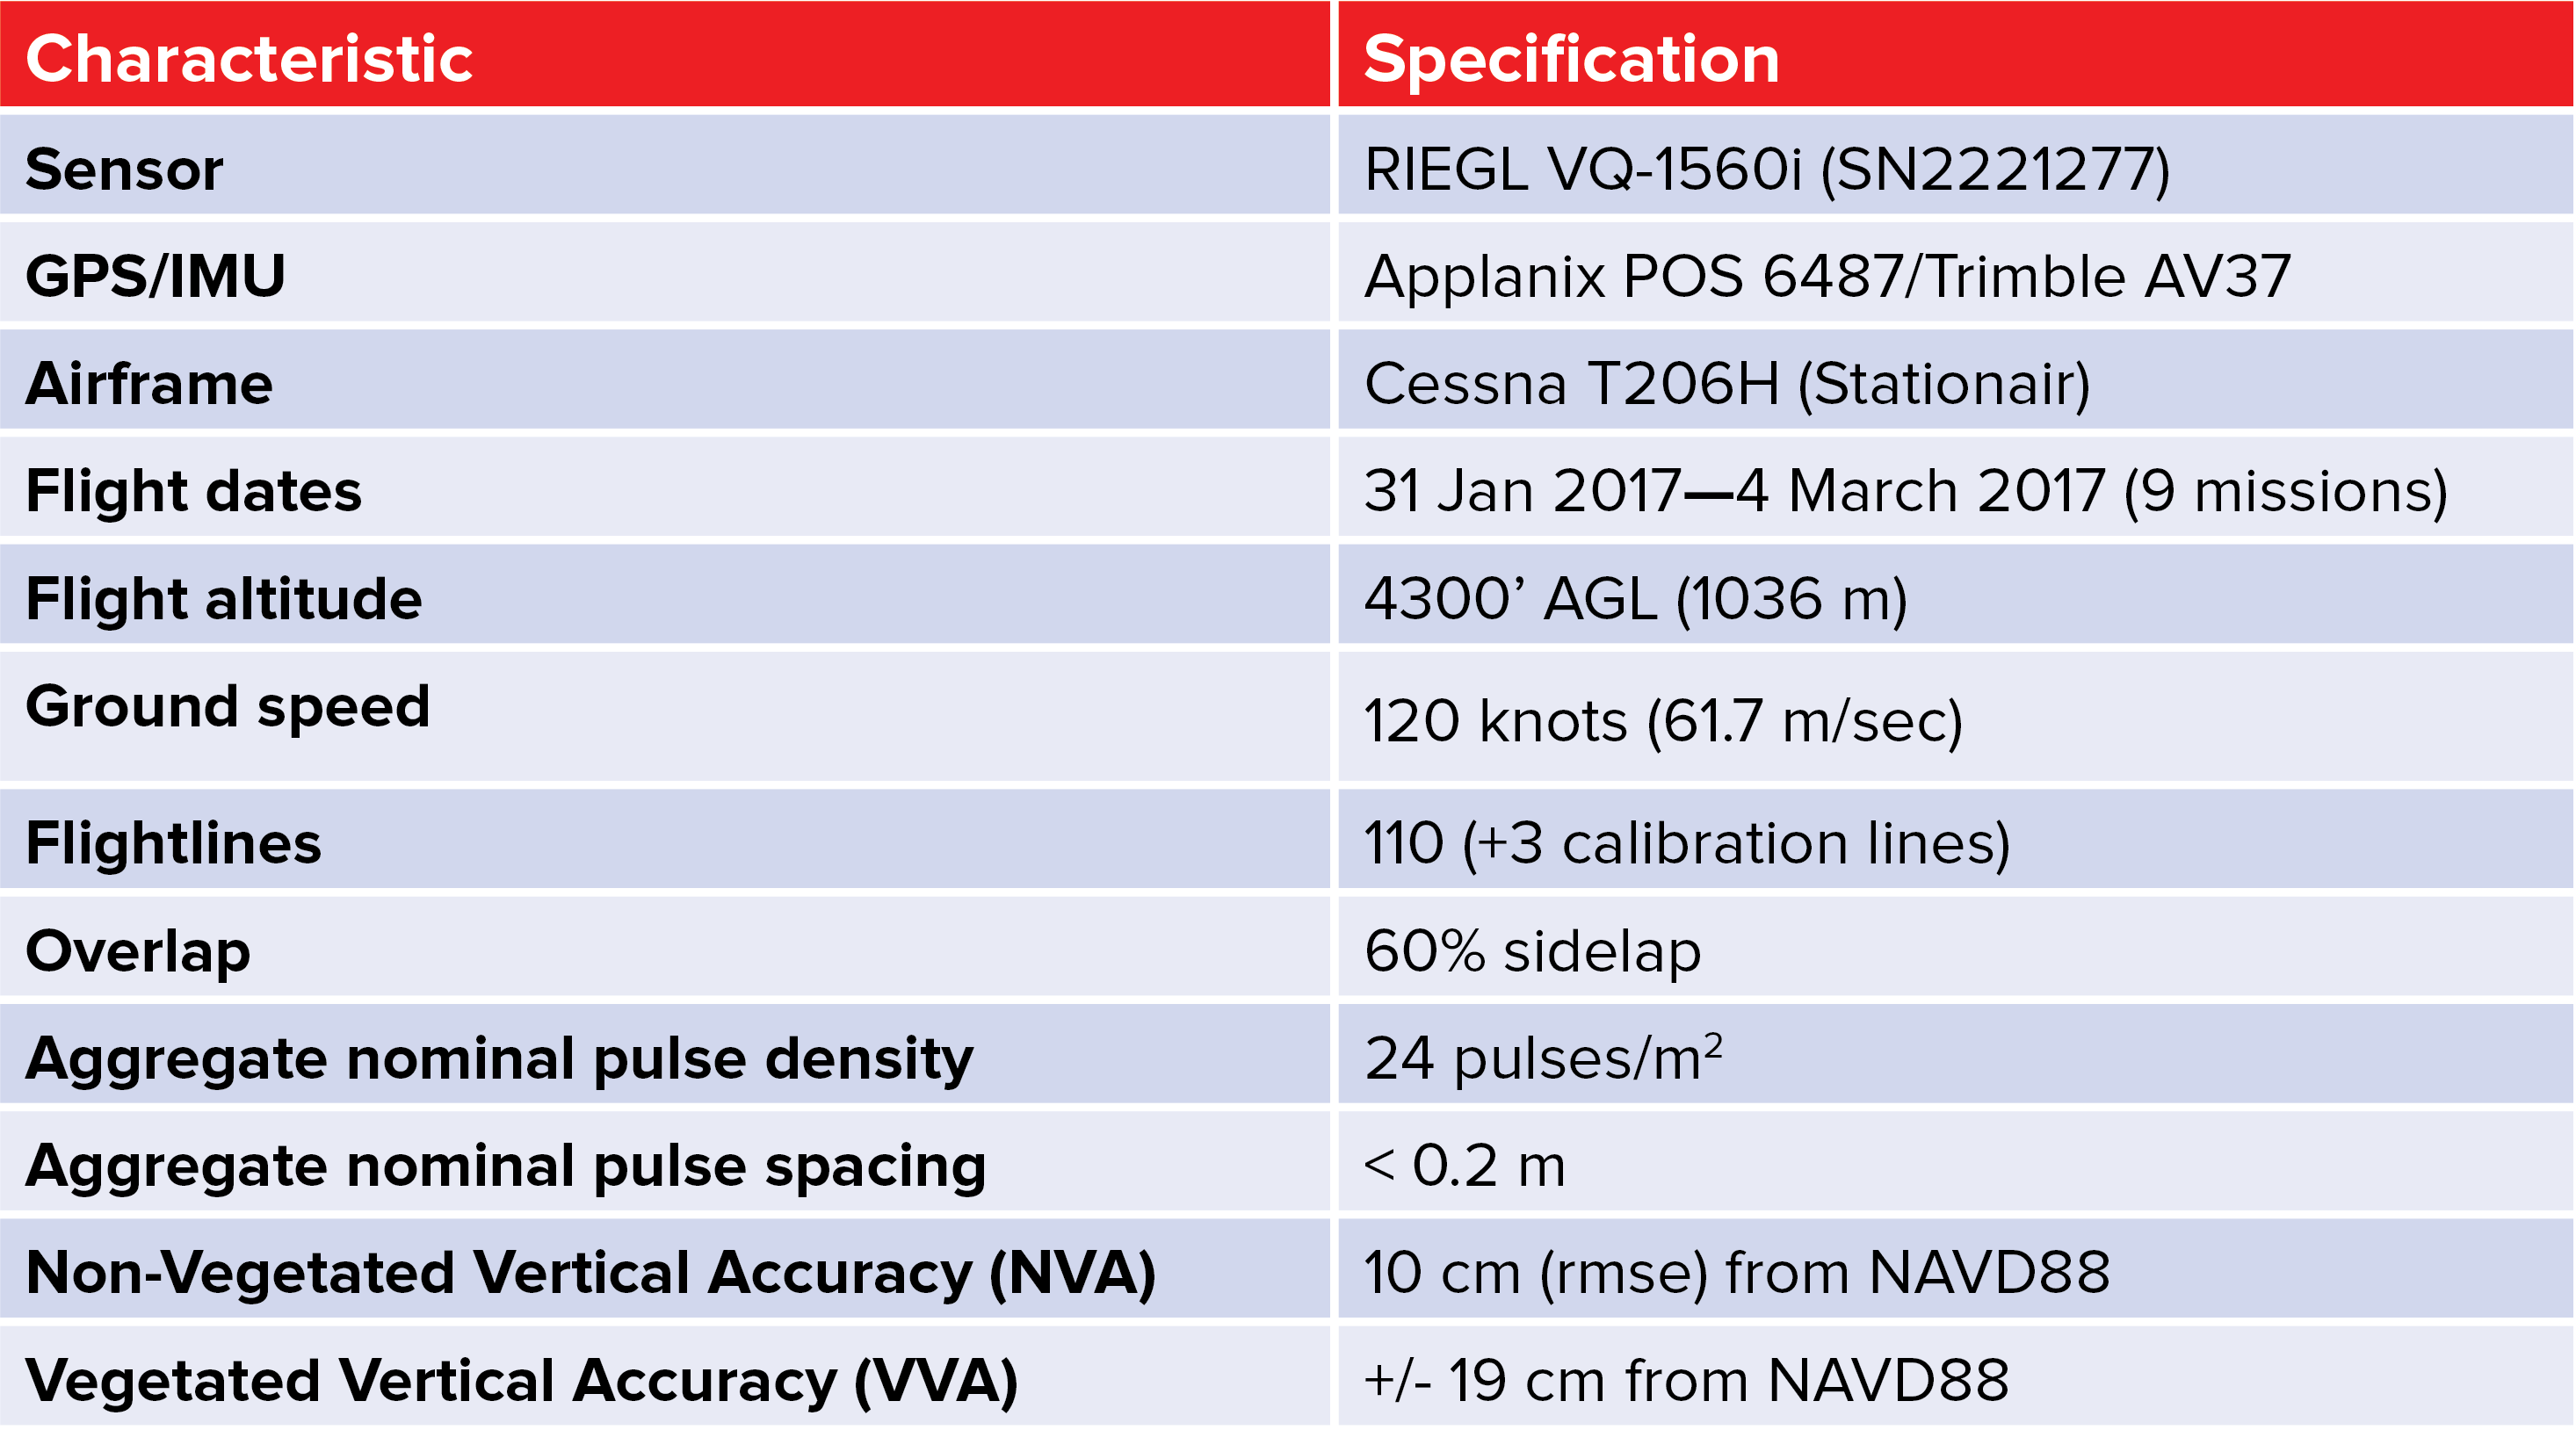
Table 1: Hillsborough County mission lidar acquisition design and specifications.
The Southwest Florida Water Management District (SWFWMD), through its Watershed Management Program, cooperates with counties and cities to maintain and update stormwater/surface water—also hydrological and hydraulic (H&H)—models for the district’s 16-county area, which includes Hillsborough County and the City of Tampa. Since SWFWMD is a Federal Emergency Management Agency (FEMA) Cooperating Technical Partner (CTP), the floodplain delineations that result from the H&H models are used to update the Digital Flood Insurance Rate Maps (DFIRMs). Therefore, the base H&H model topographic data must conform to the FEMA guidelines for topographic mapping1 and the use of lidar technologies. The existing county lidar data, acquired in 2007, however, did not meet FEMA and U.S. Geological Survey (USGS) specifications (USGS LBS v1.3)2 and could not be used for updating the models.
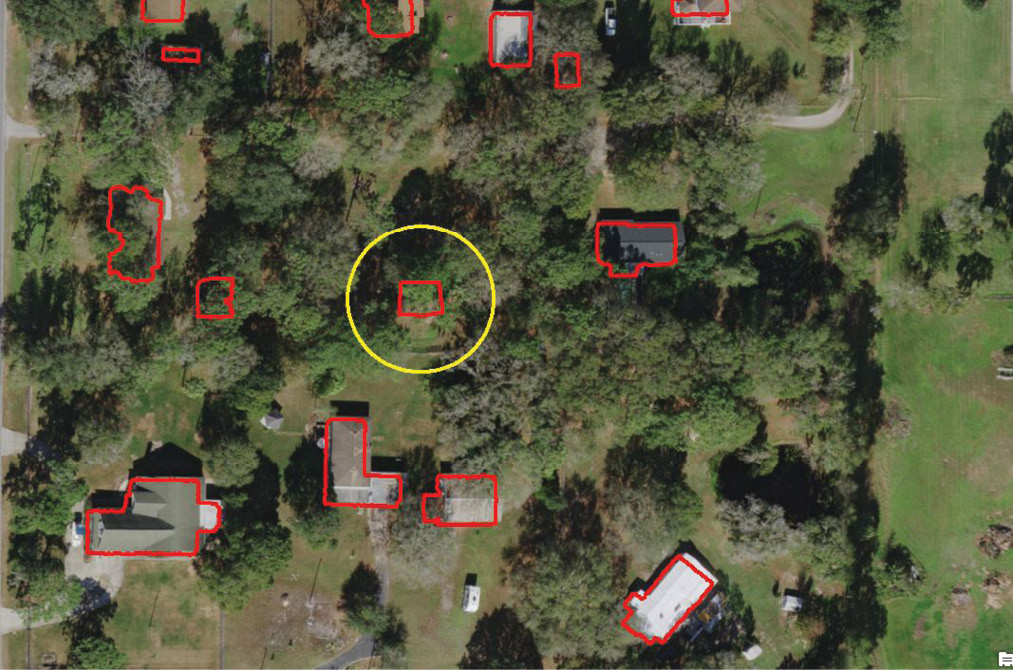
Figure 2a: Aerial image showing areas in unincorporated, rural Hillsborough County where buildings are obscured/partially obscured (yellow circle) by tree canopy.
Because lidar forms the topographic basis for the stormwater model updates and the existing 2007 lidar data was not meeting the FEMA/USGS specifications, a new lidar survey was necessary. Accordingly, SWFWMD partnered with the Public Works Department of Hillsborough County and the Stormwater Engineering Division of the City of Tampa to plan and fund a new lidar mission for the county and city.
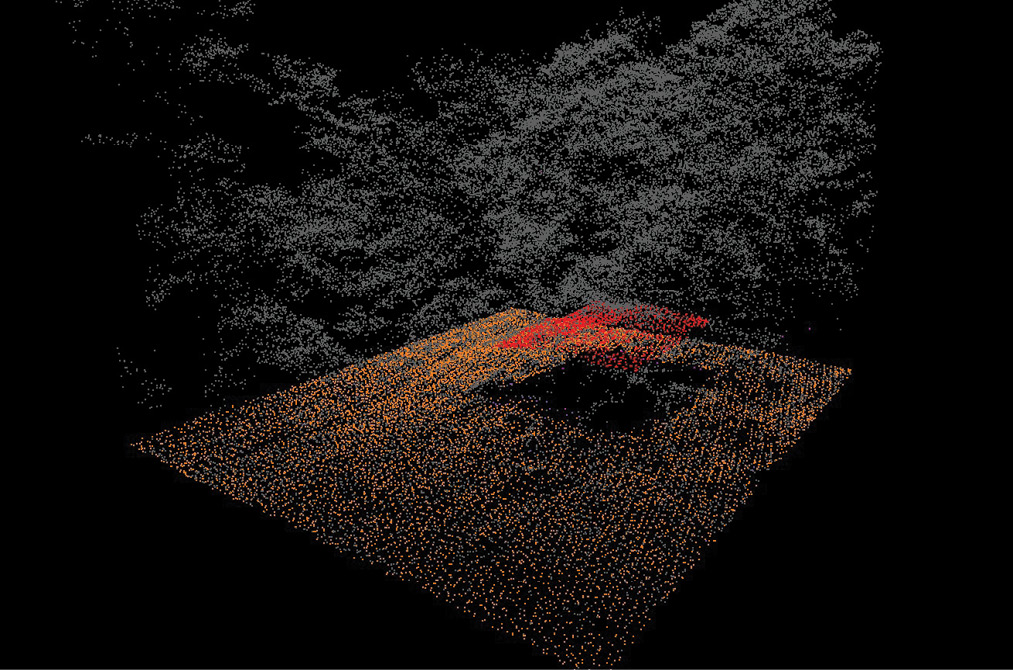
Figure 2b: Obscured shed roof (red points) in the yellow circle (above) in the high-density lidar point cloud.
During the planning phase, it was determined that there would be multiple uses for the new data beyond the stormwater/surface water modeling. A “map once, use many times” approach to the project emerged and was embraced by the three cooperating partners. With this agenda in mind, SWFWMD issued a request for proposals, and, rather than specifying any particular sensor or technology (linear, Geiger, flash, etc.), provided a set of highly detailed specifications for both the expected point cloud and breaklines for the potential responders to consider.
Dewberry won the solicitation, in part because the firm presented a sensor-agnostic approach. Rather than proposing a sensor or lidar technology, Dewberry proposed to determine the sensor(s) and flight plan(s) that would best meet the multiple needs of the cooperators, and still remain within budget. In 2016, after a thorough review, Dewberry helped SWFWMD determine that the best course of action would include a new Riegl VQ-1560i sensor and a flight plan to utilize an aggregate nominal pulse density (ANPD) of 24 pulses per square meter, which would accomplish the “map once, use many times” objective.
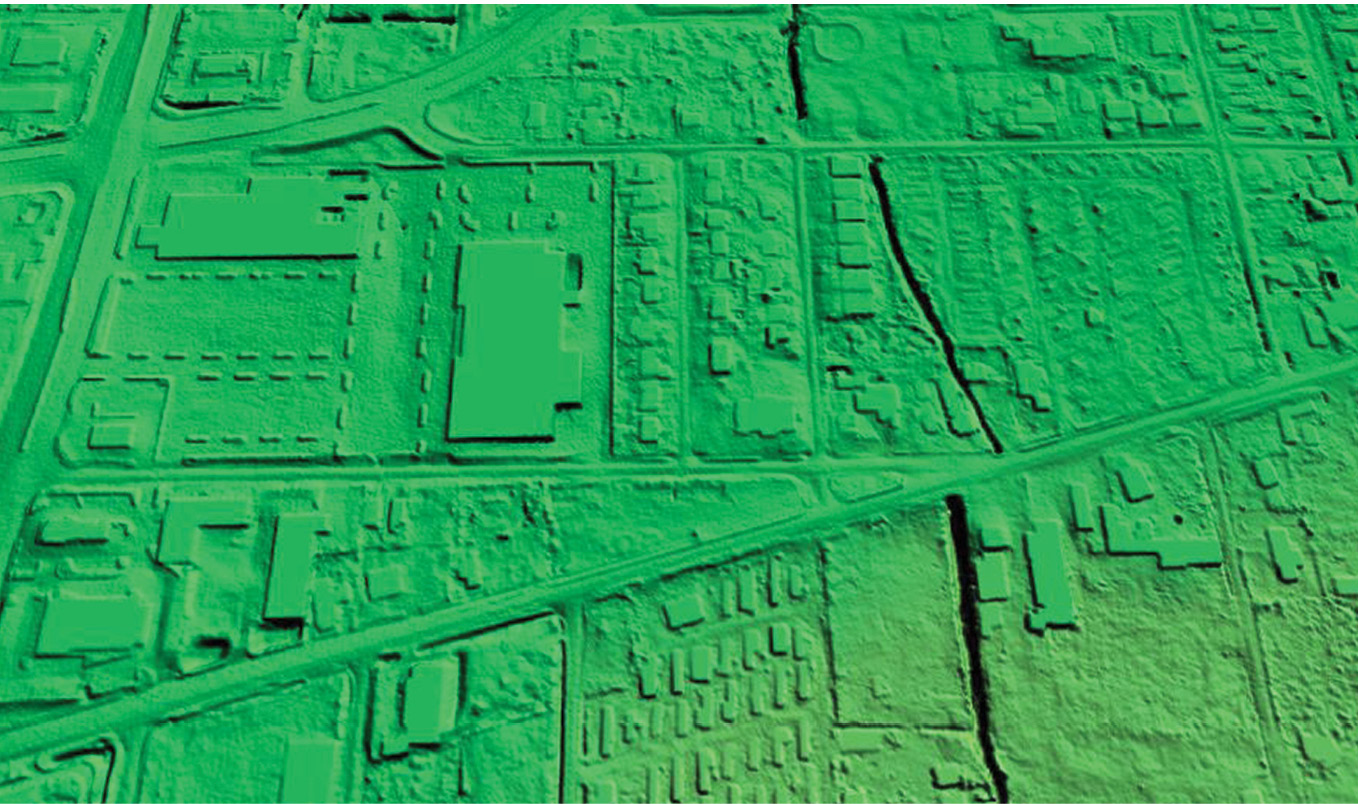
Figure 3: Modified digital terrain model (DTM) with building footprints interpolated from driplines. Building rooftops were conflated and used to create slightly elevated building footprints as rendered in GlobalMapper.
The mission was planned for a single sensor during the early winter of 2017 (15 December 2016 – 28 February 2017).
Mission Details
Hillsborough County, approximately 1192 square miles in extent, is located on the west coast of Florida with Tampa Bay along its western boundary. The lidar acquisition was planned to exceed the FEMA/USGS pulse density/spacing specifications for FEMA/USGS Quality Level 1 (ANPD > 24 pulses/m2) and map to—at a minimum—North American Vertical Datum of 1988 (NAVD88) 0-feet (ellipsoidal height adjusted to orthometric heights using GEOID12B) on the tidally-influenced western boundary. The mission specifics are given in Table 1.
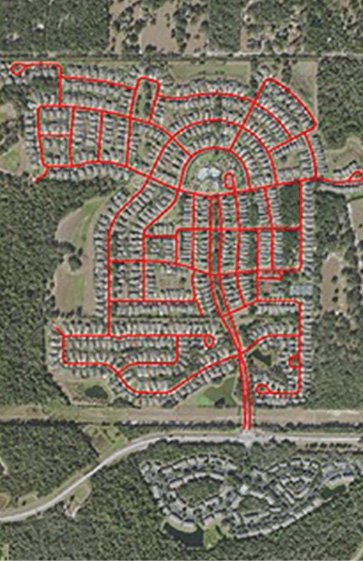
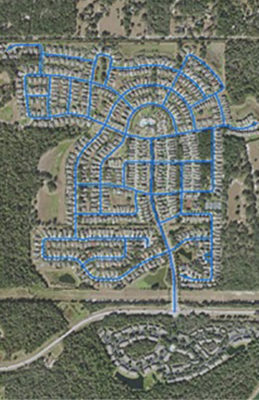
Figure 4: Maps showing results of comparing heads-up digitizing of street features (in blue, in left-hand panel) from recent imagery versus pavement feature extraction from lidar (in red, in right-hand panel) intensity imagery. There was almost complete correspondence of the final vectorized maps. Courtesy of Hillsborough County, Public Works.
 Challenges to Data Acquisition
The Hillsborough County area of interest presented three major challenges to the collection mission, including weather, airspace accessibility, and tides.
- Although late-fall/early-winter is typically the driest portion of the year, the late summer and early fall of 2016 were exceptionally rainy (12 inches of precipitation through November) as Hurricane Hermine brushed the area, leaving some wetlands and low-lying areas saturated into the late fall and early winter months. As it was paramount to collect the data during the driest portion of the year, and having recently followed an abnormally rainy period, acquisition missions were curtailed for a minimum of 72 hours following a rain event over half an inch. This was necessary to permit water levels to recede and soils to drain.
- Tampa is home to MacDill Air Force Base, which serves as the headquarters for the Southern Command (USSOCOM), and Tampa International Airport (TIA), a 24-hour, international service airport. Airspace issues in the control of these installations required close coordination with both Federal Aviation Administration and Military Air Traffic Control.
- One of the goals of the project was to collect elevation data to a minimum of NAVD88 0-feet along coastal features. This southwestern portion of the peninsula of Florida experiences two daily tidal cycles: when missions extended over six hours in duration, therefore, tidal variations along the coastline, through Tampa Bay, and into the Hillsborough and Alafia Rivers required careful monitoring. The tidal/temporal variations necessitated a series of elevational-stepped CoastalFeature polygon breaklines.
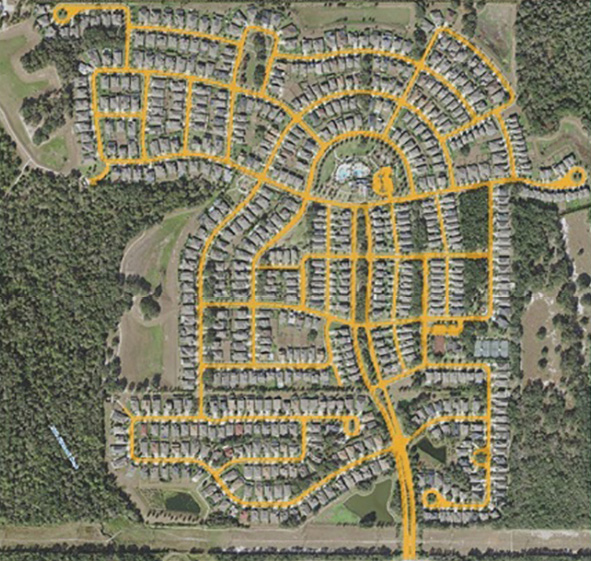
Figure 5: Map showing impervious road surface feature as extracted from the high-density lidar. Courtesy of Hillsborough County, Public Works.
Special Considerations and Challenges
CoastalFeature-Breakline: The eastern Gulf of Mexico typically experiences two low tides and two high tides per day, which complicates mission planning along the coastline. As budget would not permit tide-synchronized collection, coastal tidal stations were required to be monitored during acquisition, and, in order to maximize acquisition efficiency, the mission specified that ground would be collected to, at minimum, NAVD88 0-feet. This resulted in temporal variation along Tampa Bay and upstream into the Hillsborough and Alafia rivers, so a series of CoastalFeature breakline polygons were developed to indicate the end of mapping; this feature was not designed to represent the shoreline.
Hydro-Breaklines: Breaklines are typically collected to support a lidar-derived digital elevation model (DEM) to be used for H&H modeling. USGS LBS v1.3 specifies breaklining waterbodies over two acres as polygons, and rivers/streams over 100 feet wide as dual-line drains. The breaklines are collected at the water’s edge. These data are then used to hydro-flatten the DEM. Hillsborough County contains only two rivers, however, the Hillsborough River and the Alafia River, which exceed the 100-foot-width criterion in some places. Similarly, most stormwater retention ponds in the county are under two acres; typical engineered stormwater retention ponds average approximately 0.5 acre. Finally, there are hundreds of miles of water conveyances (creeks, channels, ditches, canals, etc.) that are under 10 feet in width, but are important to the stormwater/surface water models.

Figure 6: The Cockroach Bay, Hillsborough County parcel (gray line) showing the SUL as surveyed (blue line), the 0.85-foot NAVD88 contour as generated from the lidar (yellow) and the MHW (0.35’ contour) as surveyed (red).
To accommodate the H&H models, (1) waterbodies 0.5 acre or larger were captured as single-elevation (Z-locked) polygons, and (2) all flowing rivers, creeks, and ditches over eight feet wide were collected as dual-line drains (DLDs), with two lines representing the opposing banks with varying elevations, but monotonically flowing downhill. After inspection of the classified bare-earth data, it was determined that drains less than eight feet wide that were not flowing were clearly visible in the point cloud, so these drains were not breaklined. Drains that were flowing and less than eight feet wide, however, were captured as varying elevation, monotonically flowing downhill, single-line drains (SLDs) along the thalweg of the drain.
Connectors: Although major bridges carry traffic over Tampa Bay, most roads are maintained at ground level and drains are carried under roads by pipes and culverts. Upon inspection, the headwalls on pipes were often visible in the point cloud but the invert elevation of the pipe was difficult to determine. Because the drains, DLDs, and SLDs were interpolated into the DEM for hydro-conditioning, it was necessary to insert hydro-connectors to represent the under-road pipes. These connectors served as place-holders for surveyors to measure the invert elevations for H&H modeling.
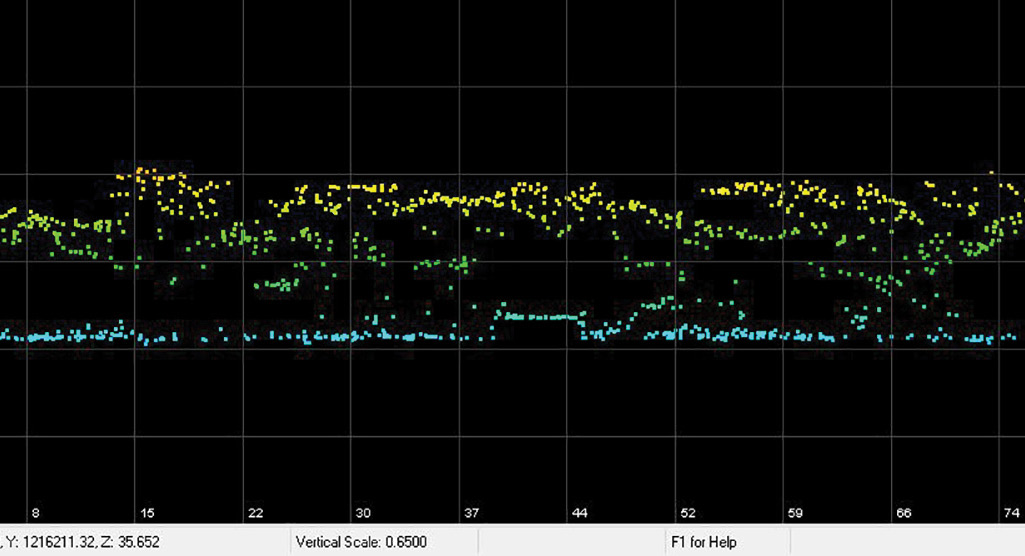
Figure 7: Profile view showing the elevated boardwalk under dense vegetation.
Building Footprints: Impervious surface characterization was a consideration of the cooperators. H&H models take into account both directly connected impervious area (DCIA), including paved roads, driveways, sidewalks, and parking lots, and non-directly connected impervious area (nDCIA), including rooftops, in their surface runoff calculations. For this project, the cooperators agreed to include American Society for Photogrammetry and Remote Sensing (ASPRS) Class 6 (rooftops) classified in the lidar and to use that classification to derive rooftop—dripline—polygons for nDCIA estimates. The highest ground elevation within 2.5 feet of the dripline polygon, plus one-half foot was used as the base elevation of the foundation and interpolated into the DEM.
The three cities in Hillsborough County, Tampa (1855), Temple Terrace (1920), and Plant City (1885), are all older cities incorporated over a century ago. While newer subdivisions are being built, there are also unincorporated, rural tracts dating to the early 1950s. Typically, the roofs in all but the newest subdivisions are partially, if not totally, obscured by grandfather trees, over 50 year-old oaks, and other species, as in the example below. Here, although the lidar penetrated through the trees and reflections were recorded from the rooftop, automated filtering routines failed to properly classify all of the returns (Figures 2a and 2b). Thus considerable manual classification was required.
Fly Once, Use Many Times: Novel Uses for High-Density Lidar

Figure 8: Digital Surface Model (DSM) derived from the high-density lidar, as rendered in QT Modeler. Courtesy of Dr. Shawn Landry, School of GeoSciences, University of South Florida.
While it was clearly acknowledged that the main purpose of the new QL1+ lidar would be to update H&H models for floodplain delineation, the cooperators also wanted the data to serve additional purposes. Below are a few additional uses of the data, beyond the H&H modeling.
City of Tampa
To facilitate the evaluation of structure flooding, well-defined rooftop/dripline polygons were extracted from the ASPRS Class 6 high-density lidar. The rooftop/dripline polygons were conflated to the highest ground (ASPRS Class 2) elevation within 2.5 feet, then an additional 0.5 feet added to that elevation to estimate a finished floor elevation for non-elevated buildings. The finished floor elevation was assigned to the rooftop/dripline polygon and was used to interpolate the rooftop/driplines into the DEM (Figure 3). This resulted in building pads being visible in the DEM with elevations approximating the finished floor.
Users were enthusiastic. “I really like how the footprints of the structures are more extruded in the DEM, which helps us evaluate structural flooding more accurately for floodplain mapping purposes,” enthused Ben Allushuski, CFM, Stormwater Engineering Division, Transportation and Stormwater Services Department, City of Tampa.
“I am just starting to work with the Hillsborough County data and am loving the point density,” added Dr. Steven Fernandez, School of Public Affairs, University of South Florida.
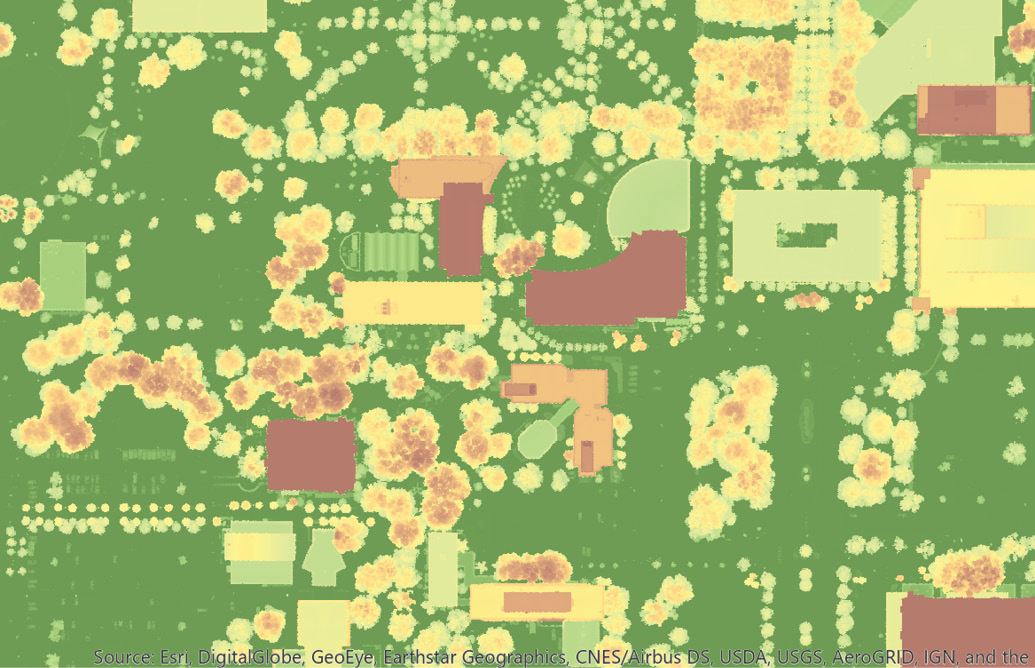
Figure 9: Normalized Digital Surface Model produced by combining high-density lidar with seasonal imagery as rendered in Esri-ArcMap. Courtesy of Dr. Shawn Landry, School of GeoSciences, University of South Florida.
Hillsborough County Planning
The Hillsborough County Planning Department faces an issue with each new subdivision: the street map requires updating as the new streets are paved. In the past, the task of adding the new streets to the county map had been performed either by extracting the data from CAD drawings, georeferencing the CAD data to imagery and then trying to fit the data, or by heads-up digitizing from newly flown aerial imagery.
To test the effectiveness of using the lidar intensity imagery to extract the curb-to-curb pavement in a new subdivision, the Hillsborough County Geospatial Services Department conducted an experiment. The best compilers and analysts were given a recent aerial image in RGB format and instructed to compile the street map. A second analyst was given the intensity imagery for the same new subdivision and instructed to use Esri Image Analyst tools to extract the road network. Both sets of analysts were timed, as a measure of effort, and the results analyzed for spatial accuracy as judged by a third reviewer. Total impervious surface area was reported. The results indicated (1) no difference in the centerline configuration (Figure 4), (2) less than 3% difference in total length, (3) between 6 and 8% difference (cul-de-sacs and other variables) in total impervious surface (Figure 5), and (4) a more than 50% increase in efficiency using lidar intensity to map the new subdivision.
“I also really, really like how you can very clearly see the end of pavement on the streets, the high points in the road and where the curbing is located,” commented Allushuski.
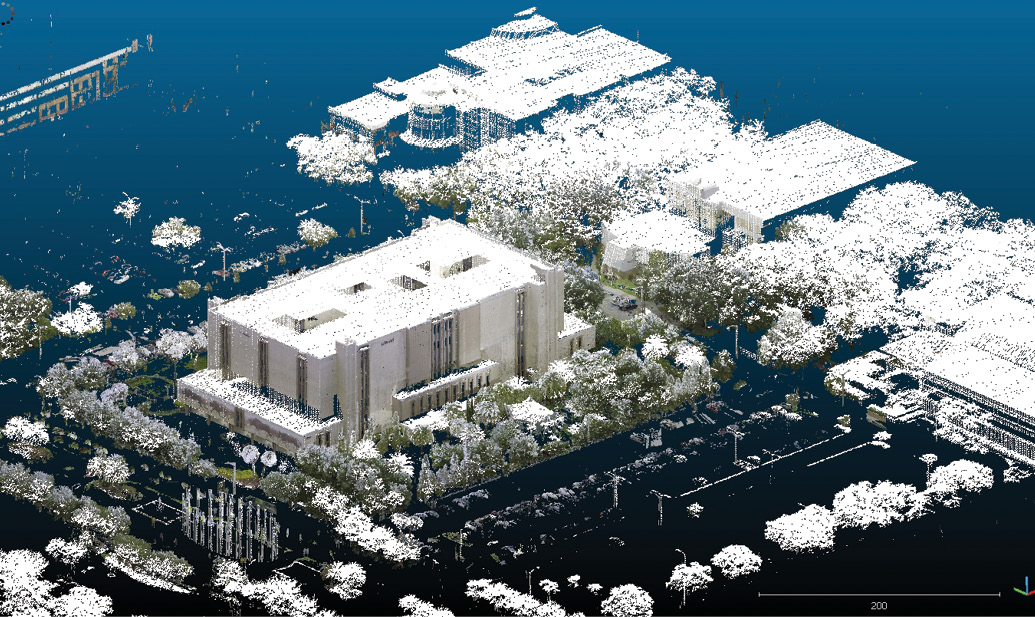
Figure 10: USF Library rendered with high-density airborne lidar fused with terrestrial scan lidar. Courtesy of Dr. Lori Collins and Simon Ahn.
Southwest Florida Water Management District—Survey Section
Although the major use of the high-density lidar data at SWFWMD is for H&H modeling and floodplain delineation by the Engineering and Watershed Management Section, the district often finds additional uses for the data. James Owens, PSM, Survey Supervisor, was tasked with a boundary survey for a coastal parcel in Cockroach Bay, Hillsborough County, Florida.
Three elements were to be mapped: (1) the mean high water level (0.35’ NAVD88; not shown), (2) the safe upland line (SUL), i.e. a line at or above the mean or ordinary high water line used to calculate the acreage of land (0.85’ NAVD88; blue line in Figure 6), and (3) a boardwalk and deck, which was in a state of disrepair (Figure 7). Further complicating the survey, the Cockroach Bay parcel in question was heavily overgrown with black mangrove trees and other vegetation, making conventional survey reconnaissance difficult (Figure 7).
Although the lidar-generated 0.85-foot NAVD88 contour showed a much more aggressive position than the surveyed SUL, it closely follows the surveyed Mean High Water (MHW) line. Since the expected Vegetated Vertical Accuracy (VVA) for the lidar was ~0.6-feet NAVD88, it was not surprising that the lidar-derived contour would fall somewhere between the MHW and the SUL. Hence, the lidar-derived contour served as a guide for the ground surveyors.
“The lidar-derived contour of the MHW line (0.35 feet NAVD88) and Safe Upland Line (0.85 feet NAVD88), and the verified location of the boardwalk, were extremely useful in the course of doing the survey,” confirmed James Owens, Survey Supervisor, Southwest Florida Water Management District.
University of South Florida—School of GeoSciences
Drs. Shawn Landry and Ruiliang Pu have an ongoing research project aimed at improving the accuracy of the mapping of urban tree species using multispectral imagery. Their most recently published article explained the use of multi-seasonal imagery (four images spanning the seasons). Since acquiring the 2017 high-density lidar for the Tampa study area, Landry and Pu have processed a high-resolution (0.5 m) normalized DSM (height above ground) raster dataset from the LAS data (Figure 8). The lidar-derived nDSM (Figure 9) combined with the multi-seasonal imagery within an object-based image analysis framework improved the accuracy of tree-species mapping.
University of South Florida—USF Library
Dr. Lori Collins in the Digital Heritage and Humanities Center Libraries is utilizing the Hillsborough data to examine archaeological sensitivity (very high site-potential) areas. Much of Collins’s research examines site location and land management concerns. She uses DEM and DSM modeling with site location data to better delineate boundaries for ancient shell mounds and middens and to examine potentials for erosion and impact in relation to the known locations. The lidar-derived DEMs and DSMs are also used for prospecting purposes and target areas for ground truth verification.
A graduate student in geoscience, Kyutae “Simon” Ahn, is also benefitting from the high-density lidar data, which he is using as part of a project where he is combining terrestrial laser scanning (TLS) data with airborne laser scanning data (ALS) in order to efficiently map structures and built environments (Figure 10). He has been surveying the University of South Florida (USF) Library structure and related neighboring buildings on campus, using the ALS data to provide coverage for large landscapes and areas such as rooftops, and determining best approaches for combining data to represent and study architecturally complex buildings.
Conclusions
The final lidar dataset was delivered to the three cooperating agencies at the end of June 2018, so the projects illustrated above were based on interim deliverables. While the SWFWMD will be using the data primarily for FEMA floodplain updating, the county and city have additional uses. Those proposed include a tree canopy survey and heat island analysis, solar potential for roof exposure on both public and residential buildings, road and road feature/signage extraction, and public right-of-way slope/aspect determination for maintenance.
Alvan “Al” Karlin, PhD, CMS, GISP is a senior GIS professional at Dewberry, and was formerly with the SWFWMD, where he managed all the remote sensing and lidar-related projects in mapping and GIS. With Dewberry, he serves as a consultant on Florida-related lidar and imagery projects, as well as general GIS-related projects. He has a Ph.D. in computational theoretical genetics from Miami University in Ohio. He is the immediate past president of the Florida Region of ASPRS, an ASPRS Certified Mapping Scientist—Lidar, and a GIS Certification Institute Professional.
Amar Nayegandhi, CP, CMS, GISP is vice president and director of remote sensing at Dewberry. He oversees the geospatial and technology services group for Dewberry’s contracts with federal, state and commercial clients. With over 20 years of experience, he is a recognized expert in topographic and bathymetric lidar data acquisition and processing. Amar has a bachelor’s degree in electrical engineering from the University of Mumbai and a master’s degree in computer science from the University of South Florida. He is the director of the ASPRS Lidar Division, an ASPRS Certified Photogrammetrist and Certified Mapping Scientist—Remote Sensing, and a GIS Certification Institute Professional.
Keith Patterson, PMS, GISP is a senior project manager at Dewberry. He manages multiple lidar, remote sensing and image interpretation projects for federal and state clients. As a Florida-licensed Surveyor and Mapper, Keith is responsible for assuring that data meet Florida state standards and ASPRS accuracy specifications. He received his bachelor’s degree in geography from the University of South Florida. Keith is also a GIS Certification Institute GIS Professional.
Acknowledgements: As with most large, county-wide projects, many people are involved in multiple aspects. We want especially to acknowledge the contributions of the following: Robin Bailey, Yuan Li, Jim Owens and Nicole Hewitt, from the SWFWMD; Fred Hartless and the Hillsborough County Geospatial Services Department (Freddy Delgado-Rivas, Terri Dempsey, Sarita Karki, Sarah Ellis, Erick Sumner, Chin-Feng Ho); and Ben Allushuski and Alex Awad from the Stormwater Engineering Division, Transportation and Stormwater Services Department, City of Tampa. Special thanks are due to the contributing faculty from the University of South Florida: Drs. Shawn Landry, Lori Collins and Stephen Fernandez.