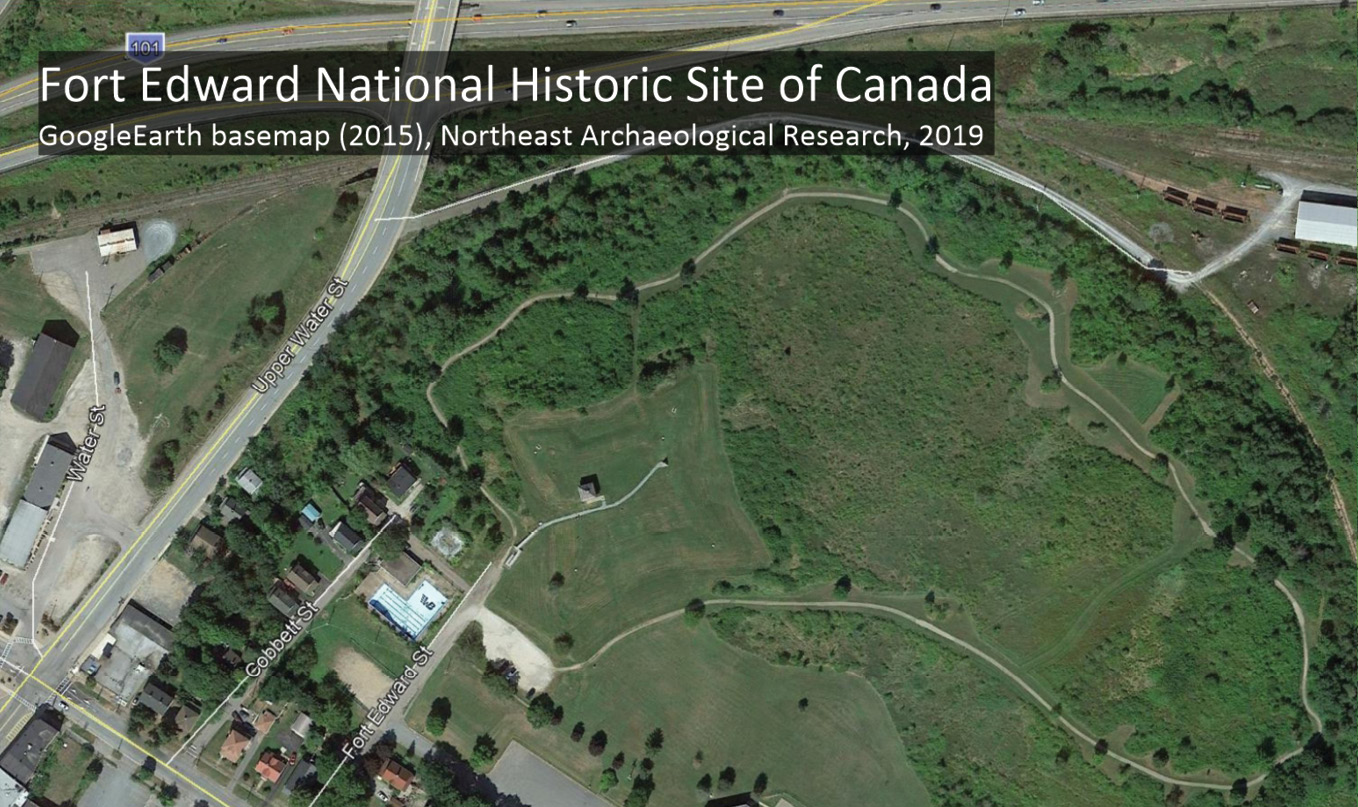
 At ground level, a wooden blockhouse is the best indication that the Nova Scotia site once served as a military fortification. Otherwise, all that remains of Fort Edward is a series of grass-covered mounds and ditches, its classic design lost to the elements—until recently. An archaeologist is using lidar and 3D visualization to bring the 18th century fort back to life so its star-shaped architecture can be studied in detail for the first time.
Also hard for a visitor to imagine, standing on what is now a national historic site managed by Parks Canada, is the critical role Fort Edward played in the development of two cities located more than 2000 miles apart—Halifax and New Orleans. In 1750, the British built the fort 60 kilometers north of Halifax to protect the Crown’s interests there. The location of the outpost was chosen to keep an eye on French Catholics, known as the Acadians, who lived in the area.
“The French were eventually driven from the region…and Fort Edward then served as the deportation center,” said Dr. Jonathan Fowler, owner and principal of Northeast Archaeological Research and an associate professor of archaeology at nearby Saint Mary’s University. “The Acadians ultimately arrived in New Orleans, where they became known as ‘Cajuns’.”
The fort, however, was designed first and foremost for defensive purposes. Fowler explained that the advent of gunpowder gave rise to a rapid change in the architecture of military fortifications. Tall stone walls, easy targets for cannon fire, were replaced by low-profile battlements built of timber and dense earthworks. The ‘star fort’, with four, five, six or more defensive bastions providing 360 degrees of protection, was common in the 18th century.
 “Fort Edward was originally timber and earthworks, but most of the timber is gone now, and the earthworks are slumped due to erosion,” said Fowler. Disappointed by how few details of Fort Edward’s structure remain after centuries of erosion and overgrowth, yet intrigued by reports of outbuildings, a garrison cemetery and other facilities on the grounds, he wanted to know more. “As you walk around, you can’t really tell it’s a fort; it looks like a ditch with a bank,” he said. “Unless you’re familiar with military architecture, you wouldn’t understand it’s a star-shaped fortification.”
Fowler believed lidar technology could give his students and other archaeologists their first real opportunity to study the impressive layout of the 270-year-old British fort.
Lidar: a new tool for archaeology
Lidar is becoming a popular tool in archaeological studies due to its ability to penetrate vegetative cover and reveal what lies beneath. Even at historic sites where archaeological research has been approved, removal of bushes, trees and grasses is seldom allowed, or can be prohibitively expensive. Laser scanners, ground penetrating radar (GPR) and geophysical surveys can map the bare earth, and sometimes what is beneath the ground, without disturbing the natural environment.
 Parks Canada was interested in Fowler’s efforts to bring Fort Edward back to life virtually, but there was no budget to acquire new lidar data. Fortunately, Canadian federal, provincial and municipal governments have made archives of publicly-funded lidar surveys freely available. From Novia Scotia, Fowler obtained airborne lidar data that had been acquired with a Riegl laser scanner over Fort Edward for a nearby hydroelectric project in 2011.
Fowler also obtained a satellite image of the area to establish a baseline of what is visible from overhead at Fort Edward. The image showed a faint outline of the fort with four bastions but few other details. Next, he turned his attention to the lidar point cloud.
Lidar data sets can be intimidating for archaeologists, because the files themselves are enormous, Fowler explained, and the software often used to exploit them can be expensive and difficult to learn. Instead, he opted to employ the Surfer gridding and visualization package from Golden Software1, which he had been using for over 10 years to create 2D and 3D maps from GPR and handheld magnetic susceptibility surveys. “This package is the workhorse for mapping our geophysical surveys,” he said. “You can do so much with it relatively easily.” Surfer had recently been upgraded with lidar point cloud processing functionality, and he decided to try it at Fort Edward.
Visualizing Fort Edward
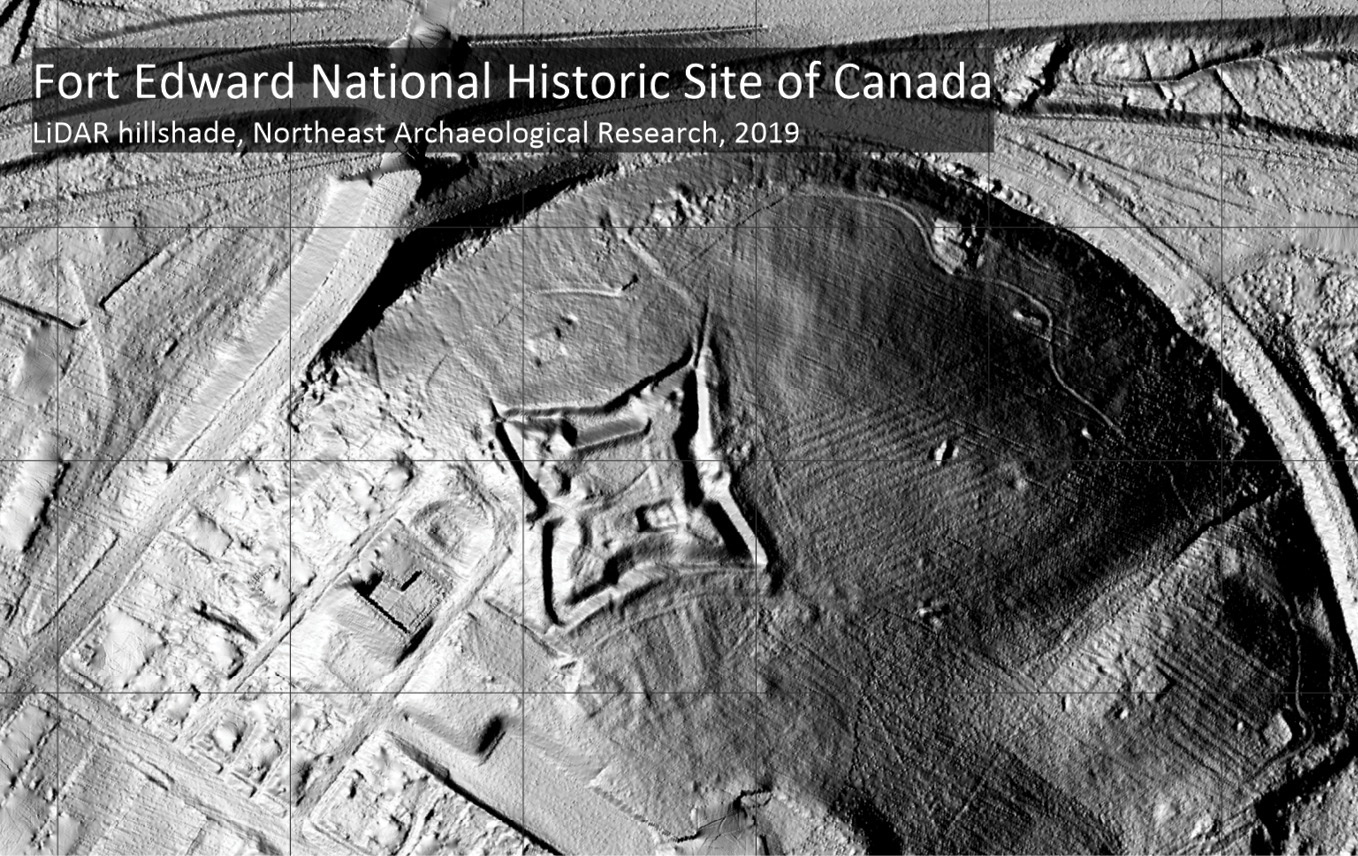
Fowler loaded the lidar file into Surfer. The first processing step was to filter out first-return elevation points, which represent the laser pulses that struck vegetation. This filtering created a bare-earth elevation model. He then used the software to densify the remaining points through interpolation so he could generate a granular contour map. He varied the contour intervals until the map expressed the terrain in fine detail. “With the [25-centimeter] contours, the star shape really pops out. You get an immediate sense of the relief,” he explained.
The contour map revealed the micro-topography in and around the fort that highlighted structural details typical of the time. For example, Fort Edward was built on top of a small hill surrounded by gently sloping terrain, which gave soldiers on the ramparts unimpeded views of potential attackers. The slope also meant invaders would have to run uphill crossing an open field, leaving themselves exposed to gunfire.
The bare-earth model and contours brought the star-shaped structure into better focus, but the erosion had worn down the dirt ramparts and begun to fill in the ditches. To further enhance their visibility, Fowler generated a hillshade relief map which allowed him to artificially create sun illumination to emphasize terrain. He also purposely exaggerated the Z values in the point cloud to emphasize vertical highs and lows.
Fort Edward suddenly jumped off the computer screen in 3D almost exactly as it appeared in the 1700s. The earthen ramparts and bastions were sharply defined. Outside the earthworks lay ditches that would have further slowed attackers on foot. “The exaggerated elevation values highlighted the micro-topography,” said Fowler.
What intrigued the archaeologist about the scene were features he hadn’t expected and hadn’t noticed on the ground. A depression inside the fort’s walls was a cellar for a barracks, still visible on the surface today. But outside and to the east of the ramparts are two rectangular features completely invisible at surface level. Fowler intends to return to the site and investigate whether these could be related to the garrison cemetery or outbuildings known to have existed just outside the battlements.
Another phenomenon that fascinated him was the striations in the earth just east and southeast of the structure. These showed up in the hillshade relief but not in the contour map. Fowler is certain these are micro-terrain remnants of agricultural tilling that took place on the site decades ago, yet long after the fort was abandoned. While not related to the history of the fort, these farming remnants contribute to the overall story.
“This is why micro-topography matters,” he said. “Things show up that you don’t expect.”
What’s next for lidar and archaeology?
Fowler is incorporating the use of lidar into his archaeology classes at Saint Mary’s University and it is a growing part of his consulting work. In addition, he shared the results with fellow archaeologists as well as Fort Edward researchers at Parks Canada. Mostly unfamiliar with the use of lidar in this type of project, they were impressed with the details revealed in the Surfer visualizations and want to apply lidar technology at other sites.
Fowler hopes lidar will emerge as a primary tool in historic preservation at important locations like Fort Edward across Canada and around the world. The technology provides an unbiased baseline of sites and their condition, against which to judge future observations.
“When you can map features and objects and visualize them at such fine levels of detail, it allows you to inventory cultural and archaeological resources on site,” he said. “Once it’s mapped with lidar, future point clouds show how a site is evolving over time, so heritage managers can better monitor resources they are charged with preserving.”
Kevin Corbley is a business consultant in the geospatial industry. He may be reached at www.corbleycommunications.com.