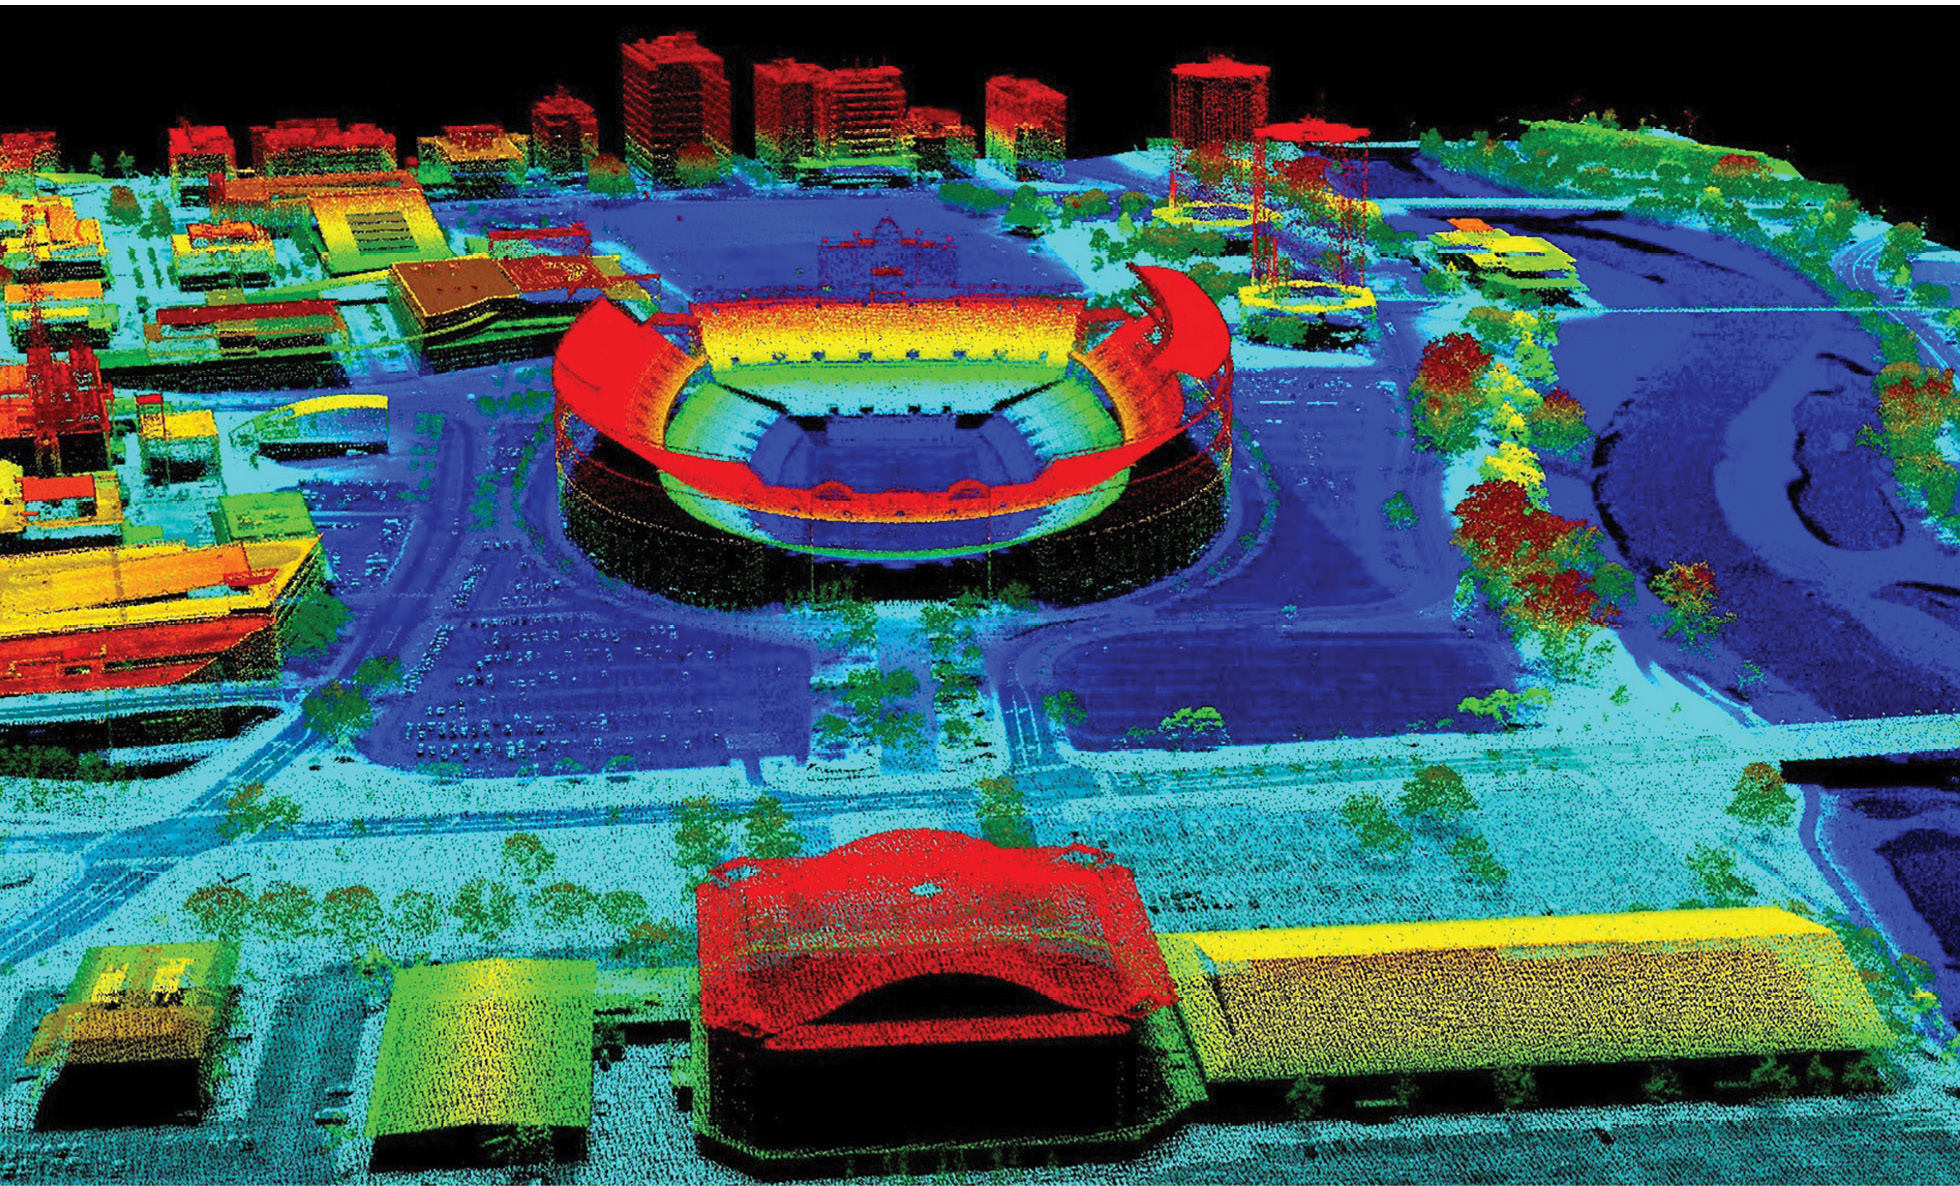
This screenshot represents a Quality Level 0 (QL0) lidar point cloud, colorized by elevation, covering a portion of the Ohio State University’s Main Campus in Columbus, Ohio. The lidar data collected for Blueprint Columbus is providing consistent, seamless data to formulate a digital, unified plan to address engineering needs. Courtesy of Woolpert.
Columbus is the capital city of the state of Ohio, which contracted for its first statewide lidar collection in 2006. Similarly, Columbus is forging new geospatial ground by procuring one of the largest collections of Quality Level 0 (QL0) lidar data. QL0 data is collected at 8 points per square meter or greater, in accordance with U.S. Geological Survey (USGS) specifications.
Blueprint Columbus, an innovative initiative of the Columbus Department of Public Utilities (DPU), applies advanced technologies to direct rainwater out of the sanitary sewer system and into the storm sewer system. The program uses an engineered solution to mimic nature by creating green infrastructure, such as bioswales or rain gardens, to meet stormwater regulations for filtering pollutants, while addressing sanitary sewer overflows into neighborhoods.
The city contracted with Woolpert in 2018 to collect QL0 lidar data over a geographical area of 680 square miles in central Ohio, including downtown Columbus. DPU Geographic Information System Manager Mike Edwards said that the QL0 data, which was collected in early 2019 at 12 points per square meter and with a vertical accuracy averaging two inches, was sought to meet the specific needs of the program.
“The city had collected lidar data at Quality Level 2 point density in 2015, which proved useful for multiple projects,” Edwards said. “But a handful of city consultants wanted more vertically accurate lidar data to support the creation of highly detailed hydraulic models.”
The data is being used to support preliminary engineering for Blueprint Columbus, providing DPU with consistent, seamless data to formulate a digital, unified plan, without sending surveyors into the field.
“A lot of engineering work is performed before construction starts,” Edwards said. “The more accurate the lidar data at the outset, the more accurate we can be at sizing our rain gardens, bioswales and regional rainwater detention facilities. And so far, we definitely like what we’ve seen.”
Geospatial history helps outline Blueprint
Ohio has a long history of developing geospatial data and GIS technology to support government services and applications through its Ohio Geographically Referenced Information Program (OGRIP). Since its inception in Columbus 30 years ago, OGRIP has coordinated statewide geospatial initiatives that benefited all levels of government, provided leadership, and promoted the value and application of GIS technology for all programs and departments throughout the state.
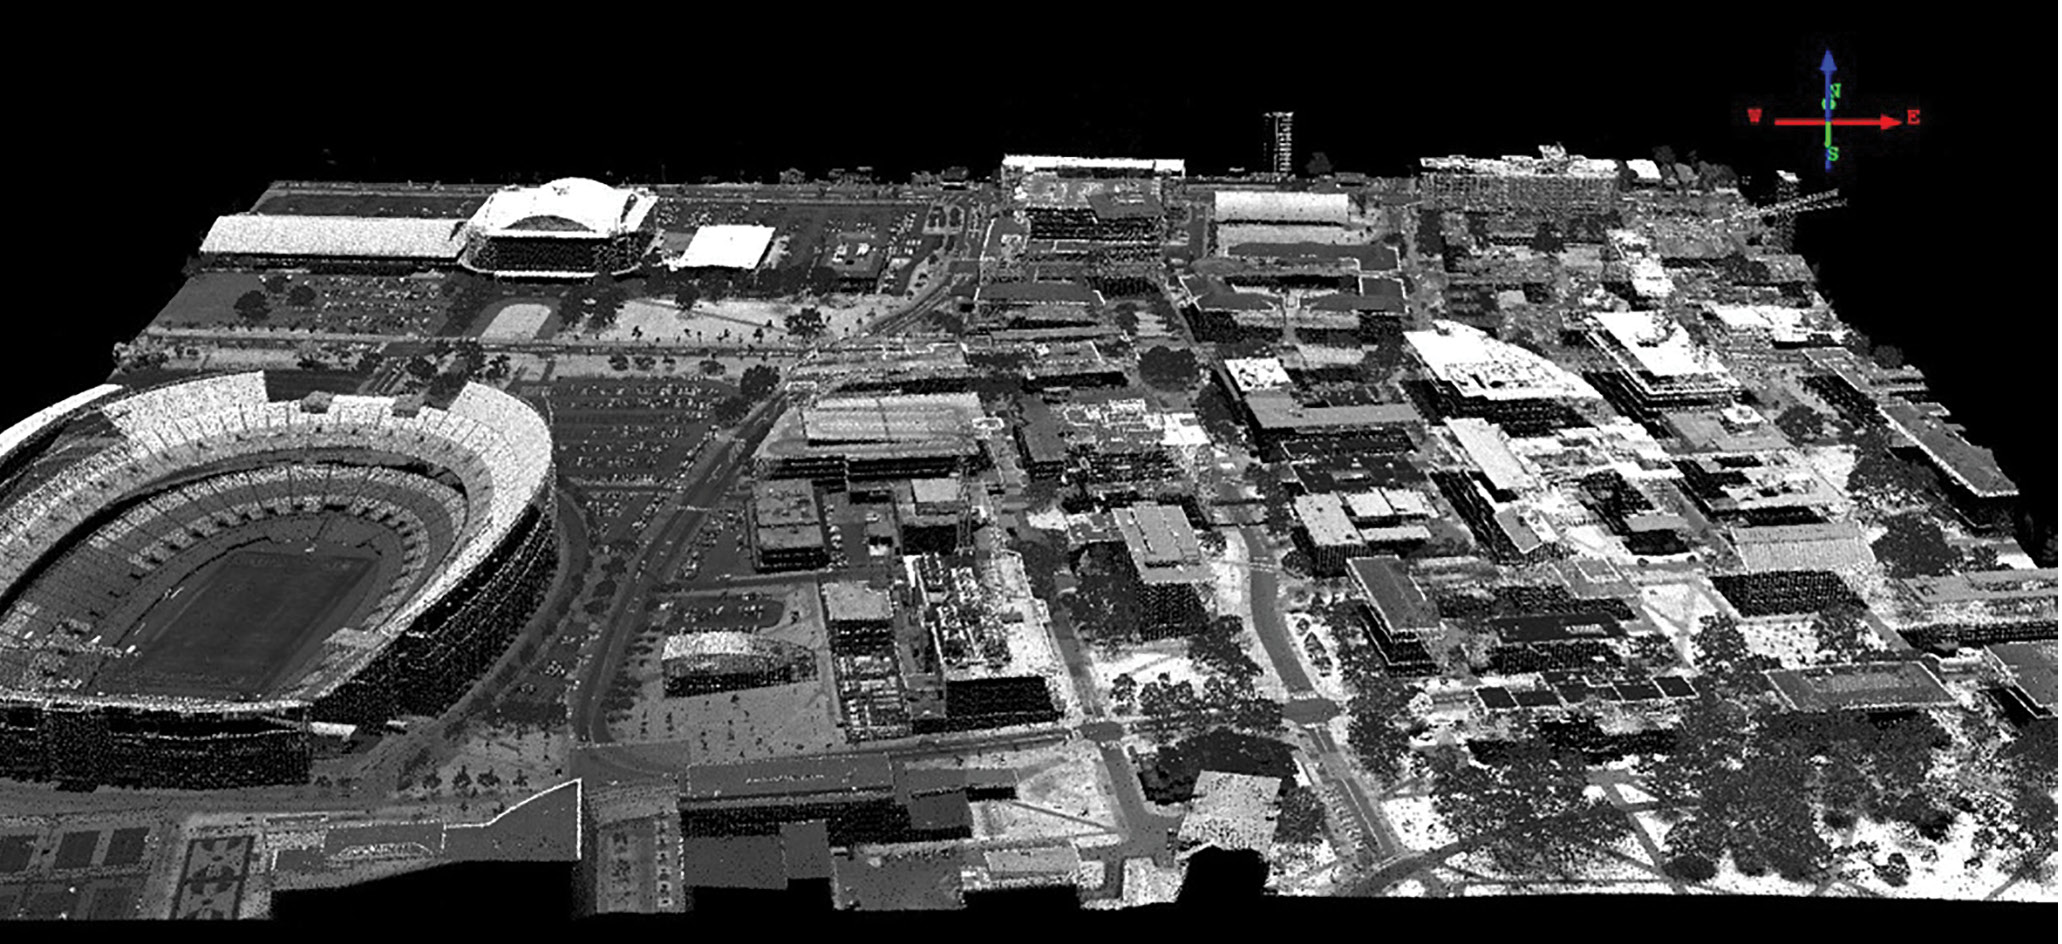
This screenshot represents a QL0 lidar point cloud covering a portion of the Ohio State University’s Main Campus in Columbus, Ohio. Courtesy of Woolpert.
As a result, Columbus officials are familiar with the value and application of geospatial data. OGRIP programs such as the Ohio Statewide Imagery Program (OSIP), which was introduced in 2006, is in its third iteration. For more than a decade, the state has provided OSIP as a contract vehicle that allows municipalities to purchase color digital orthoimagery, lidar data and various other geospatial products and services for sharing throughout the state.
These datasets have been utilized by many state agencies and local governments to support economic development, property appraisal and management, emergency preparedness and response, utility management, crop delineation, asset management, planning and designing transportation infrastructure, environmental issues, permitting and code enforcement, improving spatial applications and services, etc.
Blueprint Columbus, which represents a substantial investment by the city, also benefits from these applications. According to DPU’s “The Integrated Plan and 2015 Wet Weather Management Plan Update Report,” the total capital cost of the Blueprint Columbus plan will be $1.7 billion. Over 20 years, it was projected that Blueprint will create an additional $2.8 billion in regional output, $977 million in earnings and create more than 700 jobs.
The program has four key pillars: lateral lining, roof water redirection, a sump pump program and green infrastructure. These pillars are being implemented in all Blueprint neighborhoods to keep rainwater out of the sanitary sewer system and protect the quality of water in the city’s rivers and streams.
“The QL0 data allows us to create hydraulic model conduits using DEMs (digital elevation models) to appropriately represent curb gutters and tie those conduits into previous surveys, supporting flood mapping, open channel modeling, stormwater management, etc.,” Edwards said. “Before a site can be built, we need to have all these calculations to size the stormwater runoff to determine how large the rainwater detention facility should be.”
Edwards added that the department’s Division of Sewerage and Drainage in particular wanted the data to be as accurate and extensive as possible.
“I suggested Woolpert could fly priority areas downtown that would cover 100 or so square miles,” Edwards said. “But they had good reasons to fly the whole 680 square miles, because they had other ideas for using the data that could potentially reduce future topographical survey costs. When engineers start looking at this data, they see what they can do with it.”
Woolpert used Leica TerrainMapper aerial lidar sensors to collect this data in March and April 2019. Flying back and forth in a pattern similar to mowing a lawn, the team collected the data required, checked the data for quality and completeness, and processed the data and delivered it to Columbus, enabling city planners and engineers to have shared access.
Through Blueprint Columbus, vacant lots are being converted into park-like locations to treat stormwater; this is being accomplished by planting trees and creating bioswales that slowly release any collected water into storm drains. In addition to the significant environmental benefit of providing improved water quality, the project also has increased property values in neighborhoods that have struggled with stormwater runoff problems. Specific project locations, searchable by address, and information such as green infrastructure locations, projected dates of construction, etc., are available on the city’s website at columbus.gov/utilities/projects/blueprint/.
“There were immediate savings in cost and time by not sending surveyors out initially and later to recheck the site,” Edwards said. “With this data, we don’t need to duplicate efforts and collections not only within the city, but with other communities. In the past, we have shared the lidar data with other communities—Columbus extends across six counties—it’s safe to say there would be interest in others getting this data, which will have applications for years to come.”
Application branches out
The QL0 lidar data was procured to benefit Blueprint Columbus but, because the data is so accurate, Edwards said that many Columbus departments will likely come up with other possibilities for utilizing it in their projects. “Once people get hold of the data, they say, ‘How did I ever function without it?’”
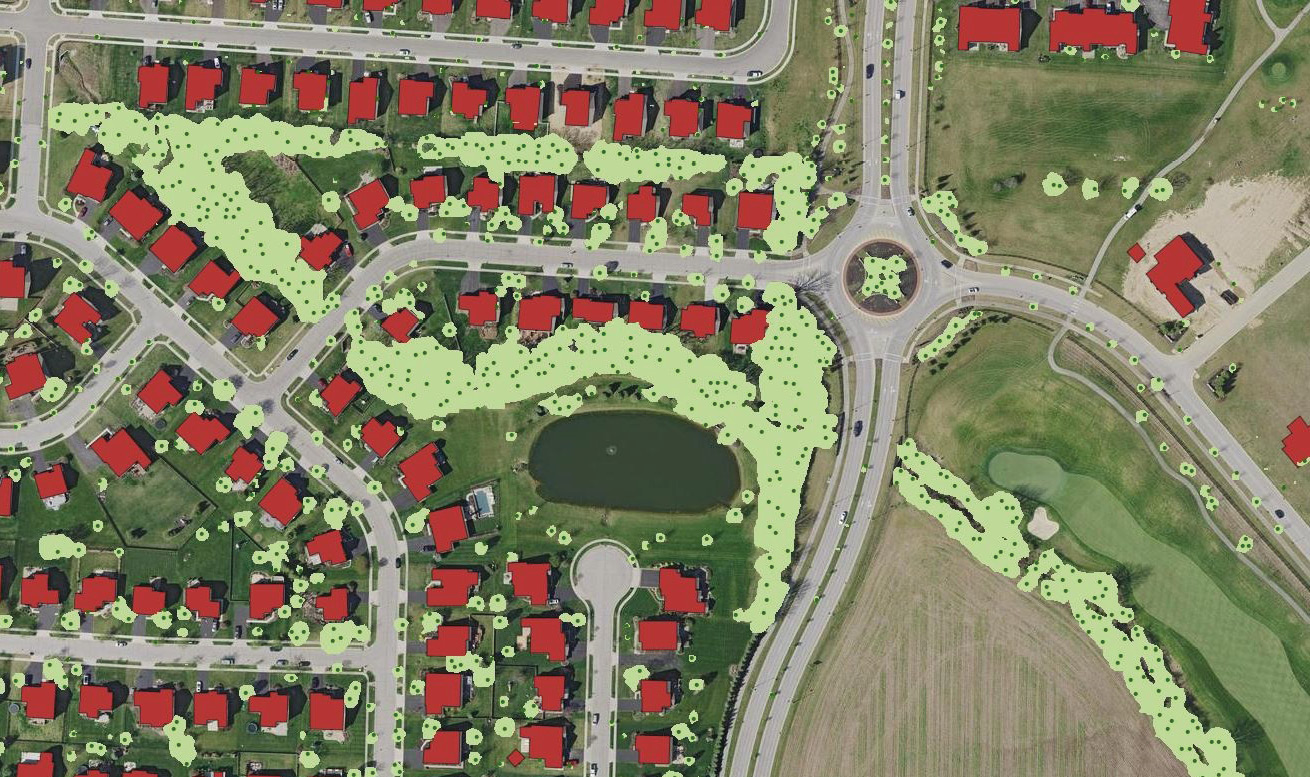
Building outlines, tree canopies and tree crowns, extracted from QL0 lidar, are represented in this screenshot. The Columbus (Ohio) Recreation and Parks Department, Urban Forestry Division, uses QL0 lidar data to produce canopy height and density models that estimate various measurements, such as a tree’s crown and stem diameter or a forest’s tree density and wood volume. Courtesy of Woolpert.
Some are already there. The city is in the middle of a large-scale project to install remotely-read water meters that use radio frequency identification (RFID) that will require installing repeater towers on the tops of buildings. Edwards said they will use point cloud data to determine the required height of buildings for installing the towers.
The city’s Recreation and Parks Department also has found a use for the data, according to GIS Analyst John E. Bowers, who works in the department’s Urban Forestry Division. The division is responsible for having a detailed inventory of the city’s public trees.
Bowers said that the division uses this data to produce canopy height and density models that estimate various measurements, such as a tree’s crown and stem diameter or a forest’s tree density and wood volume.
“Lidar allows these measurements and estimates for known public trees and identifies previously unknown public trees,” he said. “Highly accurate data is better for these purposes, because it generates more precise measurements and estimates. When identifying individual trees from a lidar point cloud, having more returns decreases the chance that trees will be missed by the segmentation algorithm.”
He continued that the division saves money using lidar because it generates an enormous amount of urban forest and tree data and eliminates the need to conduct inspections with a ground crew.
“Historically, our tree data was collected with a tape measure by an arborist or tree-trimmer on-site,” Bowers said. “Inspection and maintenance intervals could be multiple years. Lidar measures the entire urban forest all at once every few years, so we have much more data that is recent and available for analysis.”
Bowers said there are likely many other uses for lidar that have yet to be realized for the Parks and Recreation Department alone.
“Beyond Urban Forestry, the full scope of facilities and services for Parks and Recreation departments is vast,” he said. “In addition to uses such as these that measure existing assets, lidar products could be used for multiple applications, including to guide where and how recreation areas could be developed.”
Smart technologies, increasing applications
Utilizing lidar data in identifying existing assets and planning for engineering applications is just the beginning. This data is key to smart city initiatives that rely on the connection and communication of city functions—such as transportation, utilities and development—while reducing waste and costs.

The Columbus (Ohio) Department of Public Utilities’ Blueprint Columbus initiative applies advanced technologies to direct rainwater out of the sanitary sewer system and into the storm sewer system. See columbus.maps.arcgis.com. Residents can search project locations by address and find information such as green infrastructure locations, projected dates of construction, etc., on the city’s website at columbus.gov/utilities/projects/blueprint/.
Columbus, which won the U.S. Department of Transportation’s Smart City Challenge in 2016, will be able to use this data to reinvent mobility and improve the quality of life for residents, drive growth, provide better access to jobs and opportunity, and foster sustainability.
Fang Cheng, engineer and project manager with the Division of Sewage and Drainage, said Columbus DPU engineers are currently considering other ways to use the data. She said these projects include comparing lidar-generated contours in ArcGIS with contours generated by traditional topographical surveys to reduce the traditional effort and costs on capital improvement plan projects. Other potential uses include 2D stormwater modeling for flood mapping, stormwater improvement studies and mapping areas prone to surface flooding and ponding or large-scale water quality, and open channel modeling to estimate pollution and explore river restoration.
Edwards appreciates how proactive Columbus is with geospatial technology, collecting lidar data every four to six years to monitor trends and changes in topography, infrastructure and the environment. He noted how these all affect impervious surface and therefore stormwater drainage and flooding, as well as transportation issues.
“The OSIP program has been great for the city of Columbus and has allowed us to work smarter with this technology,” he said. “I think the addition of this QL0 data through Blueprint Columbus is going to be one of those building block datasets that is used on a number of projects throughout the city and region.”
Brian Stevens is a vice president and geospatial program director with Woolpert, an international architectural, engineering and geospatial firm based in Dayton, Ohio. Stevens is a GIS professional and photogrammetrist with 20 years of experience in the geospatial industry. Working out of the firm’s Columbus office, Stevens has led the Ohio Statewide Imagery Program (OSIP) since its inception in 2006. He can be reached at brian.stevens@woolpert.com.