
For people living in urban areas, this decline in air quality can lead to an increased risk of heart disease, lung cancer, stroke and respiratory diseases such as asthma.
80% of the urban population lives in places with air quality levels that exceed the World Health Organization (WHO) limits
So, how green is your city?
Urban canopy maps are visual representations of the location and extent of the tree cover in a city.
One of the methods to produce them is top-down remote sensing approach which implies analyzing satellite or aerial images and extracting the trees as an information layer.
Applying this concept, National Geographic created maps taking a look at tree coverage in nine of the largest cities in the U.S. in a feature entitled, “Nine Cities That Love Their Trees”.
You can do the same and create your own canopy map and check how green your neighborhood -or your city- is. It may sound complicated, but it’s actually not. All you need is an aerial image and the right image analysis tool.
Let’s create an urban canopy map
https://youtu.be/ZPOWzwjX_ek
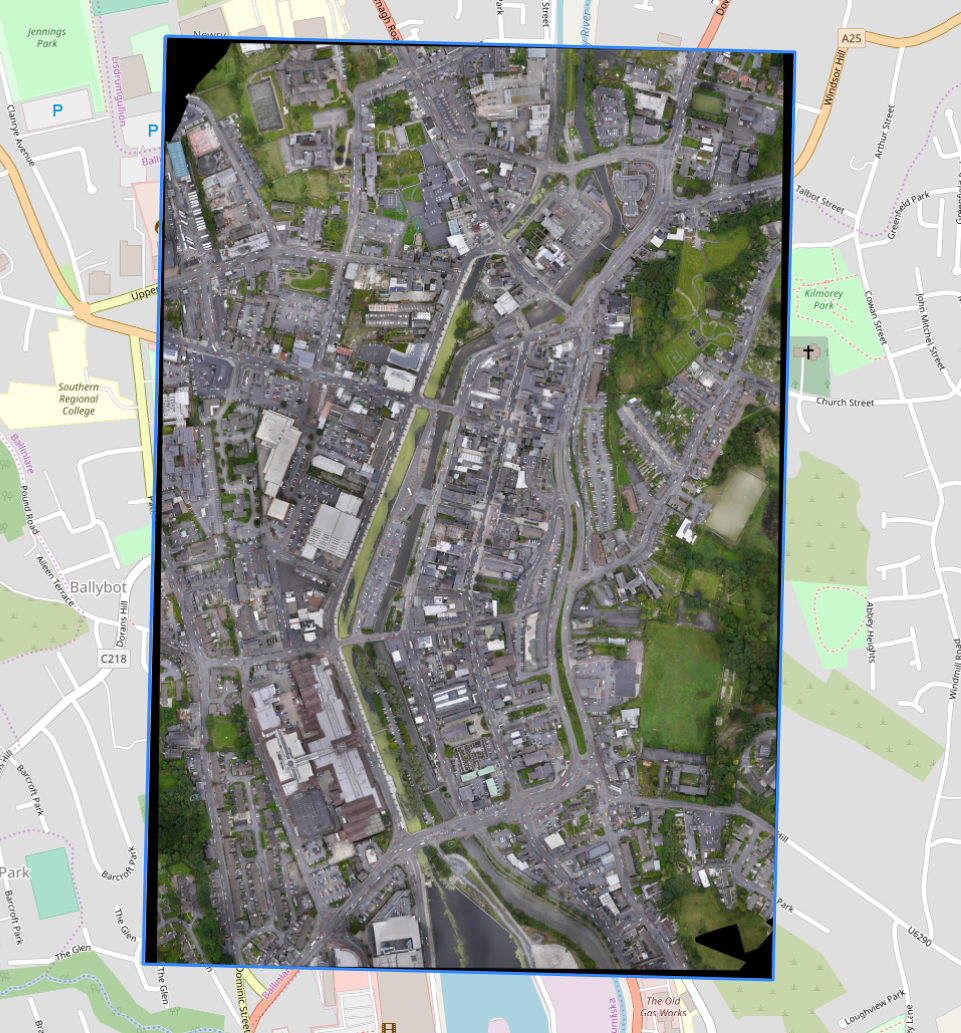
In this project, we analyzed an aerial image of an area located in Newry, Northern Ireland -the orthomosaic was produced by OpenAerialMaps contributors-. You can get started by uploading your own orthomosaic to Picterra.
Build a “Tree Detector”
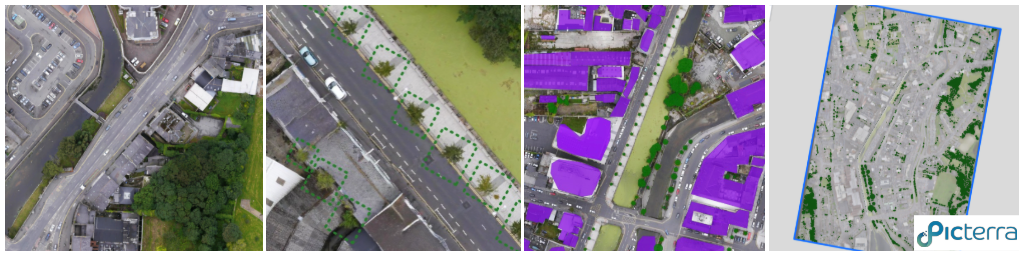
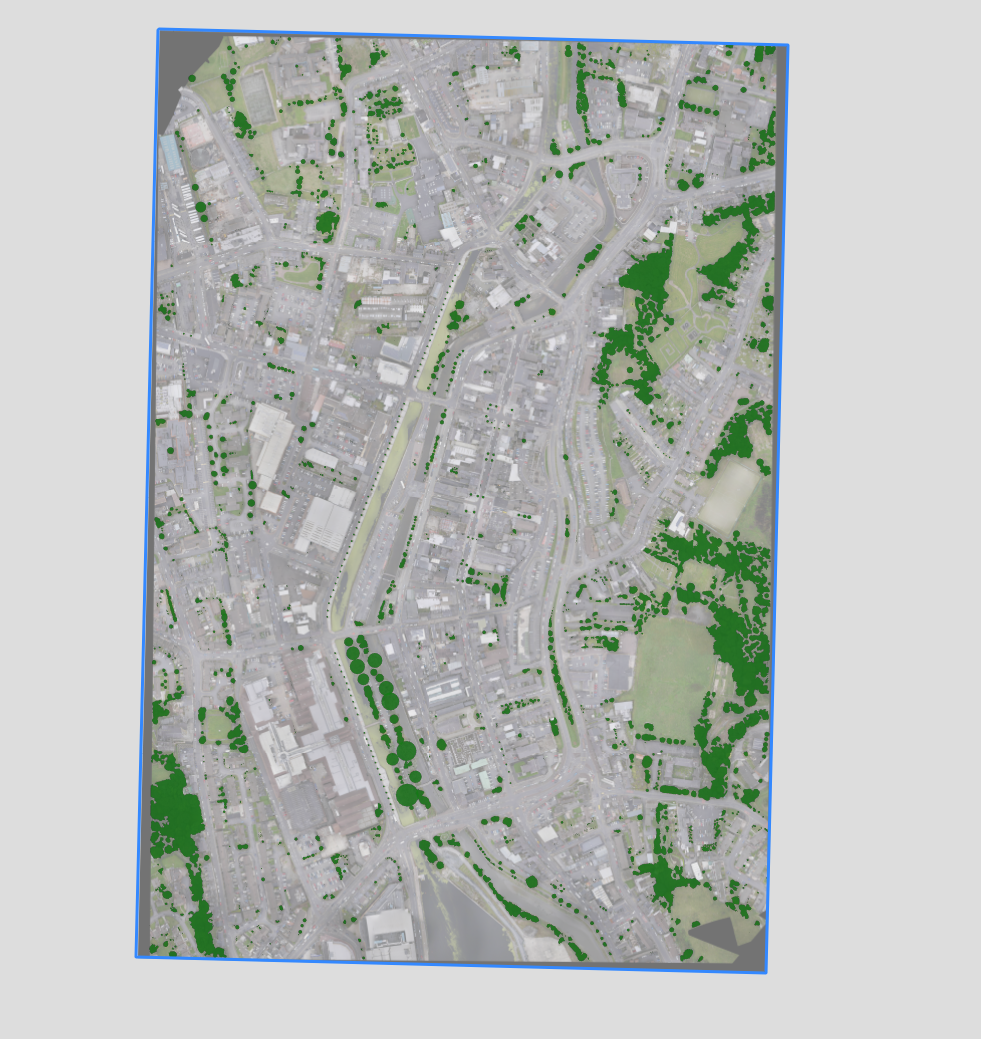
Having the orthomosaic uploaded on Picterra, we created a “Tree detector”. All you need to do to build your detectors is to show examples of the type of object that belong to your target group. The platform will guide you through this process.
For more details on the custom detector creation process, please read A crash intro into Ai powered object detection

Comparing built-up and tree cover extent
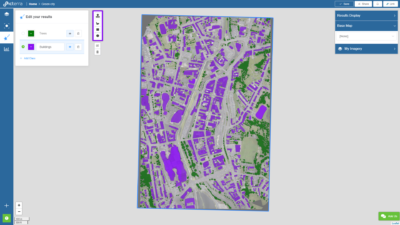
To go one step further and compare the extent of canopy cover with the area covered by buildings we created “Buildings Detector” following the same steps.
Visually, this is what we got, the trees and the buildings here displayed in 2 separate layers.
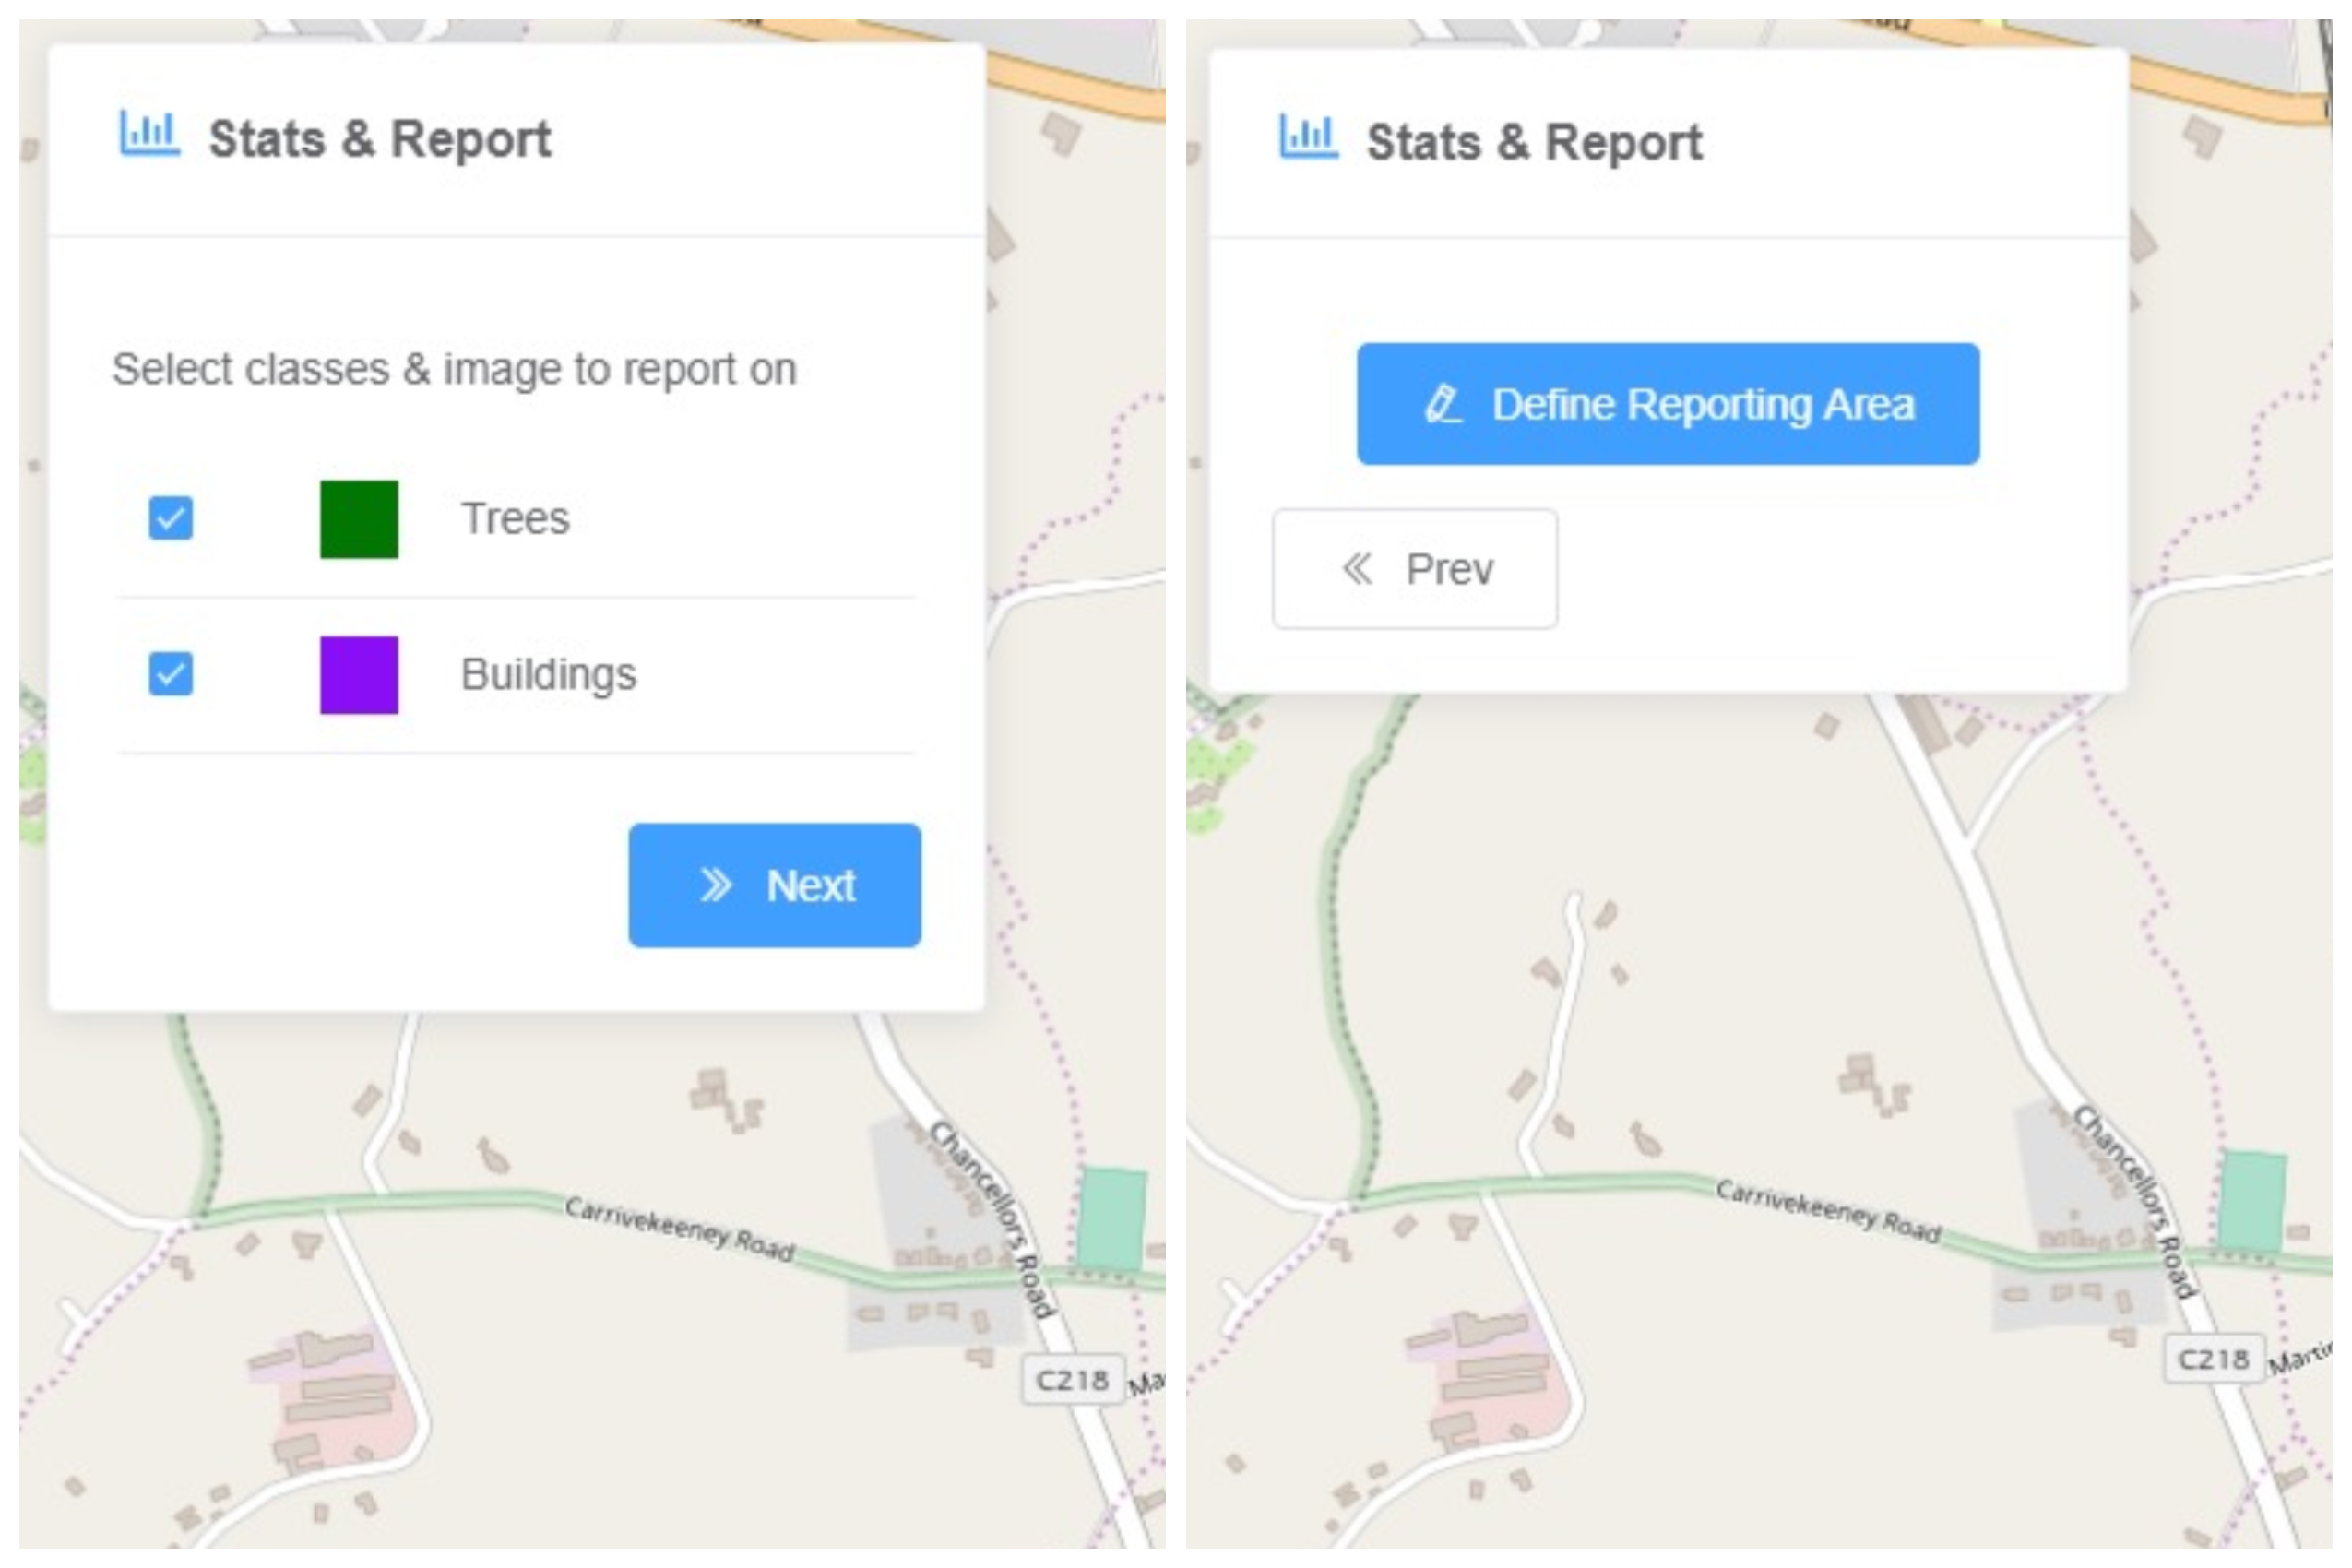
The next step is deriving quantitative information from the object detection. To do so, we selected layers and defined the area we wanted to report on.
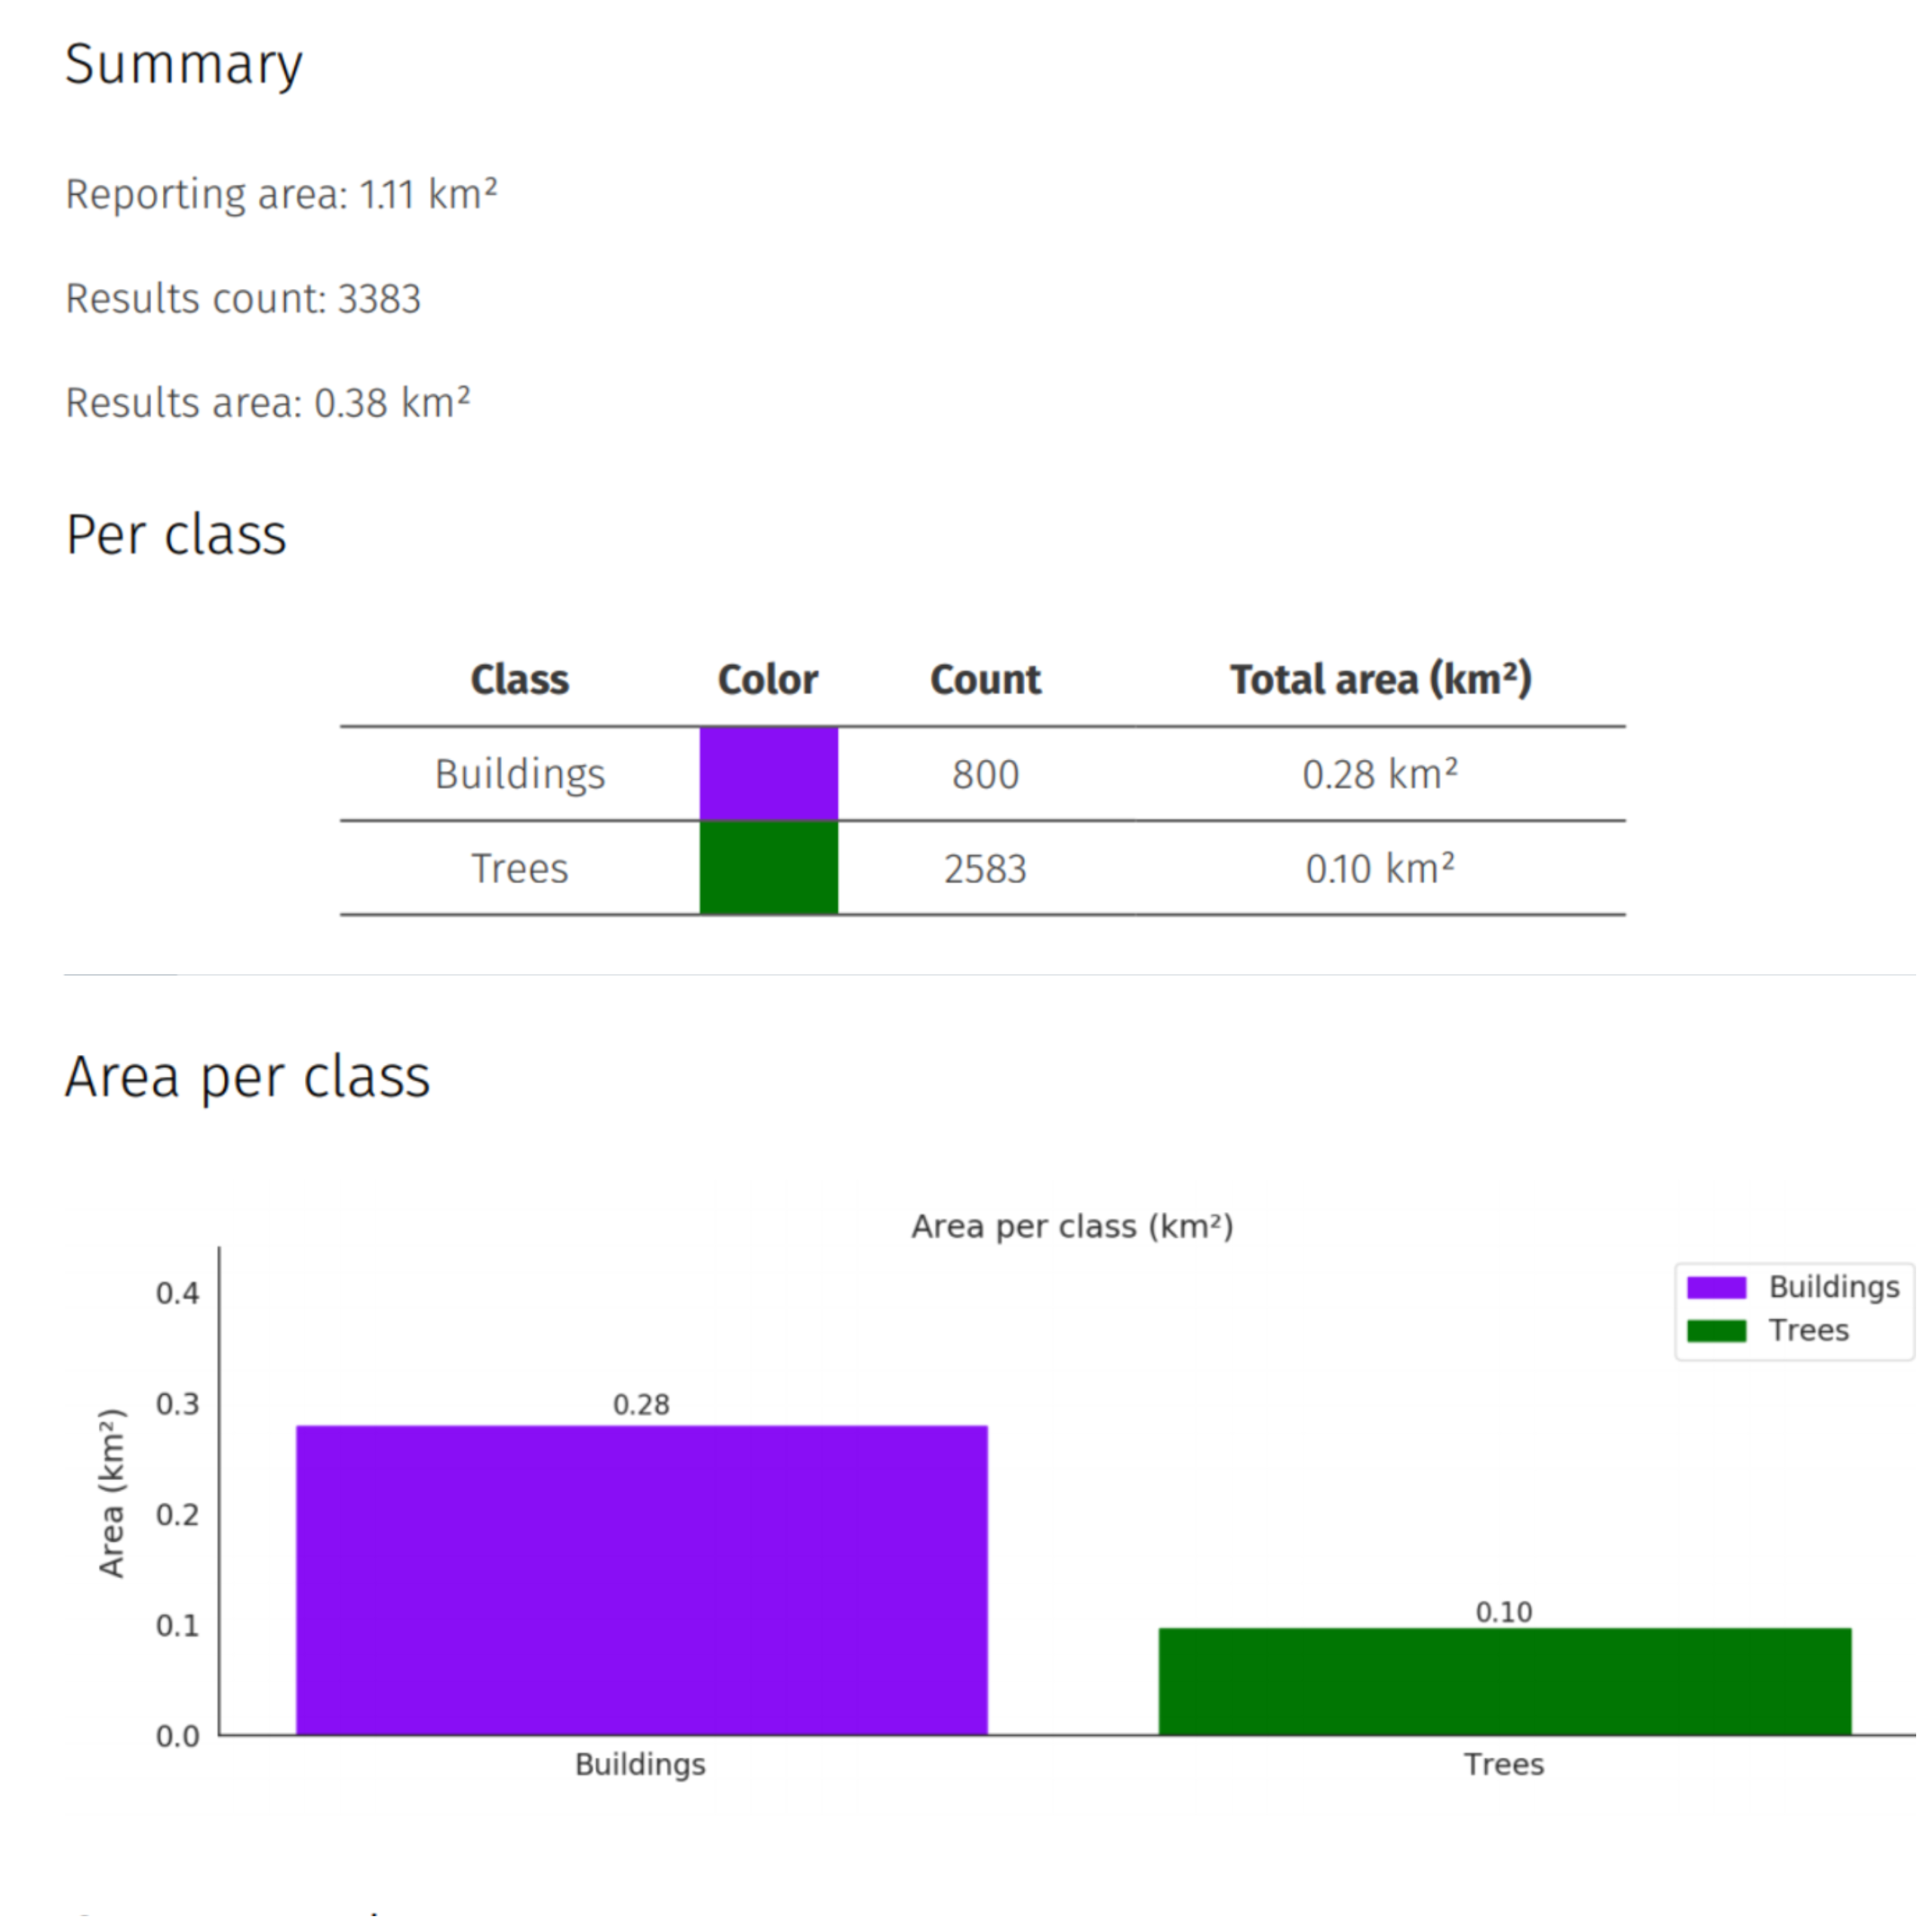
- The tree canopy is around 8.9% (0.10km2) of the whole area (1.11km2)
- The buildings cover around 25% (0.28km2) of the whole area (1.11km2)
- The building area is approximately three times higher than the tree canopy in this area of Newry.
Based on such an analysis a city might want to consider incorporating additional green infrastructure to favor a more sustainable and healthier environment. It can also track over time the impact of policies and actions made for the protection of the environment.
Raising public awareness on an issue involves creating the right messaging. Maps and stats can be used to present hard data on an issue in a compelling, visual and user-friendly manner.
Create and share your own urban canopy map and play a role in improving air quality, mitigating and adapting to climate change.
Create your own maps!