
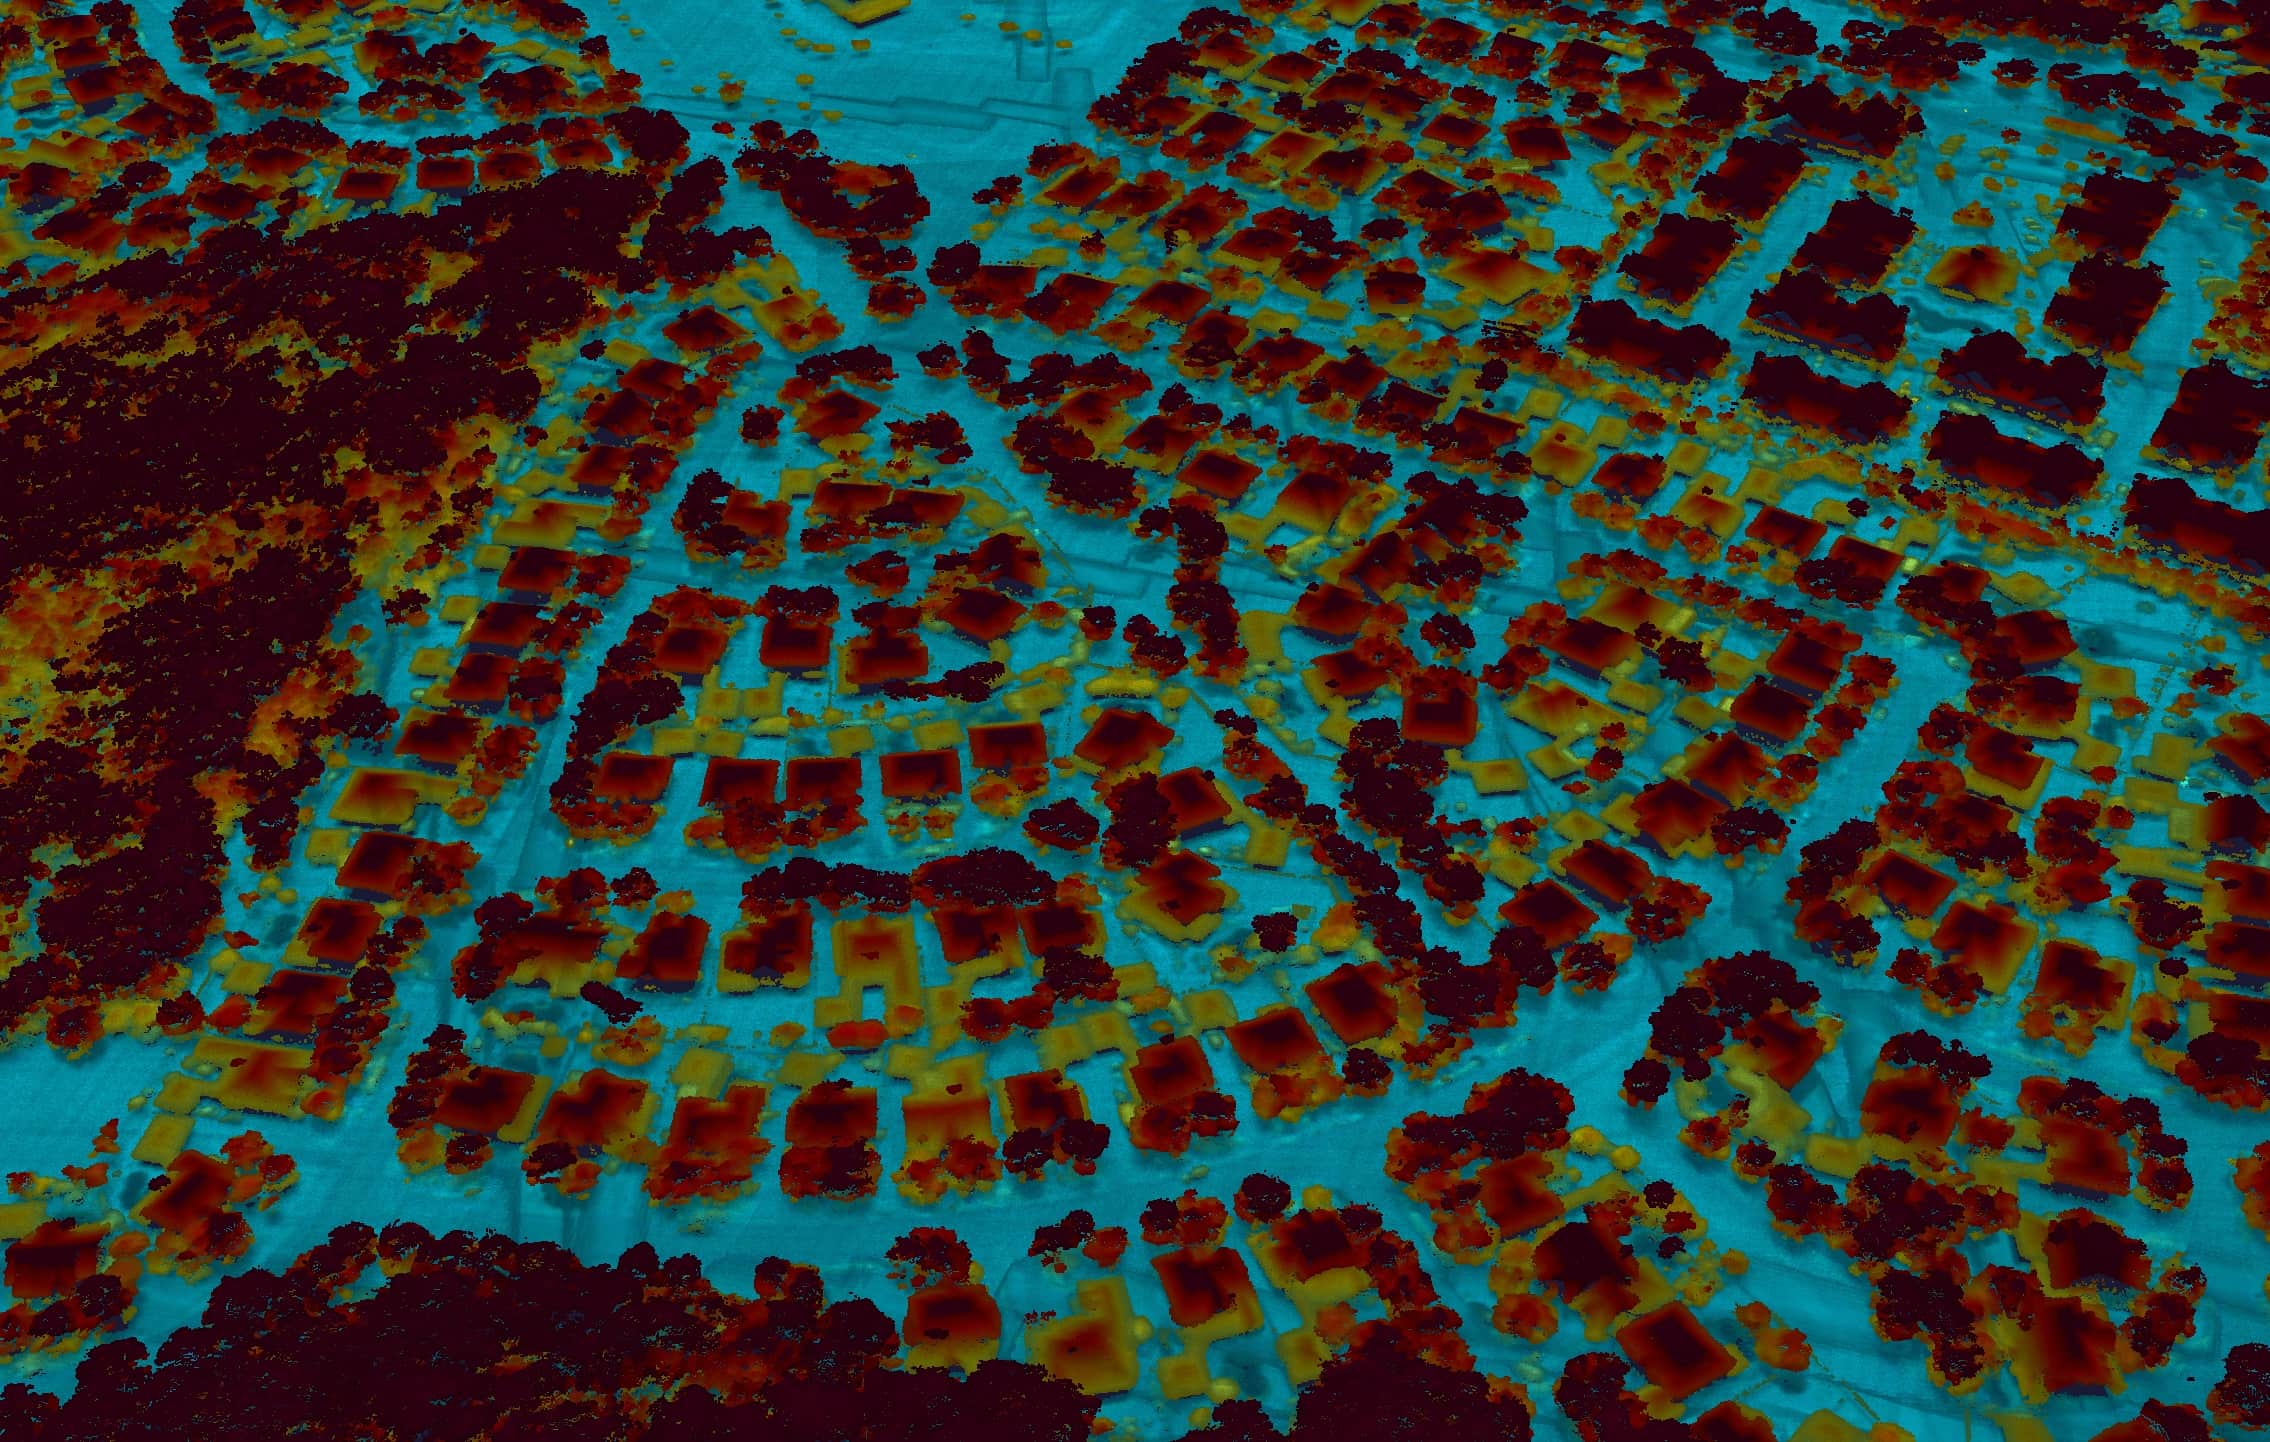
1/3 – This lidar image was captured over the Windmill Bluff Lane neighborhood outside of Houston, Texas, shortly after Hurricane Houston hit the region.
MIT Lincoln Laboratory is collecting robust post-disaster lidar datasets and applying advanced algorithms to these data to help FEMA assess damage. The technology could soon be the basis for efficient, data-driven emergency management.
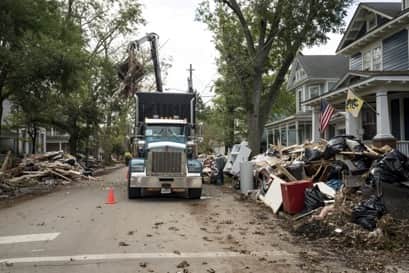
Windmill Bluff Lane looked very much like hundreds of other streets in the suburbs of Houston, Texas, days after Hurricane Harvey hit in 2017. Heaps of sodden furniture, wallboard, and possessions pulled out from each flooded home sat curbside.
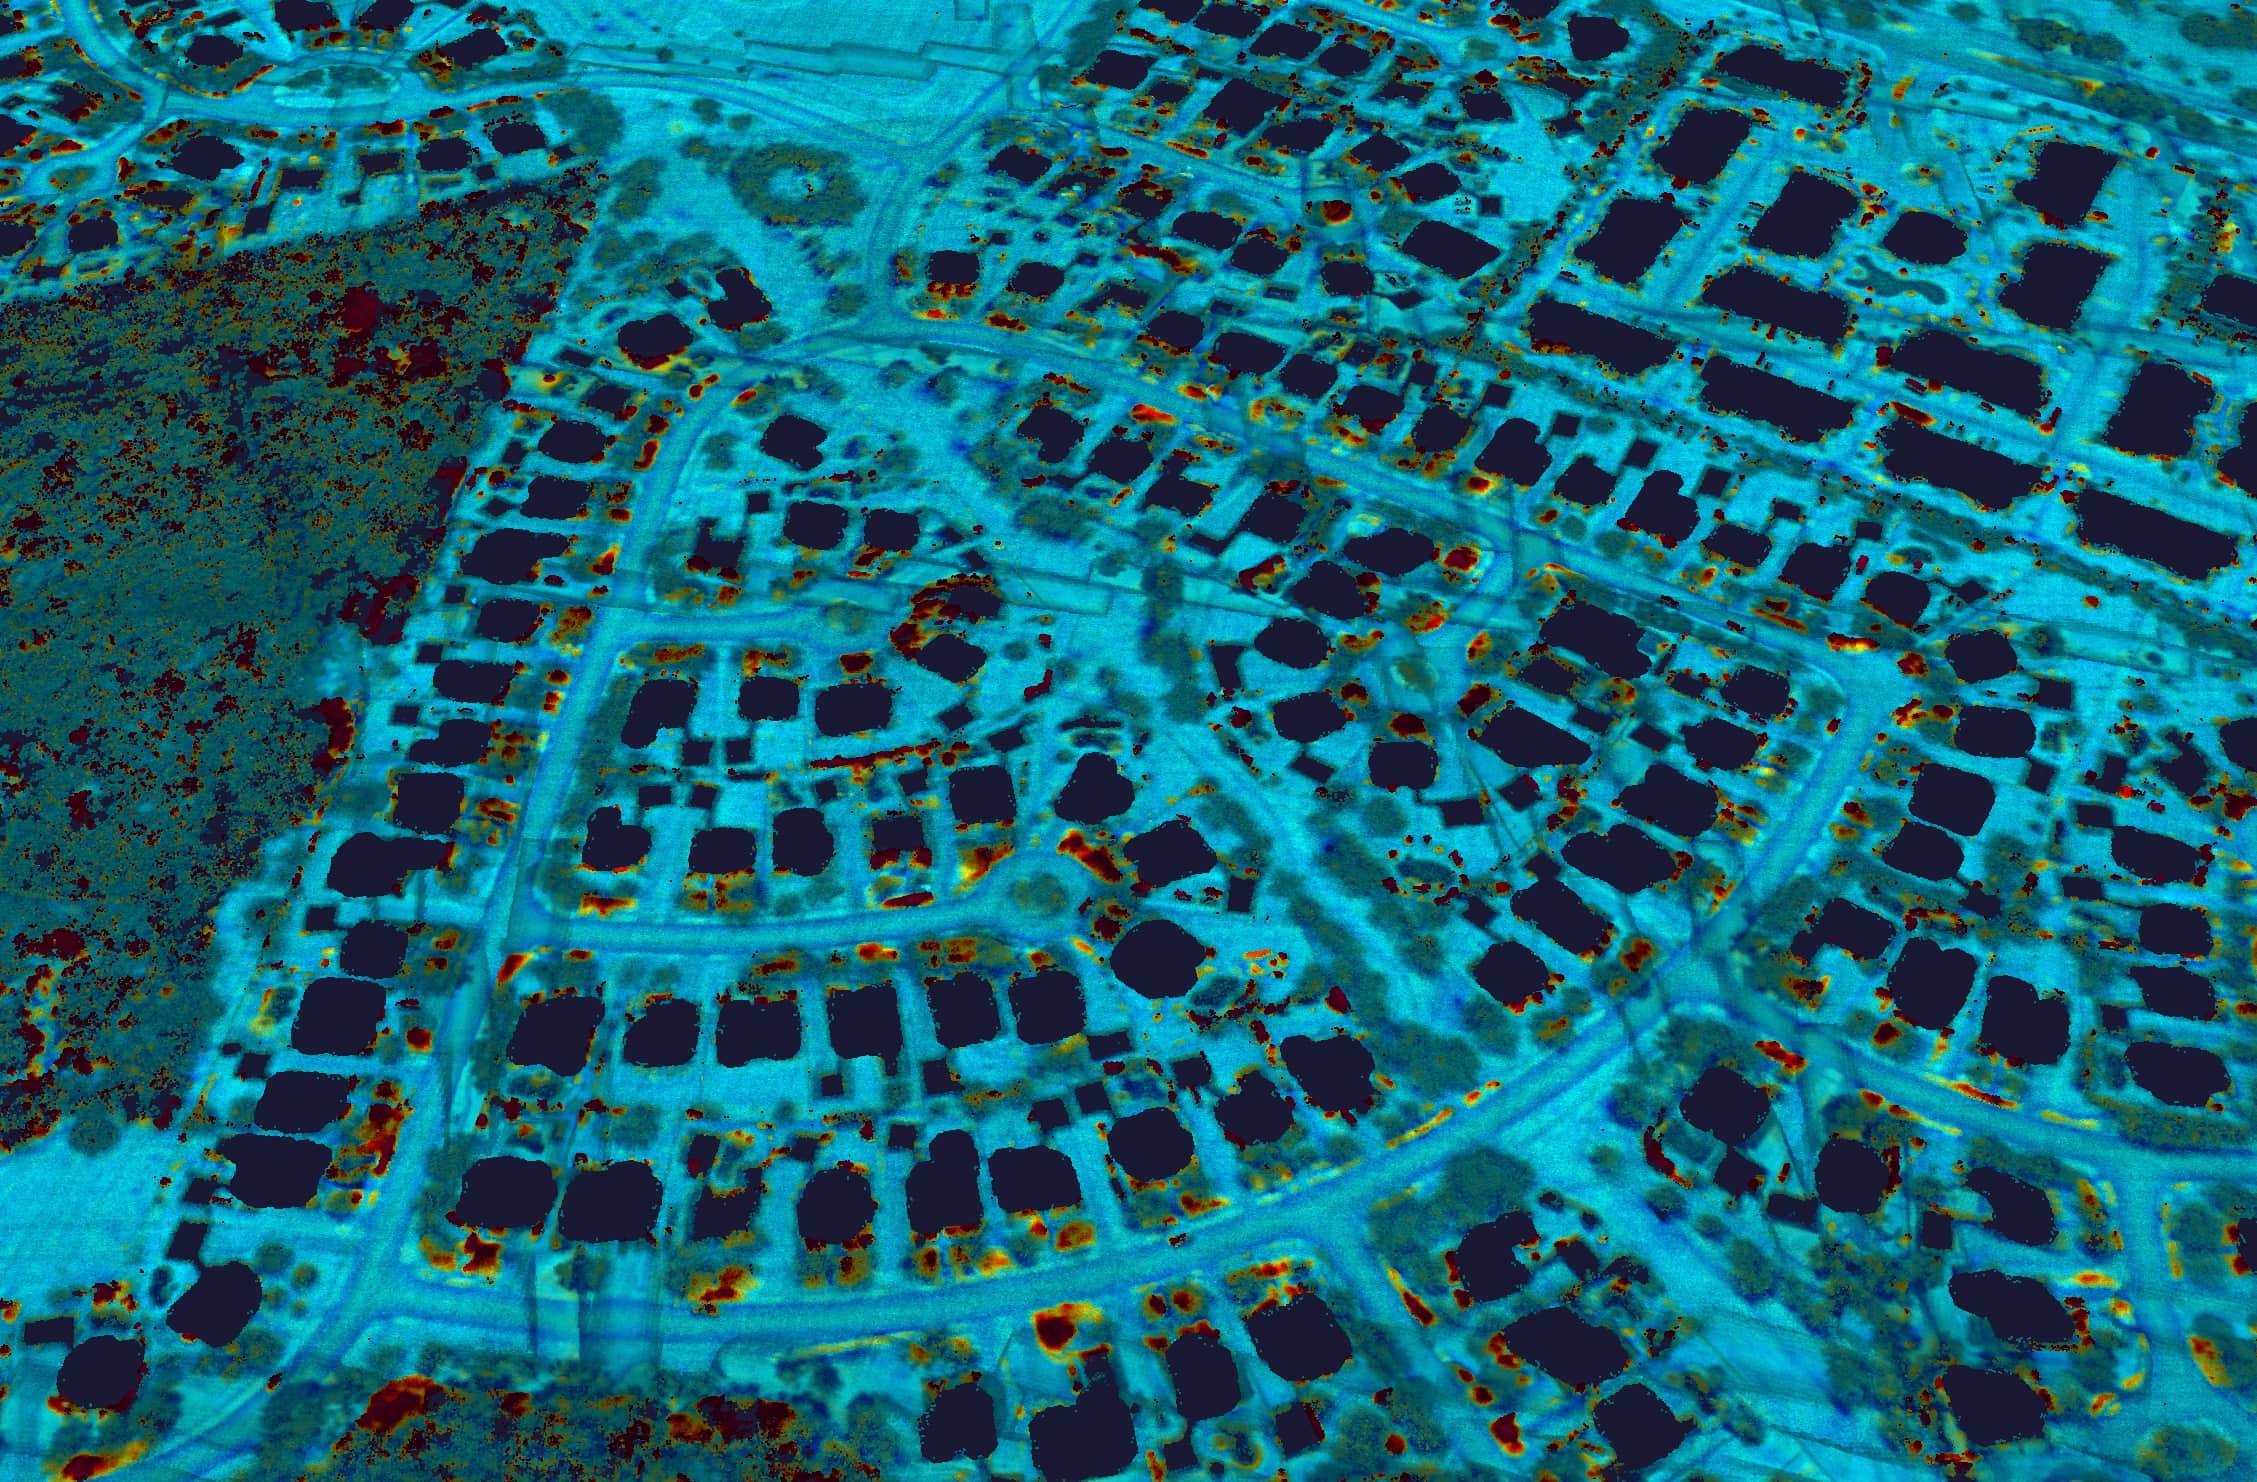
2/3 – The image was defoliated and features such as houses were filtered out of the image.
There, the debris was being inspected by the U.S. Army Corps of Engineers (USACE), who manually estimate the volume of each pile and share these estimates with FEMA to inform emergency response decisions. In the midst of assessing damage to public infrastructure, housing, roads, power, and more, the task is time consuming and often results in inaccurate estimates.
Windmill Bluff Lane was different, however, because USACE was not inspecting the curbside debris alone. MIT Lincoln Laboratory was collecting 3D Geiger-mode lidar data over the area and using advanced algorithms to estimate the total volume of debris there. It was the laboratory’s first demonstration of how lidar paired with new algorithms could be used to quantify debris after a hurricane.
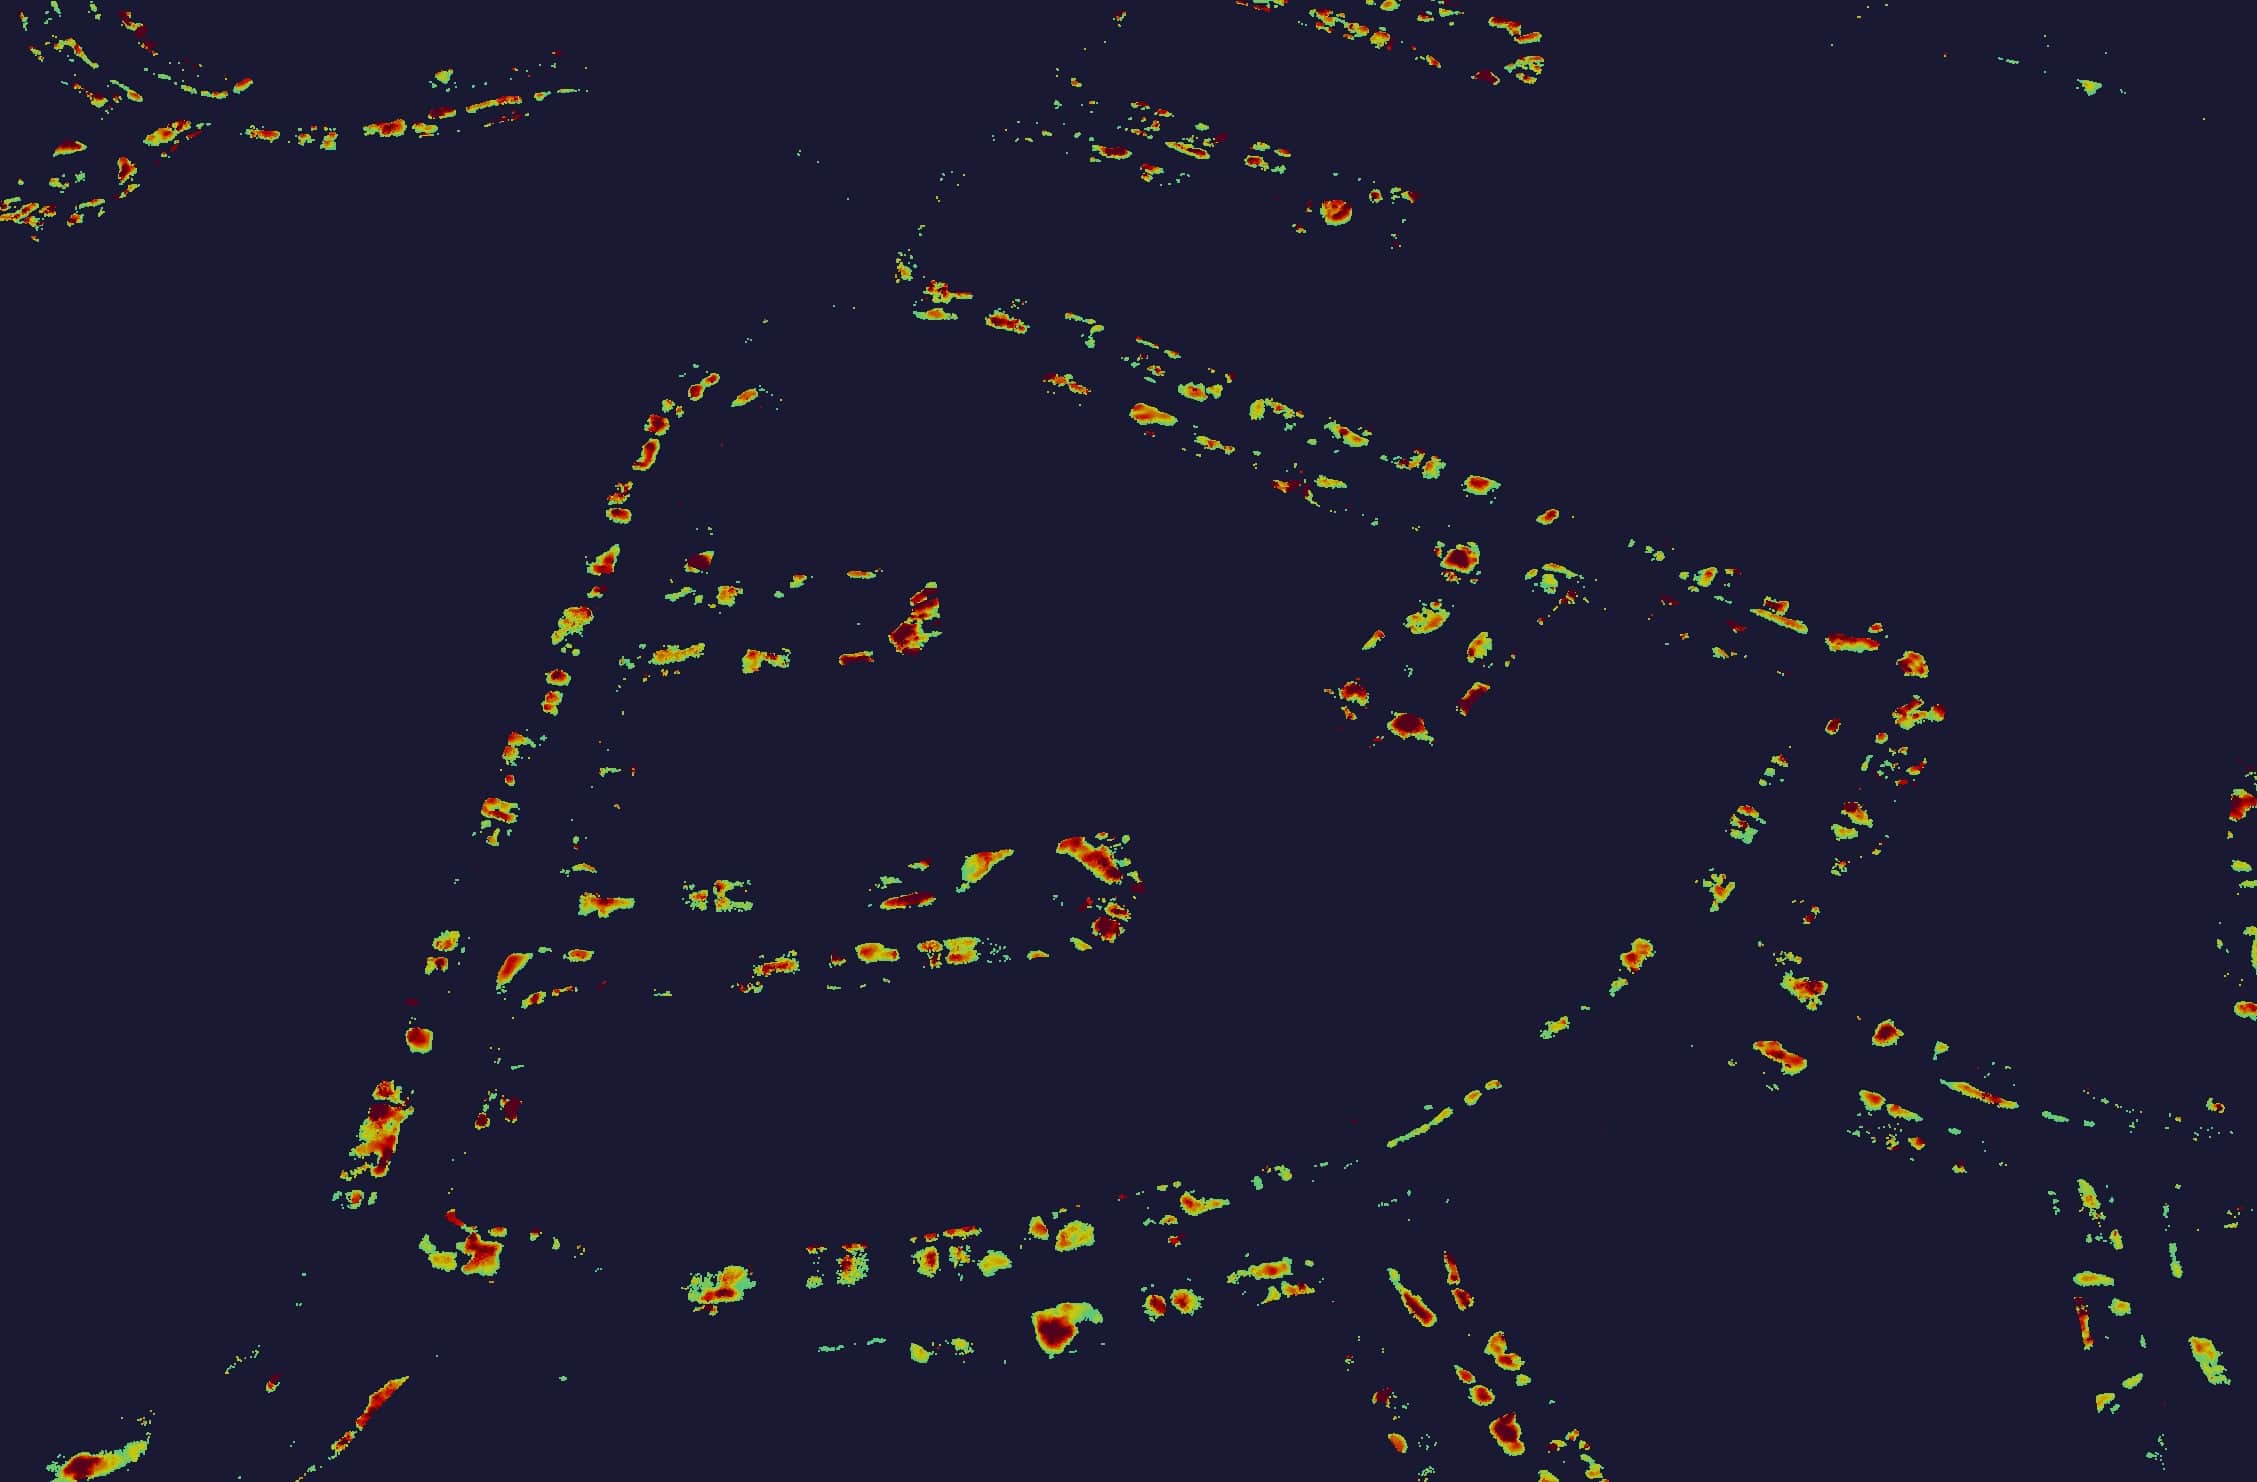
3/3 – Lincoln Laboratory then applied novel algorithms to filter out all additional objects deemed not to be debris, and estimated the volumes of the remaining piles. The volumes gathered from their algorithms were a 95 percent match to the volumes that ground surveyors manually estimated.
“We want this type of lidar and analytics to become established tools for disaster relief,” said John Aldridge, a leader of the Humanitarian Assistance and Disaster Relief (HADR) Systems Group at MIT Lincoln Laboratory. He’s part of the team at the federally funded research and development center that has been developing lidar techniques and advanced algorithms to speed up and simplify tasks of hurricane recovery.
Since its first mission over Houston, the team has imaged thousands of square miles, including all of Puerto Rico and much of North and South Carolina, which were impacted by Hurricanes Harvey, Maria, and Florence. The team is now working with FEMA to integrate lidar and other remote sensing technologies into the agency’s workflow. “We think it could be transformative to the way that disaster recovery tasks are done,” Aldridge said.

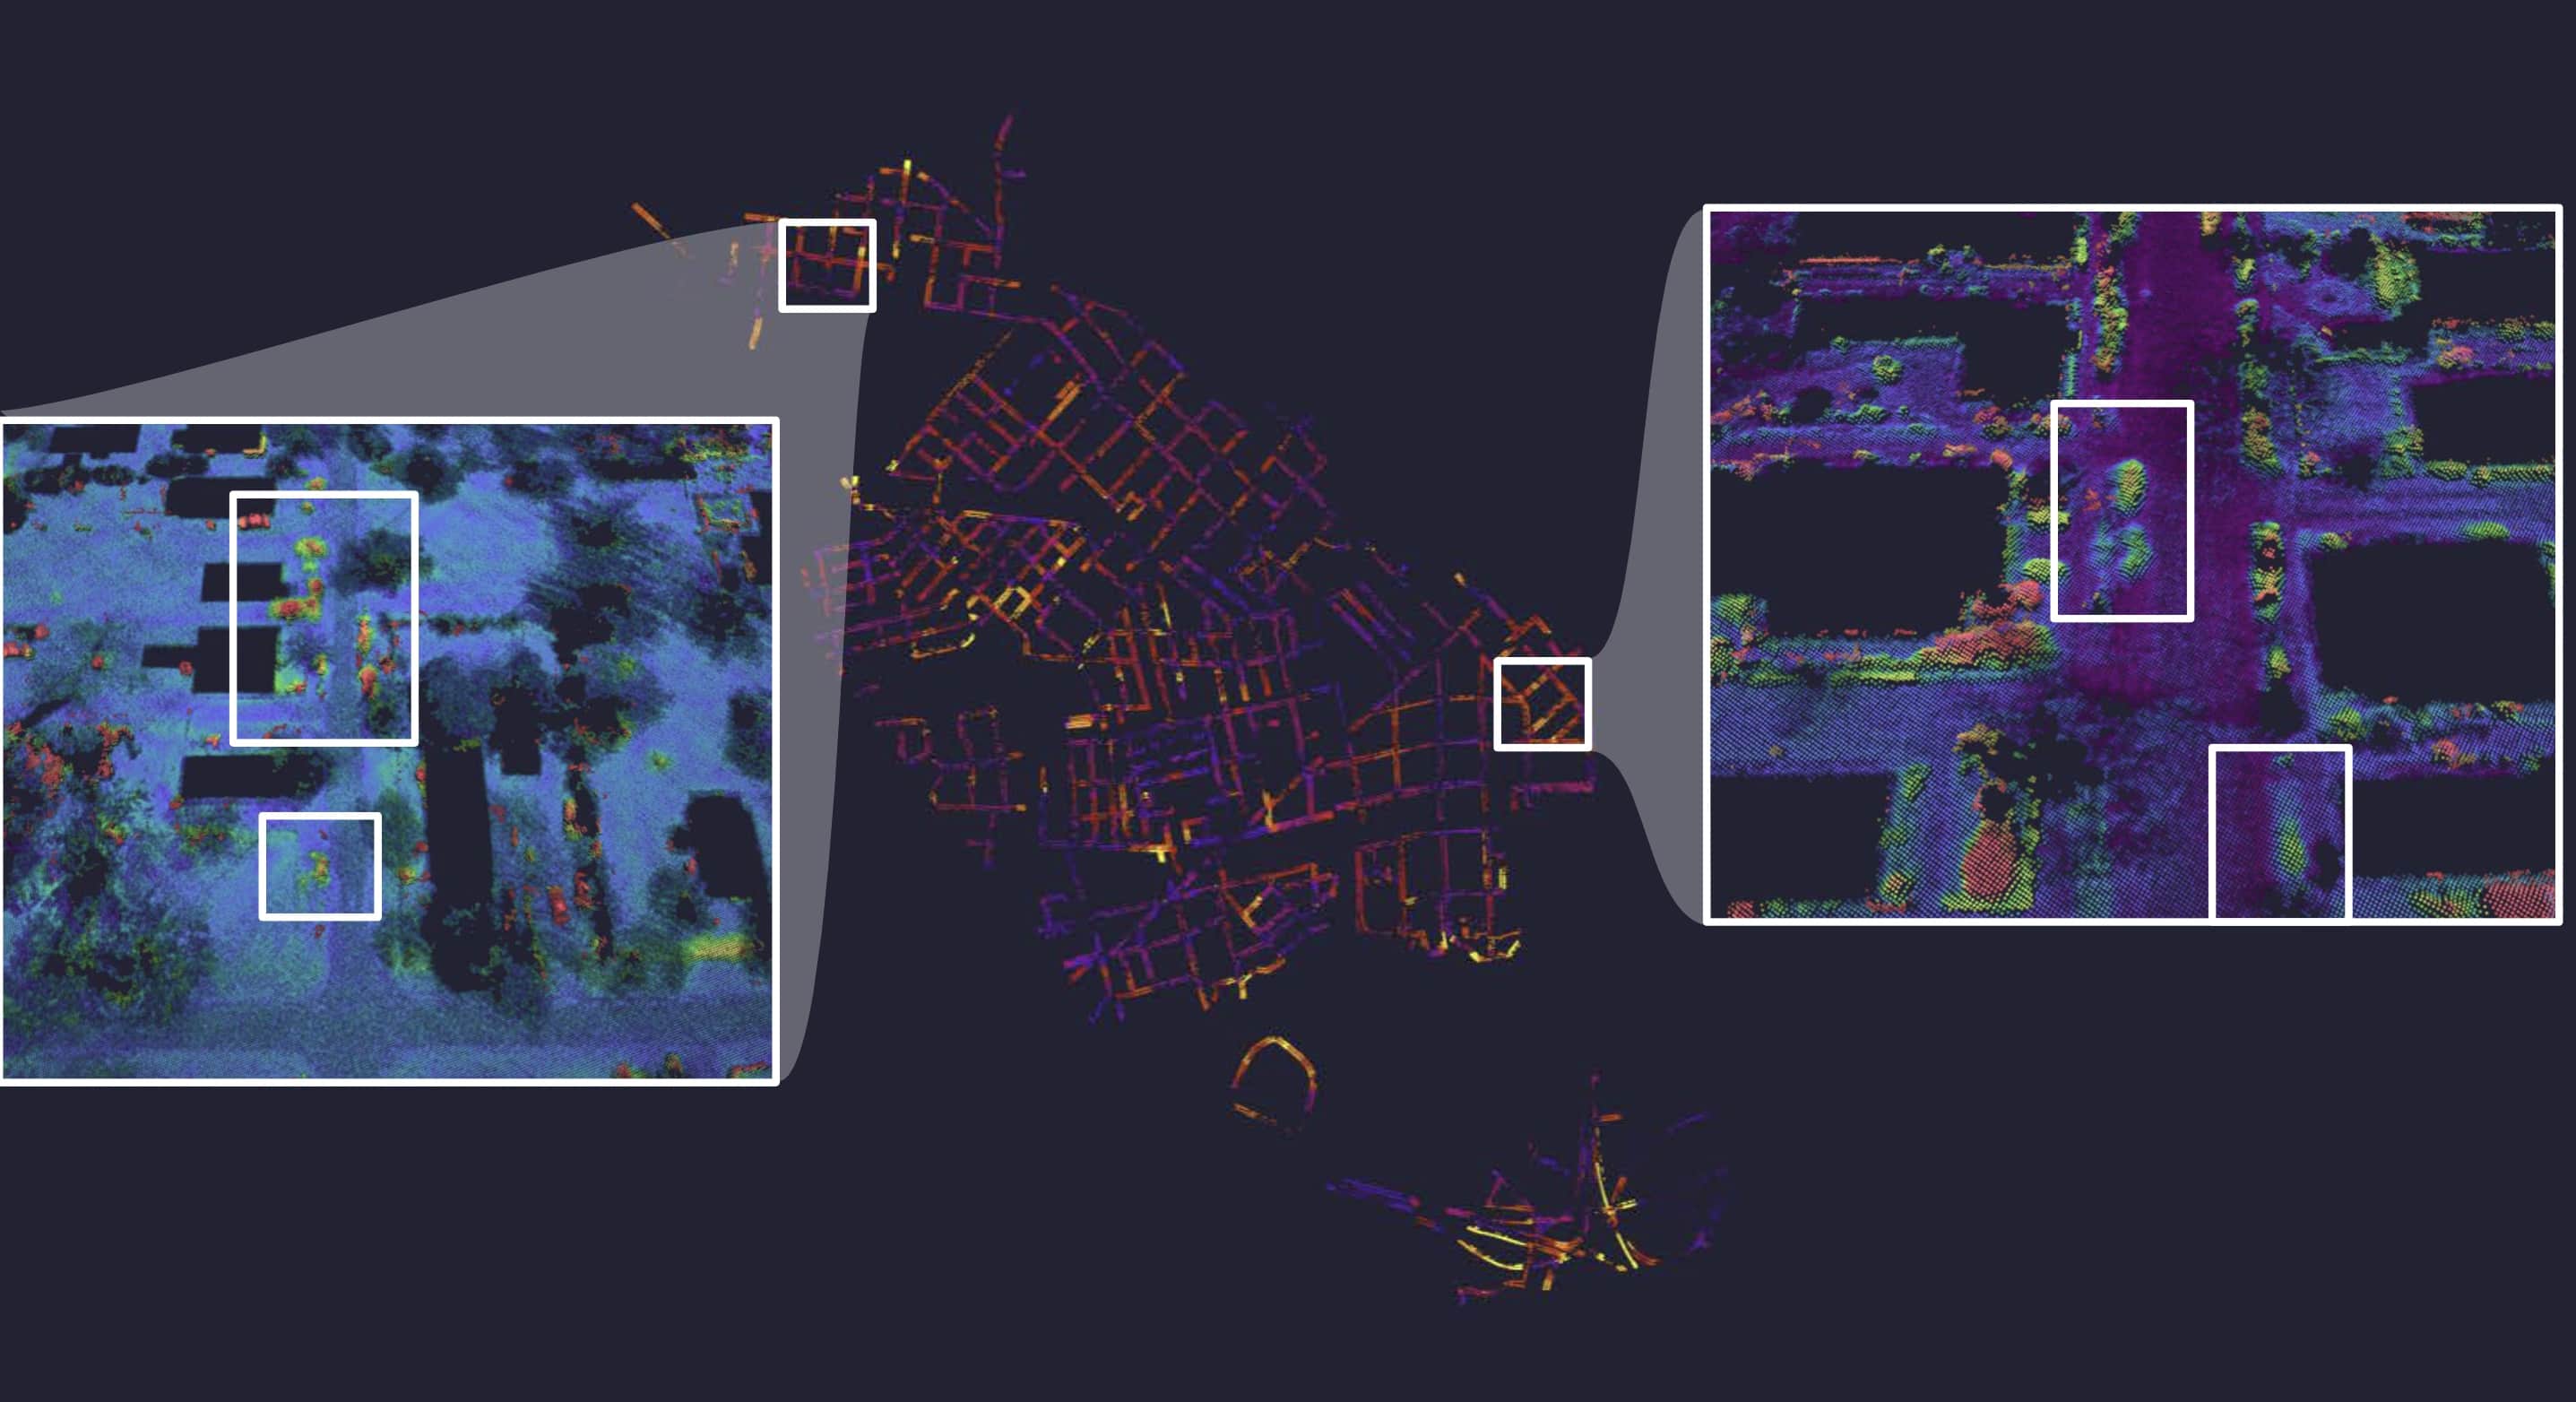
The Windmill Bluff Lane point-cloud is a small subset of this point-cloud covering 50 square miles that was generated from a single scan. Analysts applied the same algorithms that automatically identified debris in that neighborhood to the entire dataset; debris is highlighted below.
Rolling out lidar
The lidar that MIT Lincoln Laboratory is using for these disaster-recovery capability demonstrations is called the Airborne Optical Systems Testbed (AOSTB). It was developed to support research and development in advanced optical detection capabilities, particularly Geiger-mode lidar, which was invented at Lincoln Laboratory more than two decades ago. The AOSTB uses Geiger-mode avalanche photodiode arrays to capture high-resolution, wide-area 3D lidar images.
 “The lab invented a special kind of detecting array that can make 650 million measurements a second, and it can measure the smallest measure of energy—a single photon,” said Jalal Khan, who leads the Active Optical Systems Group that developed the AOSTB.
The resolution the team has targeted is 25 centimeters, balancing a resolution high enough to make out fine scene details with a coverage rate that allows them to image large areas rapidly. “We’re imaging swaths about 600 meters wide going 150 knots,” said Dale Fried, the CEO of 3DEO, an MIT Lincoln Laboratory spinoff company specializing in Geiger-mode lidar that worked alongside the team to collect the lidar data.
As the lidar is flown, the system uses advanced processing algorithms to generate a preliminary 3D point-cloud onboard the aircraft. To address the large volumes of data, the onboard processing concentrates on regions of interest by finding the digital terrain surface and cropping to data near the ground. This processing allows the flight team to know the sensor is working well in flight, and is then the starting point to interpreting the collected 3D scene.
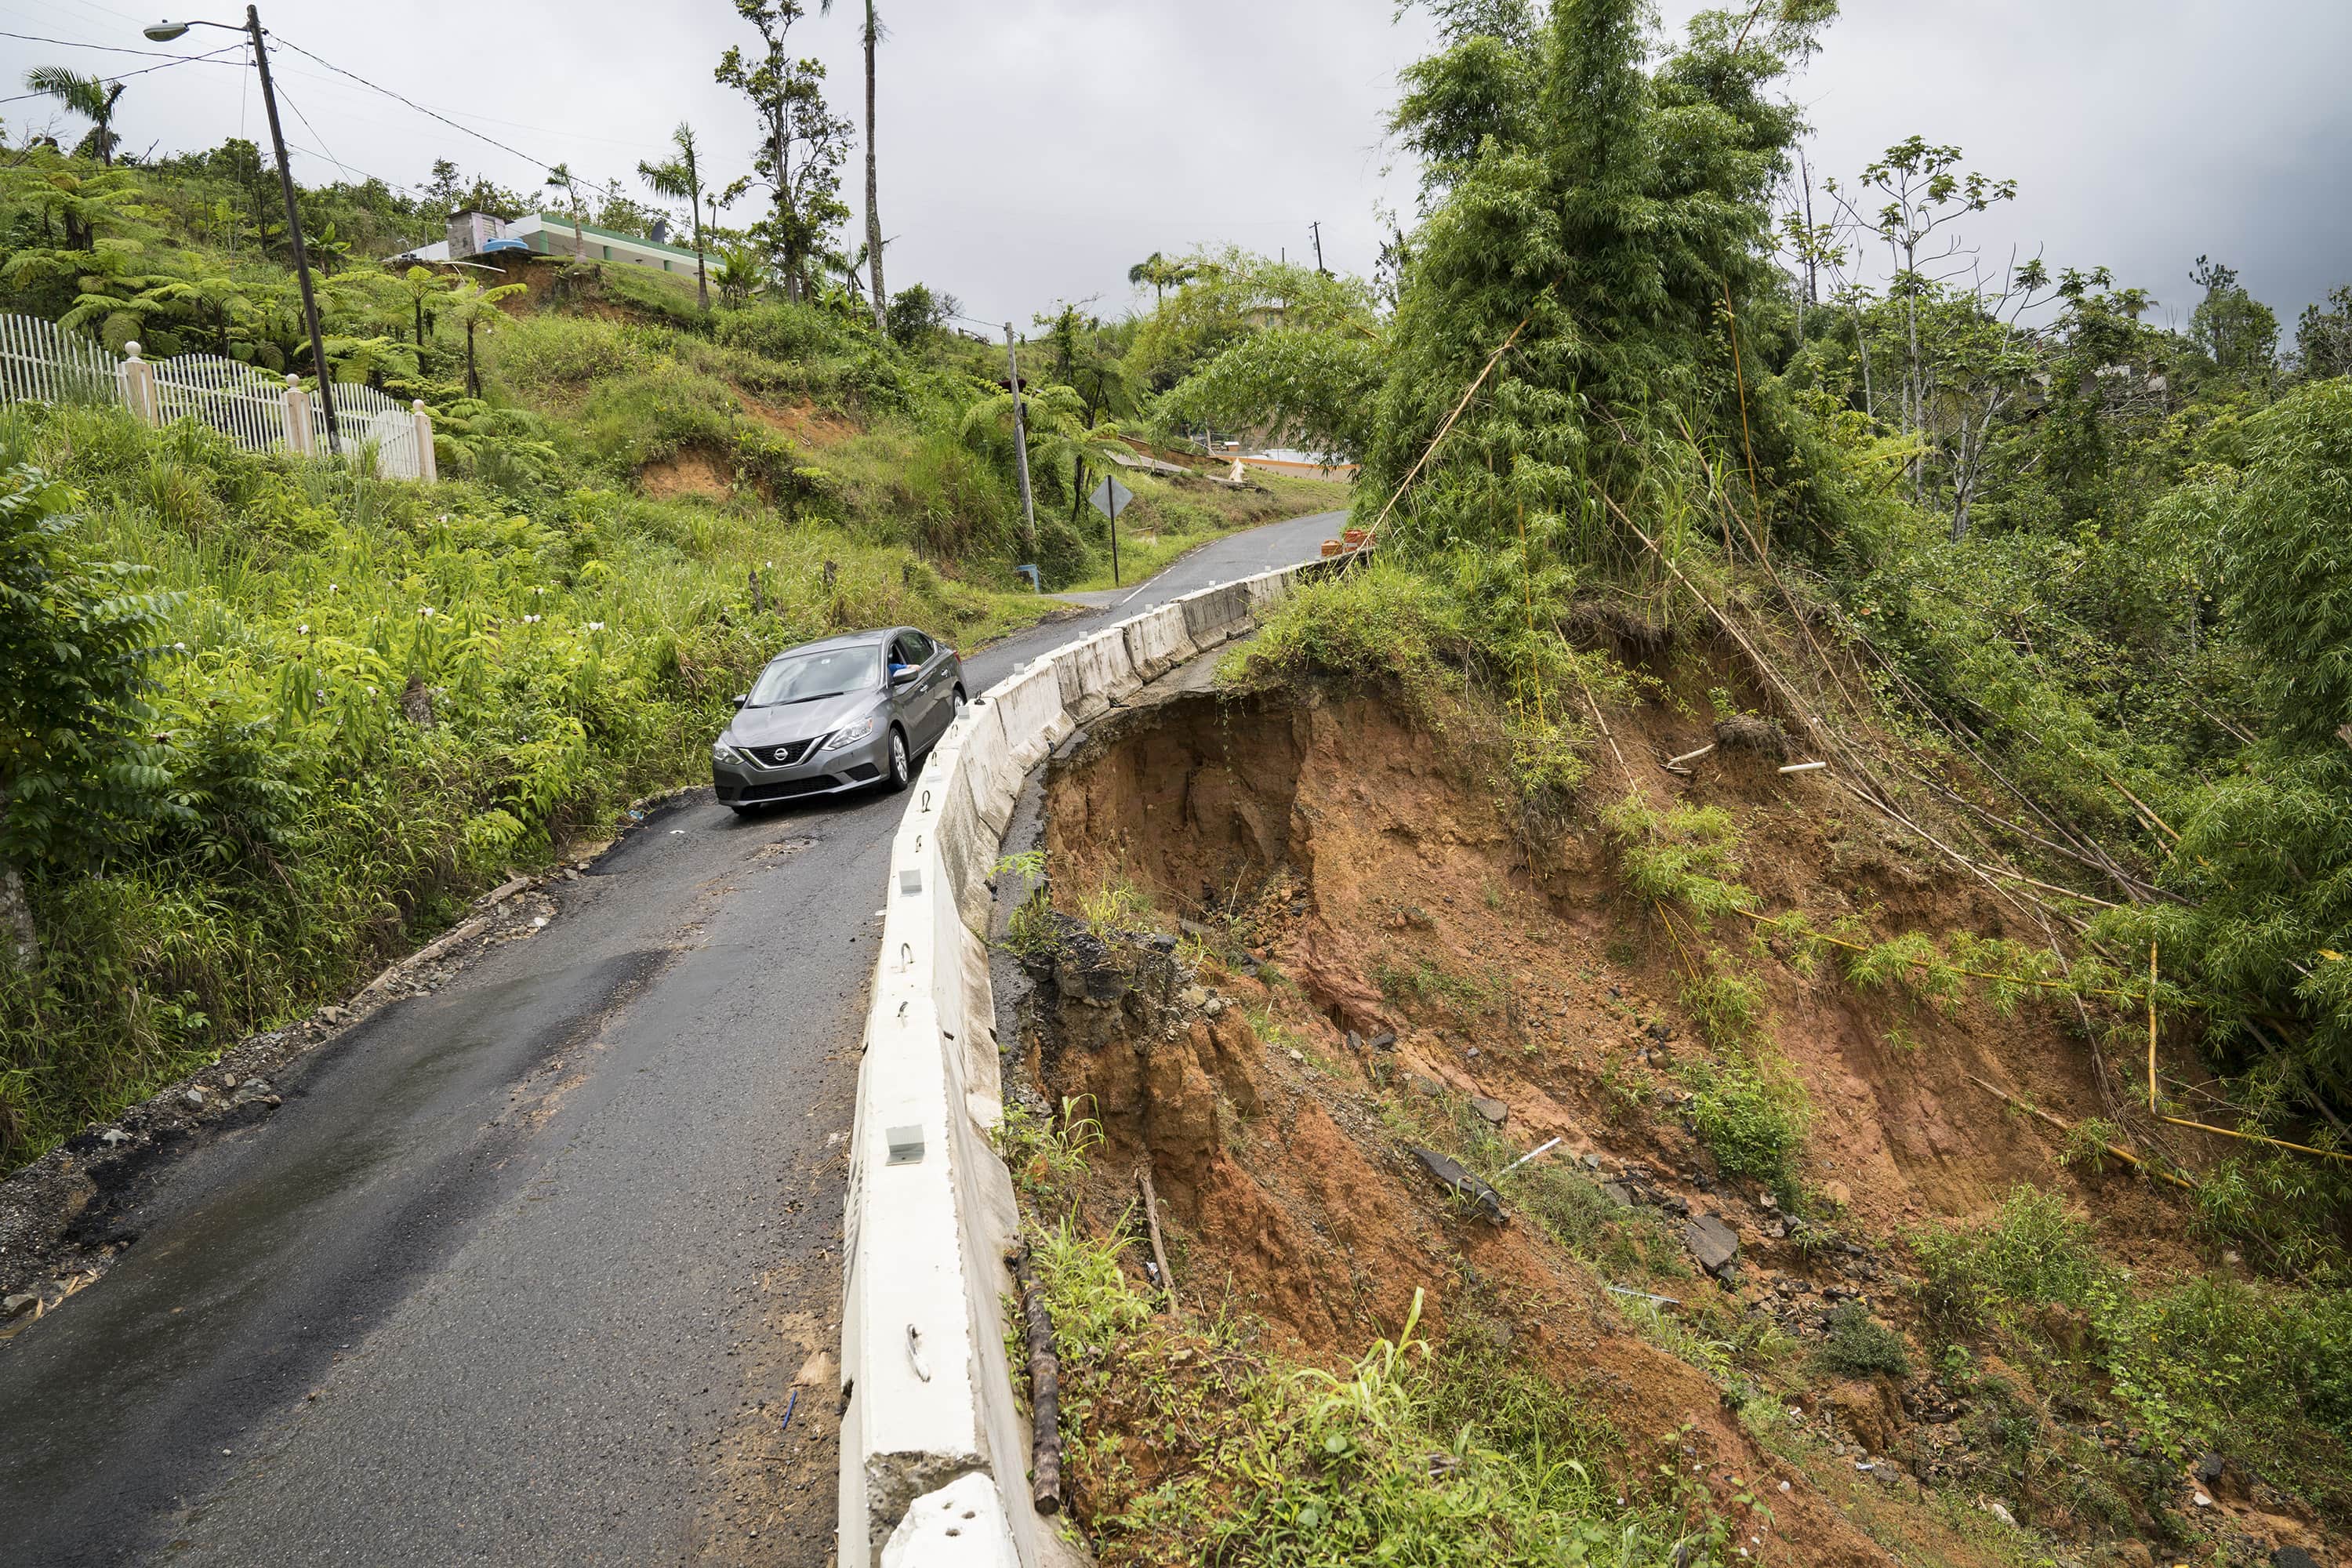
Many hillside roads in Puerto Rico were eroded by landslides after Hurricane Maria. Lidar data is being used to measure these elevation drops precisely and plan repairs. Photo: Glen Cooper.
Proving grounds in Houston
The ultimate goal of the lidar work is to automate the process of answering important questions that FEMA faces after a disaster. Which roads are in need of repair? To what extent is critical infrastructure damaged? Where is there debris and how much needs to be cleared?
Today, remote sensing is used to help FEMA answer some of these questions. Pre-storm and post-storm satellite imagery are compared, and aerial photography is taken. But much of this work is still a manual process. Analysts must go through this photography to identify and categorize damage, and it’s primarily useful for damage that is obvious and to which there is a clear line of sight—a demolished building out in the open, for example, and not a damaged road covered with trees. In most cases, observations will still have to be confirmed with ground-level assessments that require crews on foot using tape measures, taking more pictures, and documenting findings.
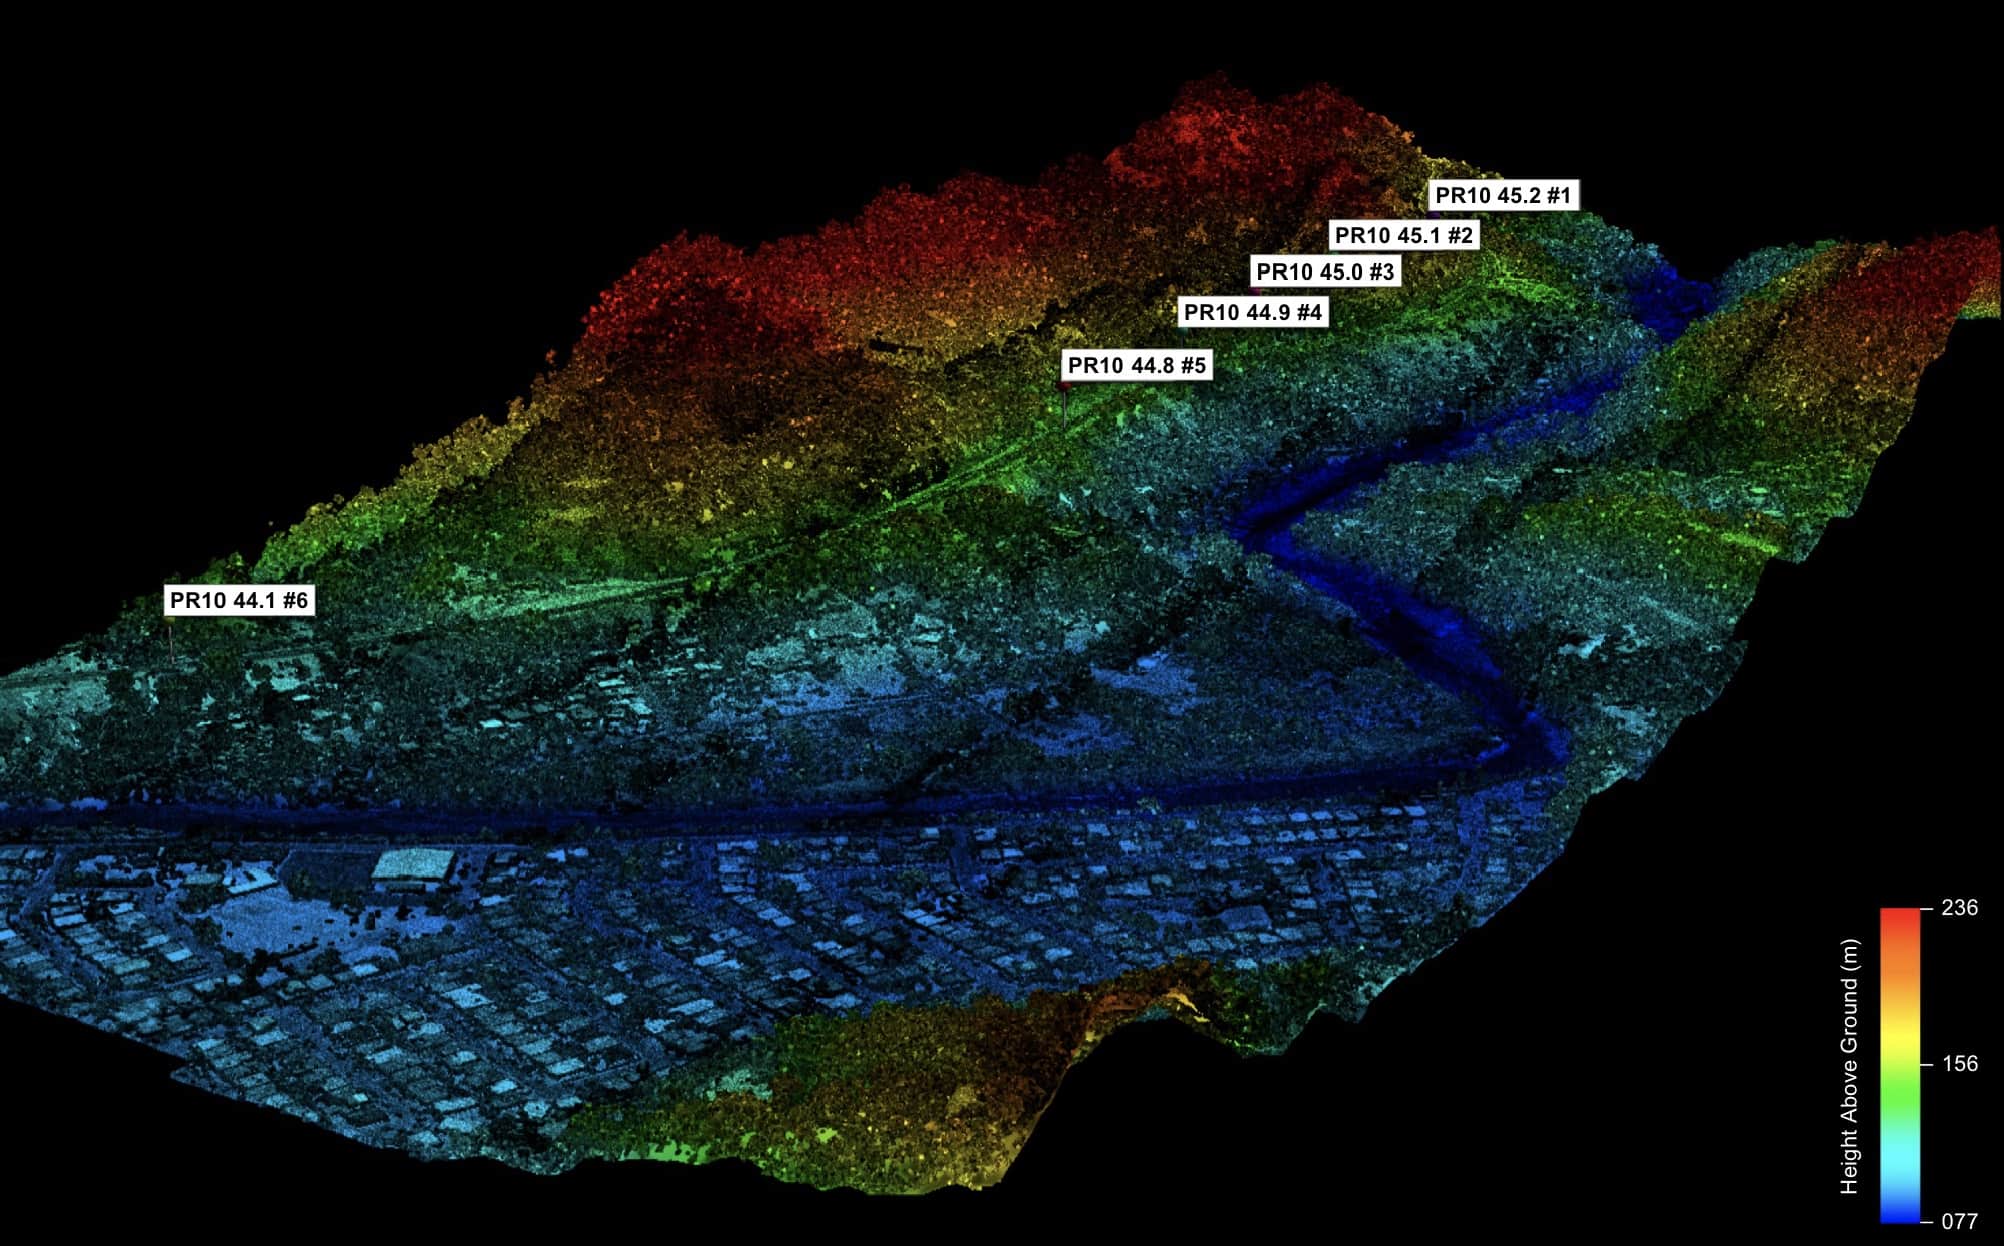
This product shows a 3D point-cloud image of an area in Utuado, Puerto Rico, color-coded by altitude above sea level. Several points of interest along a roadway identified by FEMA as needing closer inspection are labeled.
“If I look at a photo, how can I tell definitively if something is a hole in the road or if it’s a shadow? You need 3D data to answer questions specifically. And to get that to every square mile, you either need an army of people, which is possible but takes a long time, or you can use lidar and an army of computers using machine learning to find answers quickly. That’s what we’re aiming to do,” Khan said.
Prior to Hurricane Harvey, the laboratory had conducted experiments with the AOSTB over a mock debris field to understand how the lidar data could be analyzed usefully and efficiently. Given the immense amount of debris left by Harvey (an estimated eight million cubic yards of debris would be picked up in Houston alone1), Lincoln Laboratory volunteered to attempt debris measurements to support FEMA’s Public Assistance Program, which provides grants to state, local, tribal, and territorial governments for debris removal, emergency protective measures, and restoration of public infrastructure.
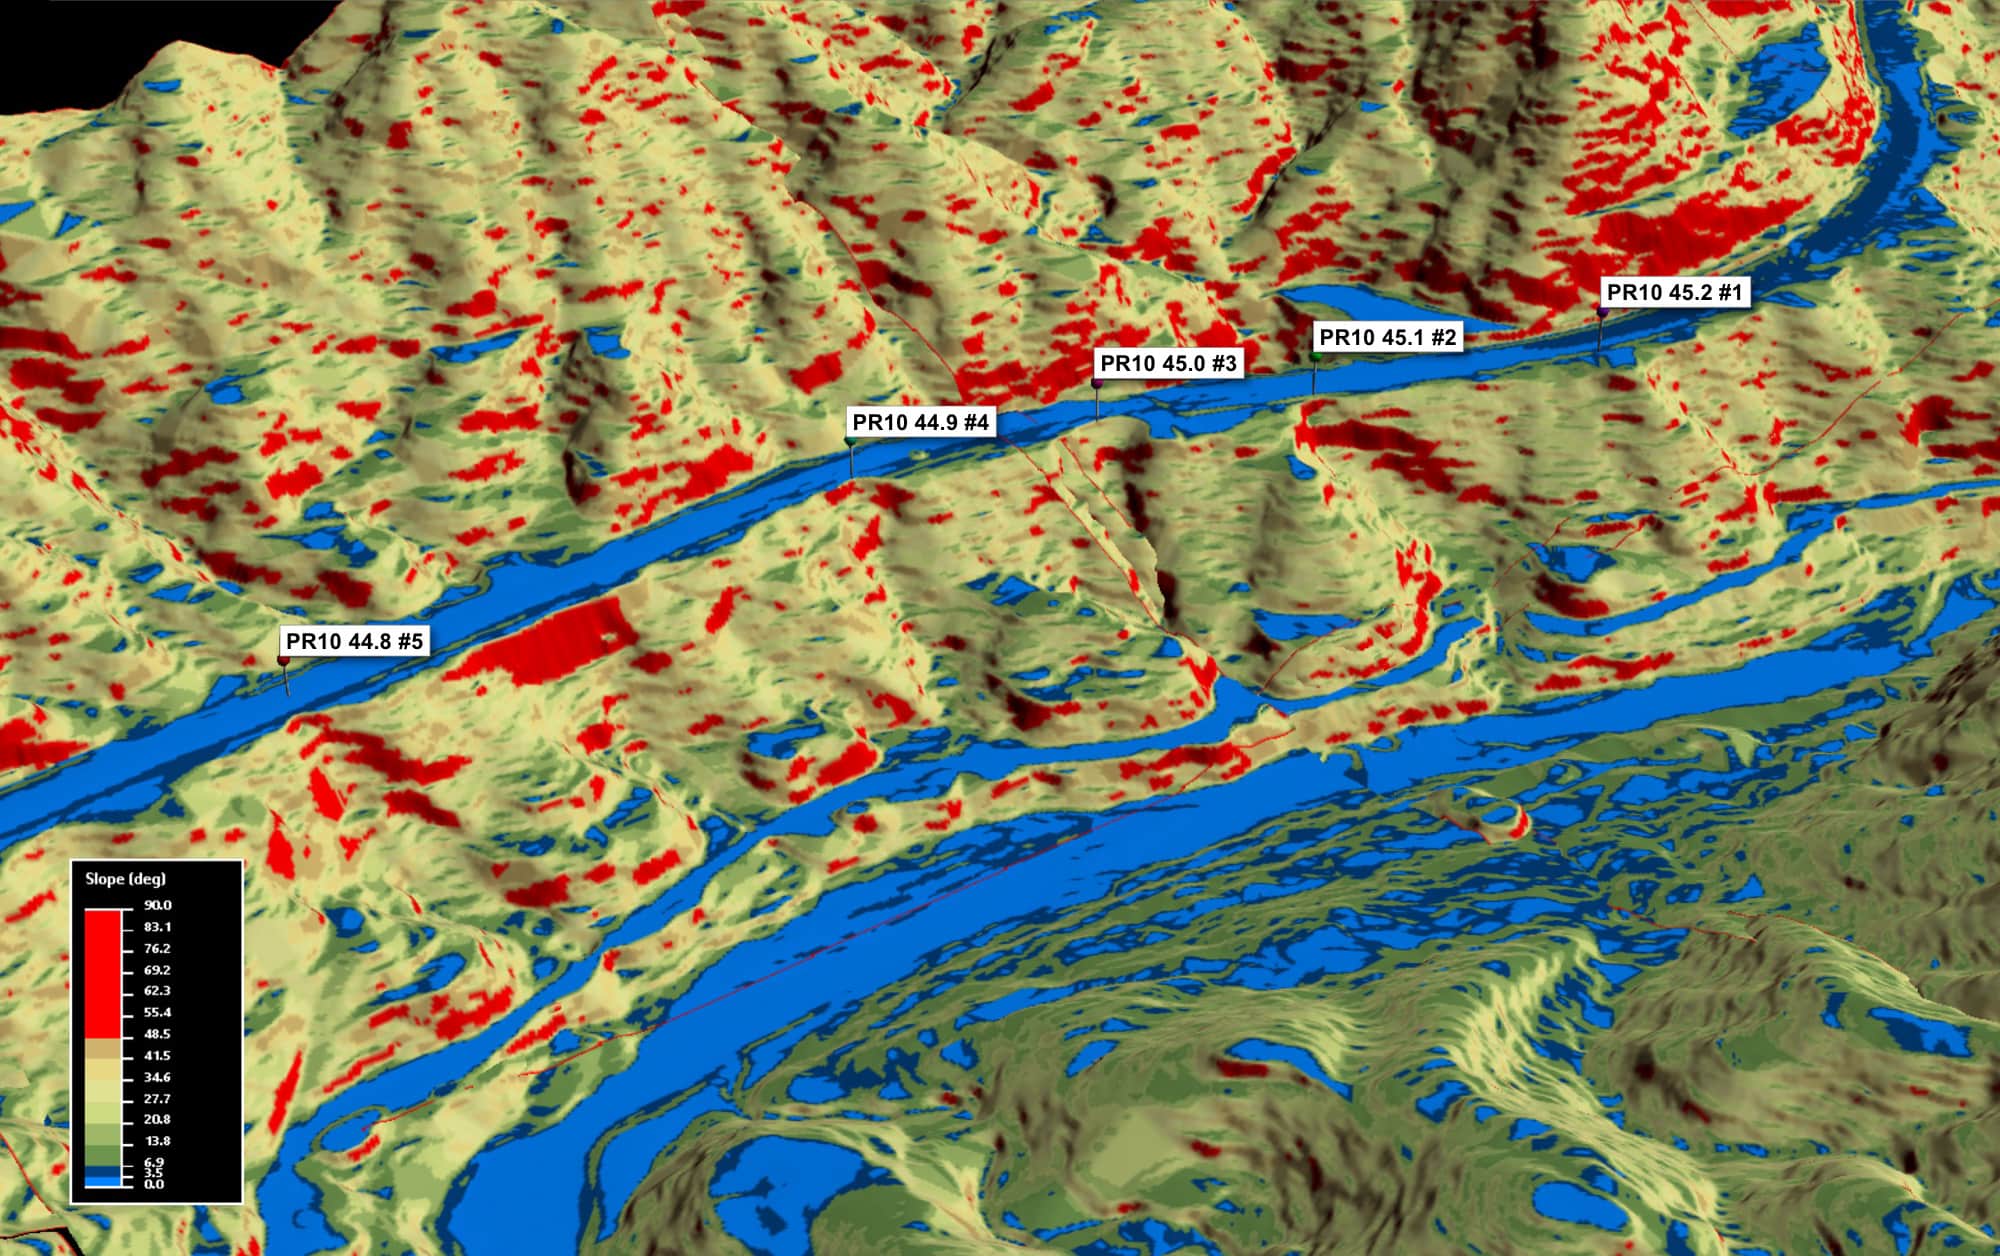
Applying slope analysis indicates areas of topographic relief where erosion or landslides may have occurred.
The lidar system’s ability to see beneath the tree canopy was a key asset, since many of the streets scanned for debris were partially obscured from above by foliage. The AOSTB’s rapidly pulsed laser and single-photon sensitivity allow enough light to trickle down through openings in the canopy and back up to the detector to build a practically complete picture of what’s underneath. After analysts digitally defoliate the lidar images, the next task is developing algorithms that can make sense of what remains.
“We had to teach ourselves first what debris looks like with lidar to build these algorithms,” said Luke Skelly, who worked on the algorithm development team. Traditionally, 3D lidar imagery interpretation has relied on human analysts trained to see patterns in the data. Transitioning this task to algorithms that can accurately discern what objects are in the billions of points in an image is a difficult task.
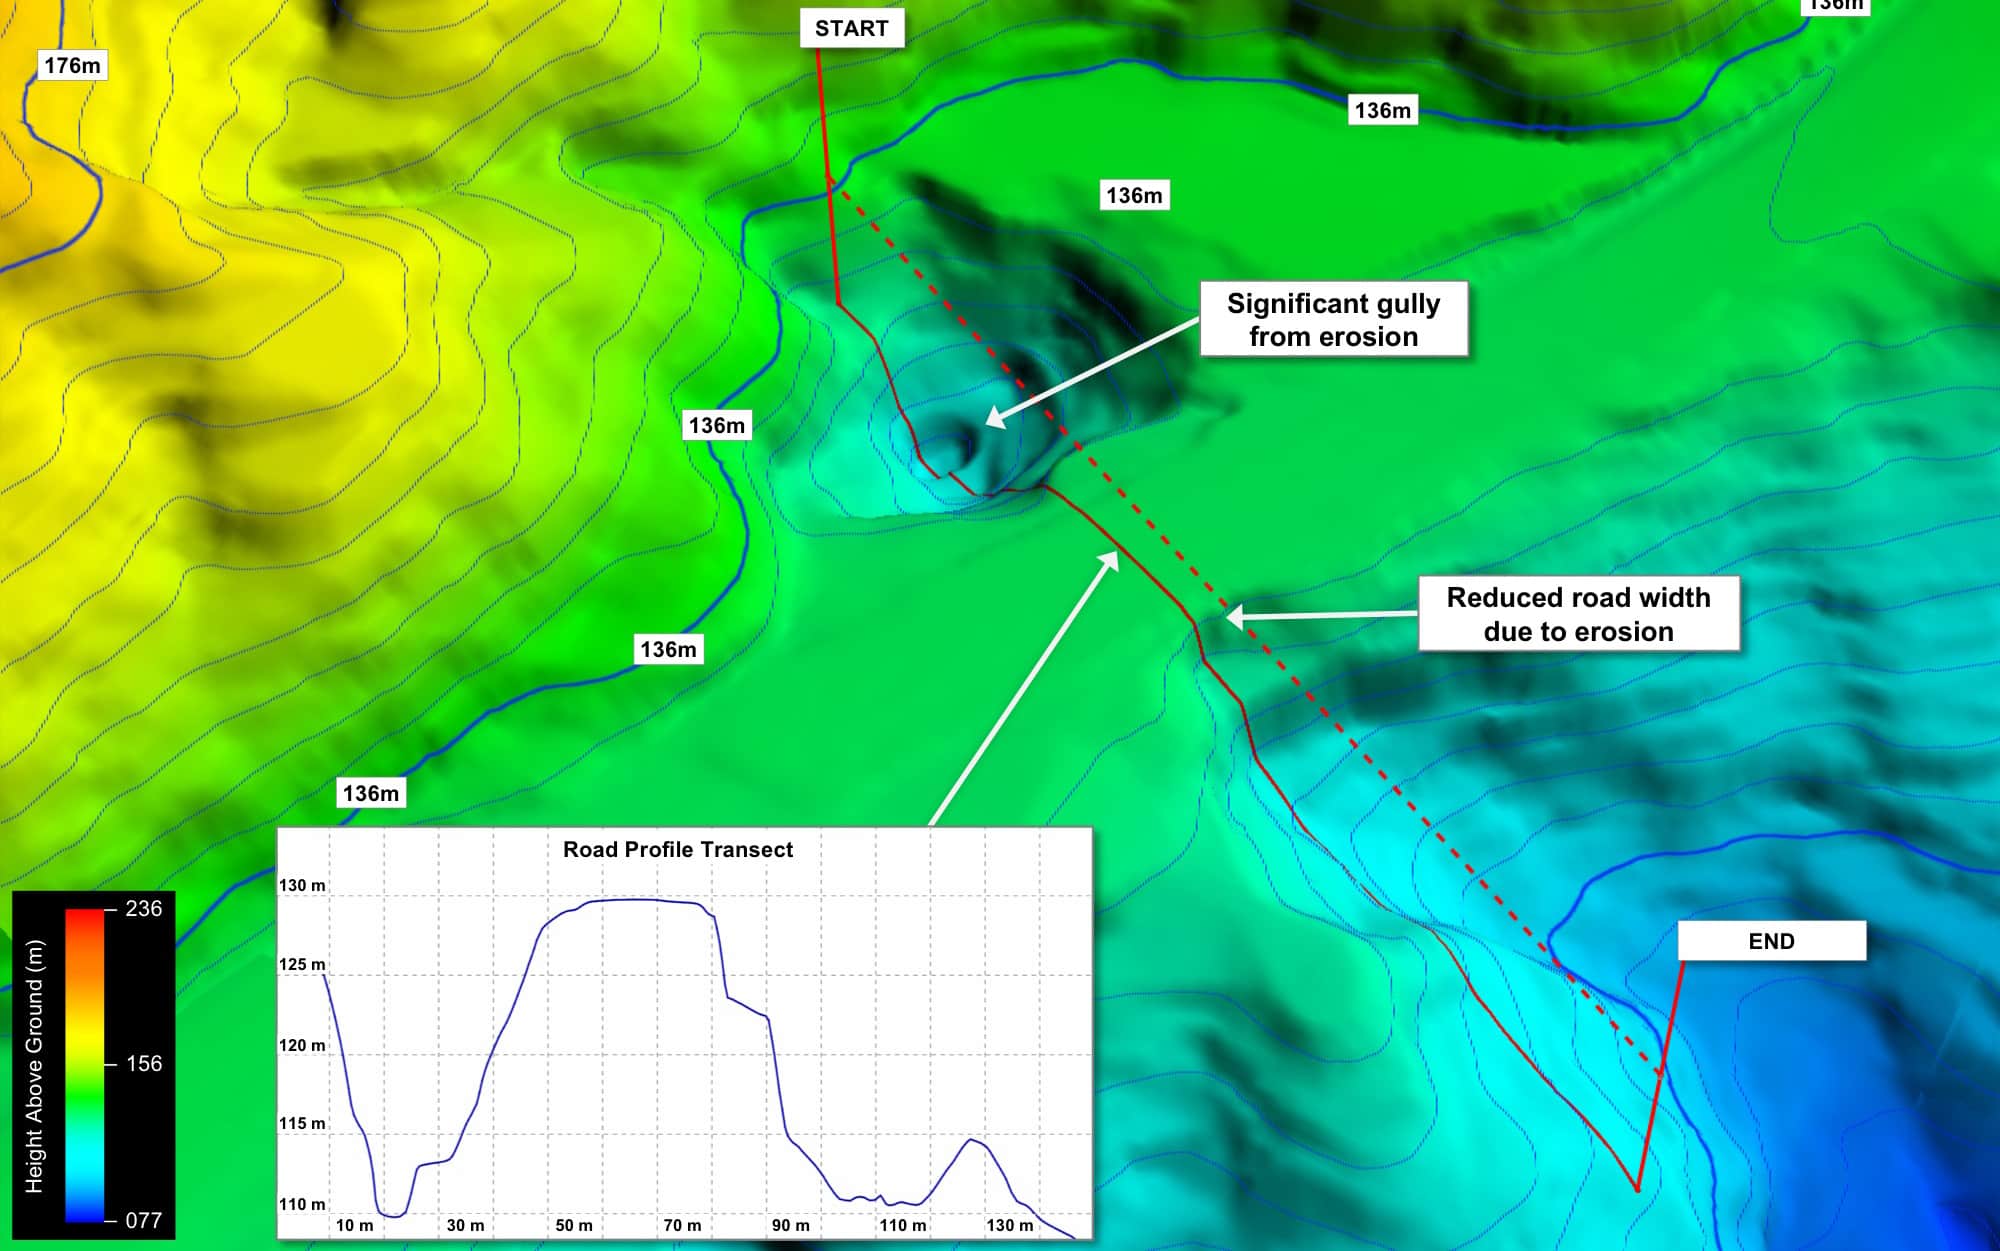
A closer view of the digital terrain model at point PR10 45.1 #2 shows road narrowing and the opening of a gully due to erosion. The estimated volume of the gully is 11,234 cubic meters.
Initial experiments showed success. At Windmill Bluff Lane, the algorithm’s debris-volume estimations were a 95 percent match to USACE engineers’ in-person estimates. This accuracy built trust to apply the methodology
to wider areas.
But each hurricane presents new processing challenges. In Houston, the initial algorithm was tailored for finding debris within fairly standardized neighborhoods. Since then, the team has been adapting these algorithms to different environments. “We are still proving the algorithms out, but the foundational data formed the basis for developing these automated algorithms to find debris,” Skelly said. “Now, we are extending these algorithms to find other points of interest, like damaged roads, buildings, and power lines.”

3D point-cloud image of power facilities near Houston, Texas, is used to identify damage to utility lines and flooding near the plant.
Scaling up
Four weeks after Harvey, Hurricane Maria plowed across Puerto Rico with sustained winds of 155 mph—uprooting trees, downing cell towers, ripping roofs off homes, and cutting electricity to nearly 100 percent of the island.
“We started small, but we quickly had to scale up to address the damage caused by Maria,” said Jon Pitts, also a leader of Lincoln Laboratory’s HADR Systems Group. “In Harvey, we targeted debris. When we went to Puerto Rico, it was about wide area coverage and building a rich dataset that could be analyzed many different ways.”
The team traveled to Puerto Rico in the spring of 2018, installing the AOSTB on a leased BT-67, a long-endurance aircraft capable of eight-hour missions. They mapped the 3,500 square miles of Puerto Rico and the islands of Vieques and Culebra over the course of 23 flights. Then, the analysis began.
Debris identified in the point-cloud map of New Bern, North Carolina, is shown in this lidar debris heatmap, colored purple to yellow based on low to high debris density.
Damage still needed to be assessed months after Maria, especially to roads in mountainous regions. Laboratory analysts supported FEMA’s efforts by performing virtual site inspections on specific roads in the point-cloud map and reporting what they found. For example, they could determine the magnitude of an elevation drop as a result of a landslide or the volume of a washout in a road. At a minimum, this process can augment the manual step of visiting the site to determine how much material is needed to repair damage and how much money will need to be allocated to the repair; at a future stage, it could even cut out the need for this step.
A street in New Bern, North Carolina, is lined with debris from water-damaged homes after Hurricane Florence. Photo: Glen Cooper
The laboratory also applied its lidar research after Hurricane Florence’s washout over the Carolinas in September 2018. After mapping hundreds of square miles along the coastline and river-hugging bands inland, Lincoln Laboratory analysts virtually inspected areas in the point-cloud map that had been reported to FEMA as being flooded. Because the lidar’s laser beam does not reflect as well off of water as the ground, flooded areas were represented in the point cloud model as black (no data), making flood waters visually straightforward for analysts to see, especially after the images are digitally defoliated. This information can help officials quickly determine if critical infrastructure such as power facilities has been affected, or if there are environmental impacts such as coal ash pits that may have been breached by flood waters. The data collected in North Carolina was also used to improve the debris-finding algorithm and to develop new algorithms for finding roads and road damage.
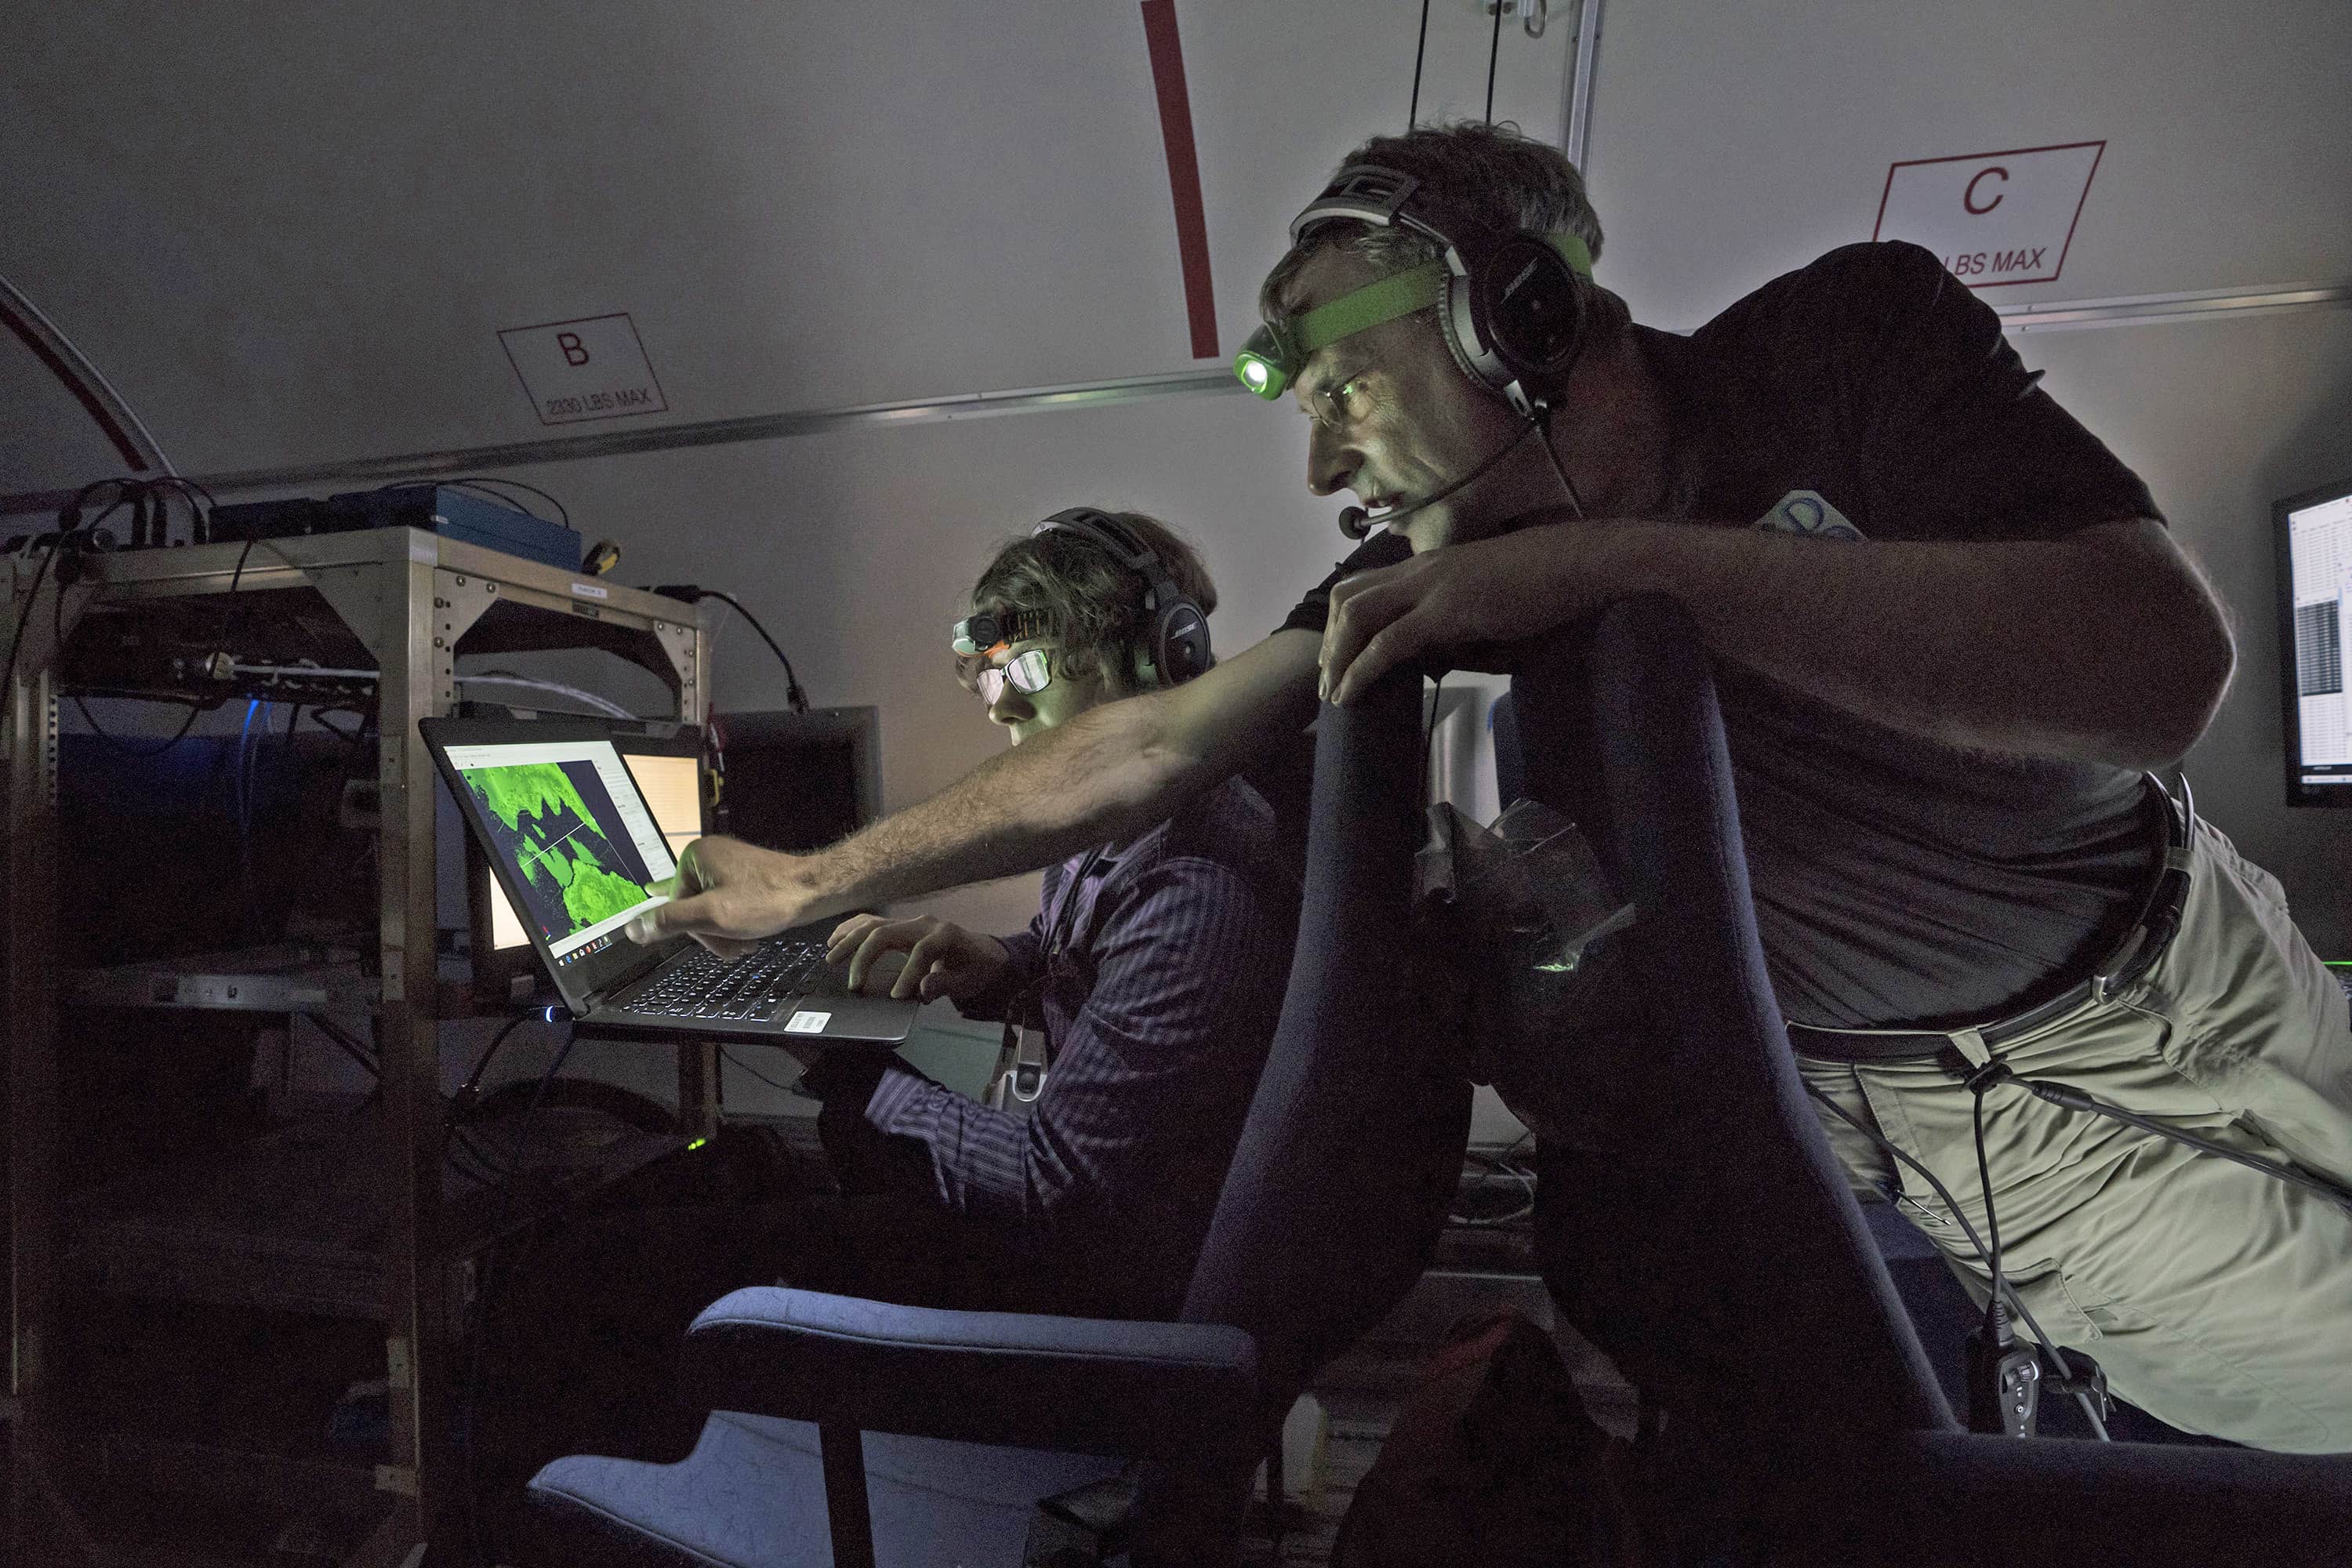
Aboard the aircraft, Dale Fried (right) and Jaron Powser begin analyzing the initial data products being generated as the lidar operates. Photo: Glen Cooper.
Inspecting roads in the lidar data has helped MIT work with North Carolina’s Department of Transportation (DOT). Since Florence, DOT has requested FEMA’s assistance to repair approximately 2500 roads, five percent of which are included in Lincoln Laboratory’s lidar dataset. To help FEMA obtain metrics about the extent of these damages, staff have been analyzing these areas in the data and gathering 3D measurements of damages such as large holes or sections of roadway that washed away. This information can be used to confirm the in-person measurements that DOT obtains.
The team is also thinking of new ways to interpret its lidar data to help FEMA expedite the process of categorizing damages to homes, such as analytics to determine from lidar data if a home has either sustained moderate damage to its roof or walls, has lost its roof entirely, or has been reduced to rubble.
Mapping the future
In Puerto Rico, moving forward means first going back. Besides helping with active recovery, the island-wide dataset is helping officials take stock of what had already been done in the immediate aftermath of the storm. “There was a huge effort just to get electricity up, to build new access roads to reach places. A lot of work was done quickly, and now with lidar, analysts can go backwards to document what has happened,” Fried said.
The AOSTB dataset is being compared to a U.S. Geological Survey pre-storm lidar dataset by overlaying the point clouds and using developmental algorithms to detect and highlight changes. “Transportation officials will be able to determine if an engineering study is needed to see if a temporary road will wash out in the next storm,” Fried added.
Likewise, if another hurricane strikes, the AOSTB dataset will serve as a baseline to compare with a new dataset. The laboratory’s vision is to achieve a workflow efficient enough to allow FEMA to assess which roads they won’t be able travel on, which bridges have been washed away, and which areas have been hit hardest by wind damage or flooding as soon as the lidar data are collected.
In preparing for the future, the key is to find out how lidar can be woven more tightly into FEMA’s workflow from the start. Today, laboratory staff are embedded at the FEMA Joint Recovery Office in Puerto Rico to accomplish this integration and to train staff there in interpreting the data.
“What we’re showing is that lidar complements all of FEMA’s efforts and that it can actually provide a framework to build from. It’s a virtual model of real life,” Aldridge said. “You can think of it like a Christmas tree, where you can start to hang other data you’re working with during a disaster—home locations, photos, storm tracking, surge models, power outages, everything.”
FEMA is motivated to leverage new technology. Its strategic plan published in November 2018 emphasized the need to do so “to reduce complexity, increase efficiency, and improve outcomes.” Aldridge pointed out, however, that compared to the staggering costs of disasters in the United States ($306 billion in 2017 from earthquakes, hurricanes, and wildfires2), government investment in research and development for disaster relief technology is relatively low. “In my opinion, we as a country can’t afford to not invest in technologies like these,” he said, “especially as extreme weather events are on the rise.” A 2018 NOAA analysis concluded that the global proportion of tropical cyclones that reach Category 4 and 5 levels will likely increase over the 21st century, and sea-level rise is causing higher storm surge levels.
Achieving automation at the scale that the team envisions could significantly cut the costs of assessing damage and planning recovery tasks. What they’re working toward is not waiting on cues from FEMA to ask, for example, “What roads in this region are damaged?” but to be able to proactively tell FEMA that their algorithms have detected, say, 100 roads at specific locations that are in need of repair.
Getting to that level of automation is “a worthy endeavor,” Pitts said, “and it’s going to be an exciting research road to get there.” Ultimately, he wants lidar to be a national, if not global, capability that responders and emergency managers can access easily. “Gaining awareness of what’s going on immediately after a disaster changes the dynamics of disaster relief and all of the factors involved in saving time, money, and lives,” he added.
When giving briefings about this lidar work, Pitts plays a movie that the team created from the imagery. The viewer is flown through the 3D lidar landscape, soaring above the trees in Puerto Rico and down to the ground, around collapsed buildings and roads devoured by landslide. It is a striking way to grasp the destruction that has occurred there. It is also a testament to lidar’s ability to deliver what is needed most amid the chaos of disaster: clarity.
Kylie Foy is a science writer at MIT Lincoln Laboratory.
1 https://www.nytimes.com/2017/09/06/us/garbage-harvey-removal.html.
2 https://www.ncei.noaa.gov/news/national-climate-201712.