
Figure 1: Example of initial lidar building extraction with viewshed analysis.
Northeastern University (NU) is a top-tier, globally focused, private research university that stresses experiential and lifelong learning. Founded in 1898, it is headquartered in Boston, Massachusetts. NU’s global network and reach include advanced degrees and custom corporate engagements at physical campuses in Toronto, Ontario; Charlotte, North Carolina; Seattle, Washington; and now Silicon Valley and San Francisco, California. The California campuses utilize an employer-embedded approach and emphasize an education in science, technology, engineering, and mathematics. The Silicon Valley campus1 is situated in San José, the “high-tech capital of the world”, as the first education hub to be hosted by a widely respected industry and research leader, Integrated Device Technology (IDT). This pioneering, one-of-a-kind partnership allows students direct access to exclusive real-world learning opportunities, in a globally recognized center of innovation, entrepreneurship, and growth. The San Francisco campus is co-located directly with WeWork, a co-working space for global companies to grow and innovate.

Figure 2: The extent of the lidar processing is defined by the nine tiles displayed within the Area of Responsibility (red outline). LAS files were merged using LAStools, and projected to UTM 10N WGS 84 then classified into ground, buildings and vegetation. The classified LAS file was imported into a Terrain Product, along with an extent boundary, and a simplified water polygon representing Elliot Bay for hydroflattening. Base data source: Esri, DigitalGlobe, GeoEye, Earthstar Geographics, CNES/Airbus DS, USDA, USGS, AeroGRID, IGN, and the GIS User Community.
Northeastern’s geospatial programs
Northeastern’s geospatial programs2, part of the technology-degree suite, enable students to acquire practical skills and theoretical essentials to lead with geographical xyzt data in the public and private sectors. Particular strengths are in remote sensing and machine learning, including lidar. The program is offered entirely online, ideal for the professional worker needing a flexible schedule. Most classes are about equally weighted between practice and theory. Assignments are conducted between our virtual lab and a student’s PC. The high practice content enables student learning to be entwined with the environment in which they live and work. We find the immediate applications to be highly experiential, bridging the world of scholarship and practice. Students can authentically integrate real-world scenarios and examine them through a sometimes outside-the-box and scholarly lens in their workplace, then reflect on the way needs may be addressed with new knowledge they have acquired. We focus on cultivating a dynamic online learning “community” as well as student autonomy. Faculty facilitate and guide a student’s journey to discoveries, while providing a supportive environment including clear expectations and timelines. Autonomy helps students improve their ability to identify what they need to know, how to set goals, how to seek help, and how to be effective. To quote William Butler Yeats, “Education is not the filling of a pail, but the lighting of a fire”—this is our hope.
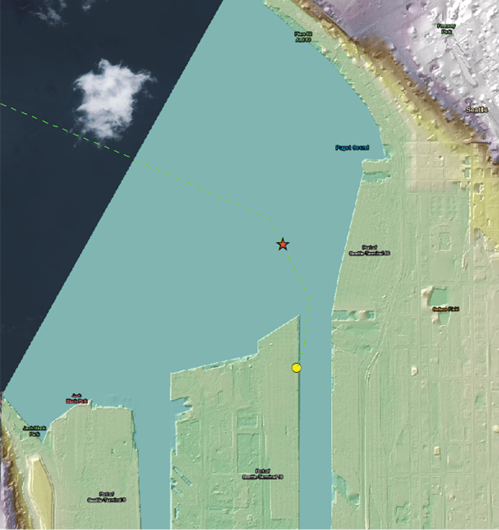
Figure 3: Bare earth DEM with 40% transparency on top of bare earth hillshade (above); first returns DEM with 40% transparency on top of first returns hillshade (below).
When I arrived at Northeastern in 2007, the GIS and remote sensing profession was less mature. GIS dominated in environmental and municipality applications, whereas skills in remote sensing were by and large exclusively available in Ph.D. programs. Thus we commenced an initiative to popularize the remote sensing skillset. We created a new remote sensing certificate and, soon after, a master’s concentration. By 2013, we applied for USGIF Accreditation and subsequently an NGA-USGS Academic Center of Geospatial Excellence designation. These national organizations have helped to steer professionalization of the field and draw from a large body of knowledge and competency models. In-depth curriculum mapping afforded success in both pursuits. The master’s degree draws from four hard-skills competencies identified in 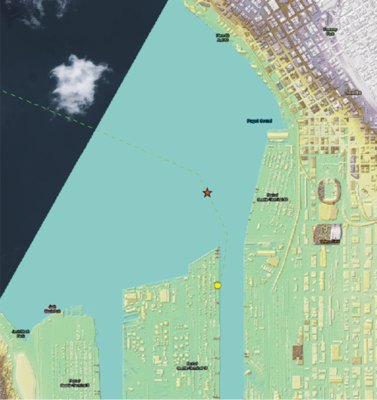

- GIS and Analysis Tools: the proper execution of various elements and approaches of GIS and analysis to capture, store, manage, and visualize spatial (location) data;
- Remote Sensing and Image Analysis: the synthesis of technical, geographic, and intelligence and collateral materials from satellites, airborne platforms, UAVs, terrestrially-based sensors, etc.;
- Geospatial Data Management: the management, retrieval, and dissemination of data to facilitate integration, analysis, and synthesis of geospatial information; and
- Data Visualization: to generate products using cartographic and visualization principles for decision-makers.Cross-functional knowledge areas transcend specific core competencies and include soft skills, described using three competencies:
- Synthesis: the ability to identify, locate and obtain essential information efficiently and effectively; to decompose problems into parts to facilitate a search for a solution; to draw conclusions, recognize patterns or trends, and determine the consequences of an action;
- Reporting: to express ideas, information, and facts clearly; to tailor verbal, written, and other forms of communication to intended purpose and audience; to write concisely and explain complex ideas plainly; to solicit constructive feedback from peers and synthesize recommendations for improvement; and
- Collaboration: for example, to develop and leverage professional networks to facilitate cooperative partnerships that help attain goals.
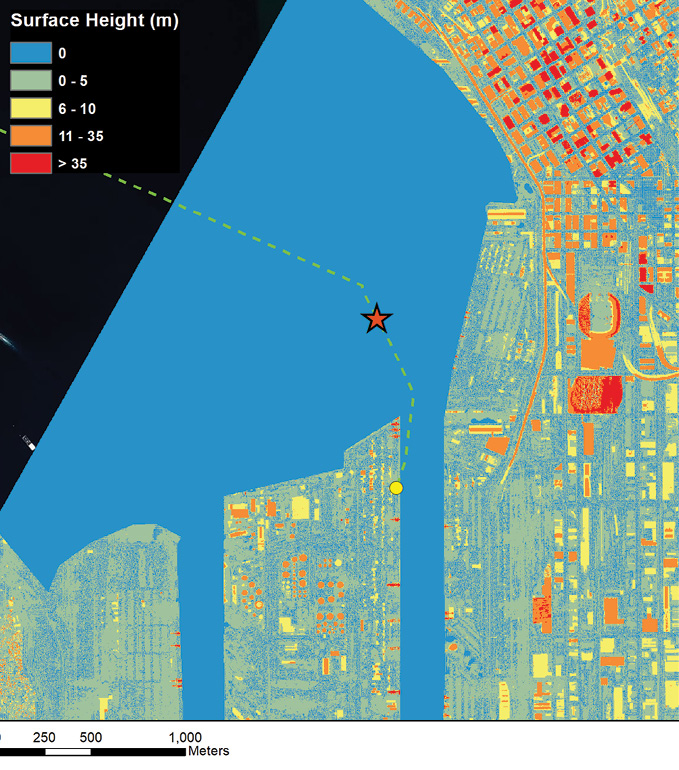
Figure 4: Normalized DSM (NDSM) showing absolute heights displayed with percent clip stretch (min 0.5, max 5), with building polygons, and approach of high-interest marine vessel (HIMV) overlain. Real-time marine traffic data are used for practice, acquired from marinecadastre.gov/data/.
These competencies build on those of other established governing bodies, including The Geospatial Technology Competency Model (US Department of Labor); the Geospatial-Intelligence Professional Certification blueprint (NGA); the Future U.S. Workforce for Geospatial Intelligence (National Research Council); and the Geographic Information Science and Technology Body of Knowledge (UCGIS). They reflect a student’s capacity to integrate technical proficiency, creativity, cognitive science, empathy, and contextual cognizance, all necessary for geospatial success. The soft skills emphasize a trajectory to cultivate talent and create bridges. In the hard-skill arena, we “teach to the problem and not to the tools.” While we encourage students to equip their geospatial workbench, we also emphasize utility and relevance. Assignments are sequenced and structured to guide students through the process of creating high-quality geospatial products that connect to a broader role of managing, questioning, analyzing, and visualizing such data. Such examples for lidar are provided in this paper.
Geospatial faculty are instrumental in student learning and the program’s success. They constitute a rich network of academic and industry professionals who offer their expertise toward program excellence. They include scholars; federal and state employees; and image scientists. Their unique expertise facilitates a rigorous professionally-informed curriculum, while retaining academic depth.
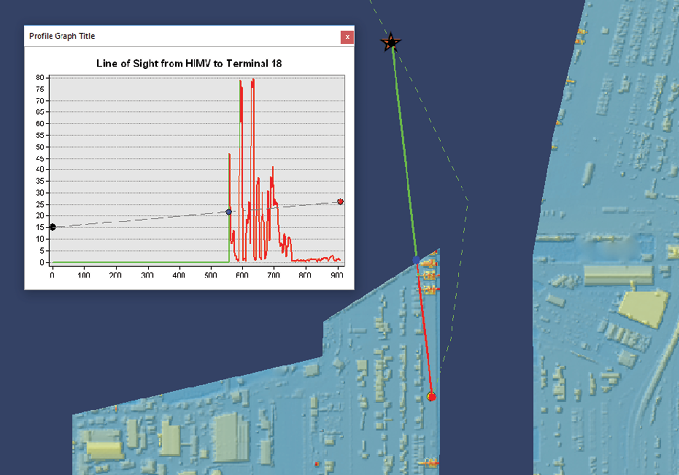
Figure 5: A potential line of sight for an approaching HIMV to the port terminal. It illustrates how tall cargo cranes obstruct the visibility of the terminal’s berthing point.
Classes with lidar content
The geospatial program offers four classes with lidar-specific content. A foundational course called “Introduction to Machine Learning for the Geospatial Professional” explores a range of essential routines for digital image processing and big-data development, including enhancement, machine learning, information extraction, data reduction and analysis. Included are a variety of data types from high to low spatial and spectral resolution, SAR, and lidar. We evaluate machine learning approaches (object-based image classification, decision trees, neural networks) and spectral pattern techniques for image classifications. We appraise data integration techniques for combining multi-source and 3D datasets and use quality control and assurance techniques to assign a confidence level indicating reliability of results.
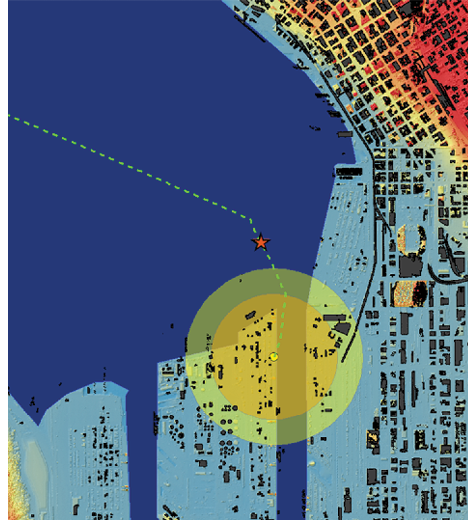
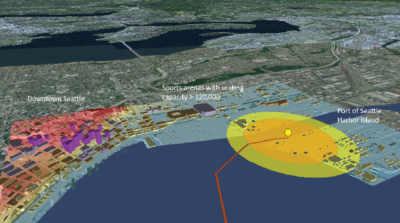
Figure 6: Simulated impacts of an explosion from the high interest marine vessel were modelled using buffers of 500 m and 700 m radius around terminal berthing point: (above) map view; (below) simulation using Esri ArcGlobe.
A second offering is our radar and lidar course. As the name indicates, half of the course is dedicated to lidar, covering the underlying principles of measurement techniques and the interaction of lidar signals with natural surfaces and the atmosphere. Students are introduced to different lidar airborne and satellite systems, as well as terrestrial systems, principally for urban applications. Students learn how to acquire, manage, retrieve, create, and disseminate data to facilitate its analysis and synthesis. They analyze derivative products, work through application-based exercises, troubleshoot and resolve data-specific problems, then create a variety of spatial features such as buildings, trees, water bodies, land classes and surface layers, perhaps combined with a viewshed analysis (e.g., Figure 1). Students work collaboratively via discussion boards to achieve goals through sharing and integrating ideas.

A last complementary course in our lidar suite is “Photogrammetry and GPS”. Photogrammetry as a scalable 3D tool is introduced, with a focus on image rectification, ground control and aerotriangulation, digital elevation models, and topographic mapping with discussion around the fundamentals of geodesy.
I taught the automated feature extraction class in spring 2018. I requested a summative assignment that required students to combine workflows for a seaport vulnerability assessment. The workflow is driven by multiple types of open-source data. Students fuse these data into foundational geospatial products intended to help port managers address security concerns for a fictional scenario. The assignment includes data acquisition, processing methods, analysis, real-time data overlays and visualization. Students are asked to process lidar, ortho images and other geospatial data, then perform automated feature extraction, and finally create 2D and 3D analysis products.
Figures included in this paper are example results from this guided assignment completed by graduate student Åsa Bergman. In the first step, students are asked to define the area of port interest (the current situation) and the area of responsibility (AOR; Figure 2).The work then proceeds using lidar point-cloud processing and terrain product creation. The lidar dataset used comes from the Puget Sound LIDAR Consortium. Unclassified LAS files, with a nominal point spacing of approximately 1 meter and collected during the leaf-off season, are downloaded along with associated metadata.
In the next step, DSMs are created from first returns and DEMs from bare earth / classified ground (Figure 3) enabling the creation of a normalized DSM (NDSM) using the difference between DSM and DEM (Figure 4). The NDSM shows absolute feature height. With the data preparation phase complete, integrative techniques are applied for analysis and sensemaking (Figure 5).
In the next step, simulated impacts of an explosion from the HIMV were modelled using buffers of 500 m and 700 m radius around a terminal berthing point (Figure 6). This shows that an explosion at the plotted location would damage buildings, cranes, storage tanks and containers in the port. Toxic air resulting from an explosion could spread across a larger area, depending on weather conditions. Extracted buildings are shown in black.
To date, students have also completed several other lidar-centric projects. For instance, capstone student Colin Johnson focused on 3D volumetric change detection utilizing lidar point clouds. We continue this work, including object-based image analysis, automated feature extraction, and multi-source inputs, advancing toward a neural network, thus facilitating deep learning and detection outputs. More information can be found at https://prezi.com/view/YNVXqZRMz8hDZ6uBAMXD/. Another project includes applications of freely available lidar for Connecticut to extract man-made objects from a primarily forested area and support existing PhoDAR data-collection strategies. Further discussion can be found at https://arcg.is/19emSS.
Endnote
Applications of lidar are ubiquitous and metadisciplinary, driving our curriculum approaches. At Northeastern, we strive to meet workplace needs using an experiential curriculum that bridges introductory to advanced concepts and provides end-to-end education. The goal is to prepare students proactively and thoughtfully for evolving technology and associated challenges. We adopt a generic, thus multidisciplinary approach to problem-solving by combining computer science and analytical skills with functional expertise, creativity, and leadership.
1 More information is available at http://northeastern.edu/siliconvalley/.
2 These are part of a Master of Professional Studies in Geospatial Services program: see https://cps.northeastern.edu/academics/program/master-professional-studies-geospatial-services-online.
3 The current version can be accessed at https://usgif.org/system/uploads/3858/original/EBK.pdf. The document is under revision.
Cordula Robinson joined Northeastern University in 2007 and is a Full Teaching Professor in the College of Professional Studies. She obtained her BSc from Durham University in geology and PhD from University College London in physics and astronomy, then worked as a postdoc at the Harvard-Smithsonian Center for Astrophysics and had an Asteroid, “2942 Cordie”, named after her. She continued as a junior scientist at Deutsches Zentrum für Luft- und Raumfahrt (DLR), working on the 2006 mission to Mars. At the end of 2006, she took up a position as a research associate professor at the Center for Remote Sensing at Boston University. She has published widely on a variety of topics in geography, geology and astronomy and has extensive experience in the use of lidar and SAR.