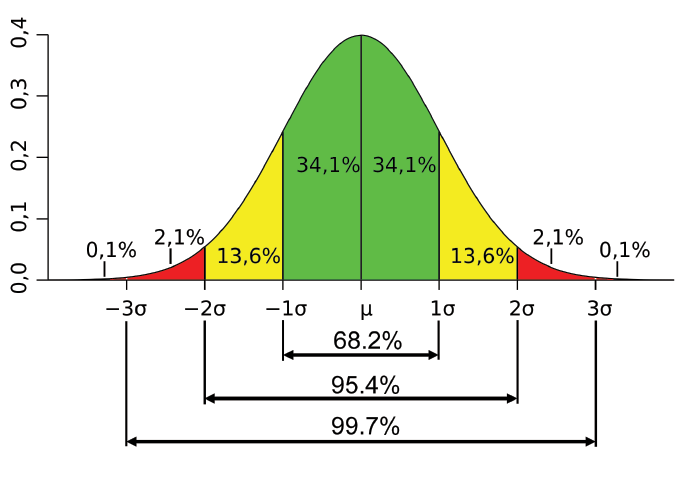
Figure 1: The Normal Distribution
For years our company has provided software, consulting services, training and just about everything associated with lidar except the actual hardware. Of course, our staff has a lot of hands-on experience with lidar systems but we’ve not had the pleasure of owning one. Now, on the drone side of our business, we are selling and supporting lidar units. This has caused me to take another detailed look at specifications and what they truly mean.
While the column this month focuses on drone lidar systems, the observations are applicable to all geospatial laser scanning systems. I am not going to give a list of specifications and what they mean (that would be a substantial, full-length article) but rather will delve into a couple of specifications that may trip you up.
The first one (and my pet peeve) is “accuracy.” This specification appears on nearly every integrated system specification sheet, but what does it mean? First of all, we assume that the spec writer really meant “network accuracy” (what is often erroneously called “absolute accuracy”). As has been discussed in previous Random Points, network accuracy is how “close” the data under question are to a reference geodetic network. We usually measure this by comparing our collected data to some collection of “check points.” These check points are, in turn, tied to a geodetic network either via traditional surveying or via a GNSS technique such as RTK. We don’t have to, but we usually express this accuracy as a root mean square error (RMSE).
If you make a list of all the factors that can affect the network accuracy of a kinematic laser scanner, it gets pretty long. It includes extrinsic (that is, external to the sensor system) items such as satellite coverage, atmospheric conditions, flying height,…—the list goes on and on. Then there are myriad intrinsic factors to consider. I maintain that a vendor could parameterize the intrinsic factors but cannot say much at all about the others. To me, this makes the figure of merit they call “accuracy” useless. The only way you are going to get a handle on true, achievable network accuracy is to go fly a few test projects in your typical operating environment. What I wish vendors would provide (and I have never seen an example of this) is something I would call “intrinsic network accuracy.” This INA, if you will, would say what the achievable accuracy would be if the external parameters were perfect. You could then stack typical external factors on this (well, maybe add them in quadrature if they are independent factors) to get an idea of achievable system network accuracy. As I write this, I am looking at the spec sheet of a $150K system. It has a line item specifying “accuracy” as a certain number of millimeters. It does not even say if this is horizontal, vertical, combined? This is useless!
A second issue that bugs me is that precision (noise) is specified in terms of 1 standard deviation (1 “sigma”). Recall what precision means for a laser scanner. If I lock my scanner into a stationary position and repeatedly measure a location in object space that is not changing at all (imagine putting the scanner in a vise and repeatedly measuring the distance to a static wall), then precision is talking about the spread in the range data. For a perfect system, we expect no spread at all. In reality, it will have a spread due to various stochastic errors. If we take a large number of measurements, this spread will have a Gaussian probability distribution (see Figure 1).
When we observe a lidar point cloud, all points are visible! This means that points that fall 3 sigma from the mean are quite visible. But worse yet, they manifest as noise points in automated algorithms such as ground classification. In fact, if you use the standard Model Key Points (MKP) algorithm for data thinning, you might realize that you are collecting the outlier noise points!
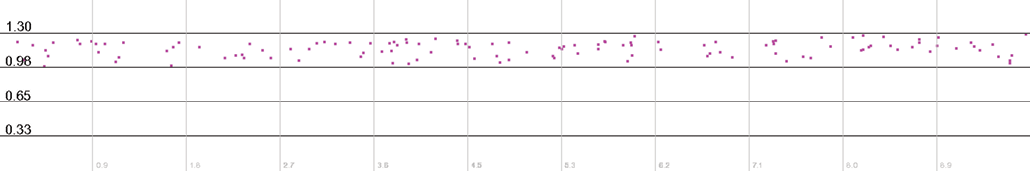
Figure 2: Hard surface range for a low precision lidar
I think we would all prefer to see the precision of a laser scanner expressed as peak-to-peak or at least 3 sigma. The observable peak-to-peak noise in a laser scanner is at least 6 sigma in width. This is 3 sigma above the true surface and 3 sigma below (so the 99.7% band). This means that if you have a precision specification of 3 cm, you will observe at least 18 cm of peak to peak noise. That is quite a lot! Figure 2 illustrates a profile of points along a horizontal, smooth concrete pad. These data are from a recent test flight we performed with a calibrated lidar system that employs a Velodyne VLP-16 laser scanner. I have filtered the data to a single return so that flight-line mismatch is not distorting the analysis. Using a planar surface analysis tool in our LP360 point cloud software, I measured the standard deviation as 6.9 cm and the range (peak to peak excursions) as 31.7 cm. I think you can appreciate from examining Figure 2 (the vertical units are meters) that the peak to peak excursions will be more impactful on classification than will the 1 sigma specification.
So what is the bottom line to all of this rambling? It is simply to be careful when using published specifications alone to evaluate a lidar system. No one is trying to be devious; specifications such as 1 standard deviation rather than peak to peak are probably due to historical precedence, not an attempt to obscure.