Figure 1: A “flat” water body
I am writing this from our summer camp on Lake Wheeler in northern Alabama. After a hard day of playing on the lake with all the kids, a bit of writing is a respite!
I am conducting a seminar on point cloud model constraints in a few weeks so I thought I would devote this column to some thoughts on the impact of high density data on constraint modeling.
Geometric model constraints are data that we inject into a point cloud to force some sort of geometric conformance that is not in the original point cloud data. In the GIS world, these constraints are commonly referred to as breaklines, a bit of a misnomer since constraints can take the form of points and polygons, in addition to polylines. One commonly recognized constraint is the shoreline of a static water body such as a pond. Still water must be level so every point of the shoreline must be at the same elevation relative to a gravitational model (geoidal heights). Such a constraint is often referred to as water body flattening. In Figure 1 is depicted a pond with the shoreline demarked by a polygonal breakline (blue), forcing the elevation to 875 feet. Notice that the dynamic contours (GeoCue’s LP360 is the modeling tool) are obeying the constraint of the flattening breakline.
Model constraints generally do not modify the point cloud itself. They modify the triangulated irregular network (TIN) rendering of the cloud by forcing new edges or vertices into the model. Derived products such as digital elevation models (DEM) or contours are generated under the influence of these constraints. The idea is that we are adding information to the model that is not present in the original point data. This is a fascinating approach because it is a way around the famous Nyquist sampling criteria that says we must sample at a rate twice the resolution of the finest detail we hope to model.
Often this auxiliary information that we inject into the model is inferential. An example is a flowing stream. We know streams flow downhill even though the point cloud data do not reveal this in many areas of the model due to noise, vegetation and other model interference. By adding a downstream constrained stream centerline (the “talweg”), we can force the correct hydro behavior on our model.
There are also situations where supplementary data being injected in the model are physically measured. An example is supplementing dense image matching data (from drone mapping operations) in vegetated areas. RTK survey points from a “pogo” survey of the ground can be injected into the point cloud model as mass points. For projects that are mostly clear of vegetation, this can be a more economical approach of modeling small obscured areas than LIDAR mapping.

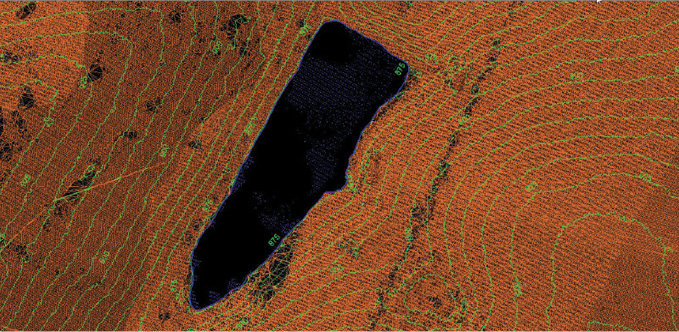
Figure 2: A downstream constraint (purple line) in dense data
The very dense data from drone-based low precision laser scanners (those with precision on the order of 5 cm, at one sigma) and structure from motion (SfM) point clouds must be treated in special ways when adding breaklines to models. The peak to peak excursions of data with a 5 cm (1 sigma) precision will be about 30 cm. Draping a stream centerline over a TIN modeled on these data will be far too noisy to model a downstream constraint. The standard practice with point cloud data is to omit points rather than manipulate the geometry of the points. Thus your modeling software will need to be capable of operations such as “use mean Z” or “use median Z” when working with these type data. A second consideration is the high data density. Adding a constraint edge into the TIN will not have much of an effect if the triangles are small relative to the feature that you are trying to model. One way to overcome this problem is to suppress points near the breakline from being included in the TIN model. This approach is depicted in Figure 2. Here we have created a point buffer around the downstream breakline (purple line) by moving unclassified points to an unused class. This class (magenta points) as well as low noise points (purple points) are being withheld from the TIN (faint orange lines). If this constrained model were used to generate an exported DEM, the elevation posts would faithfully obey our desired downstream model.
This is just a very basic introduction to the concept of breaklines. If you are generating derivative products from point cloud data, you will need tools that can both create and enforce the variety of constraints needed for your particular situation. You can read much more about breaklines in our GeoCue knowledge base.
Till next time, stay between the lines!