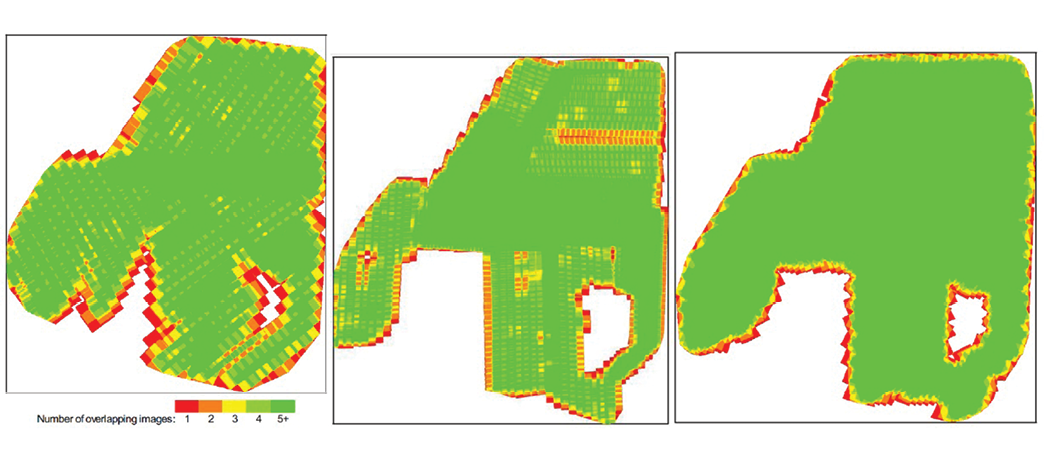
Figure 1: Comparison of the data coverage of the Inspire 2 (VTOL) high altitude, Inspire 2 (VTOL) low altitude and Altavian (Fixed wing) high altitude data collections. From a coverage perspective, green signifies “enough” while yellow is less than adequate and red is limited to none.
In the first part of this paper, the various methods of creating point clouds from laser scanners and cameras were discussed. Additionally we explored the characteristics of point clouds by contrasting the differences between the photogrammetrically- and lidar-derived point clouds. In this article, we will evaluate the characteristics of the lidar and photogrammetric point clouds captured from different sensors/platforms: conventional lidar on a manned aircraft, UAS lidar and UAS camera. In order to conduct a comprehensive comparison, this study uses data collected at the same site. Qualitative and quantitative assessments have been applied to evaluate lidar and photogrammetric point clouds in terms of point density, data voids, visualization and completeness of the data. The accuracy comparison has been performed using a well-established control point layout consisting of control points and check points. The accuracy analysis is not covered in this paper. The study area is a 300 acre site in the Midwest.
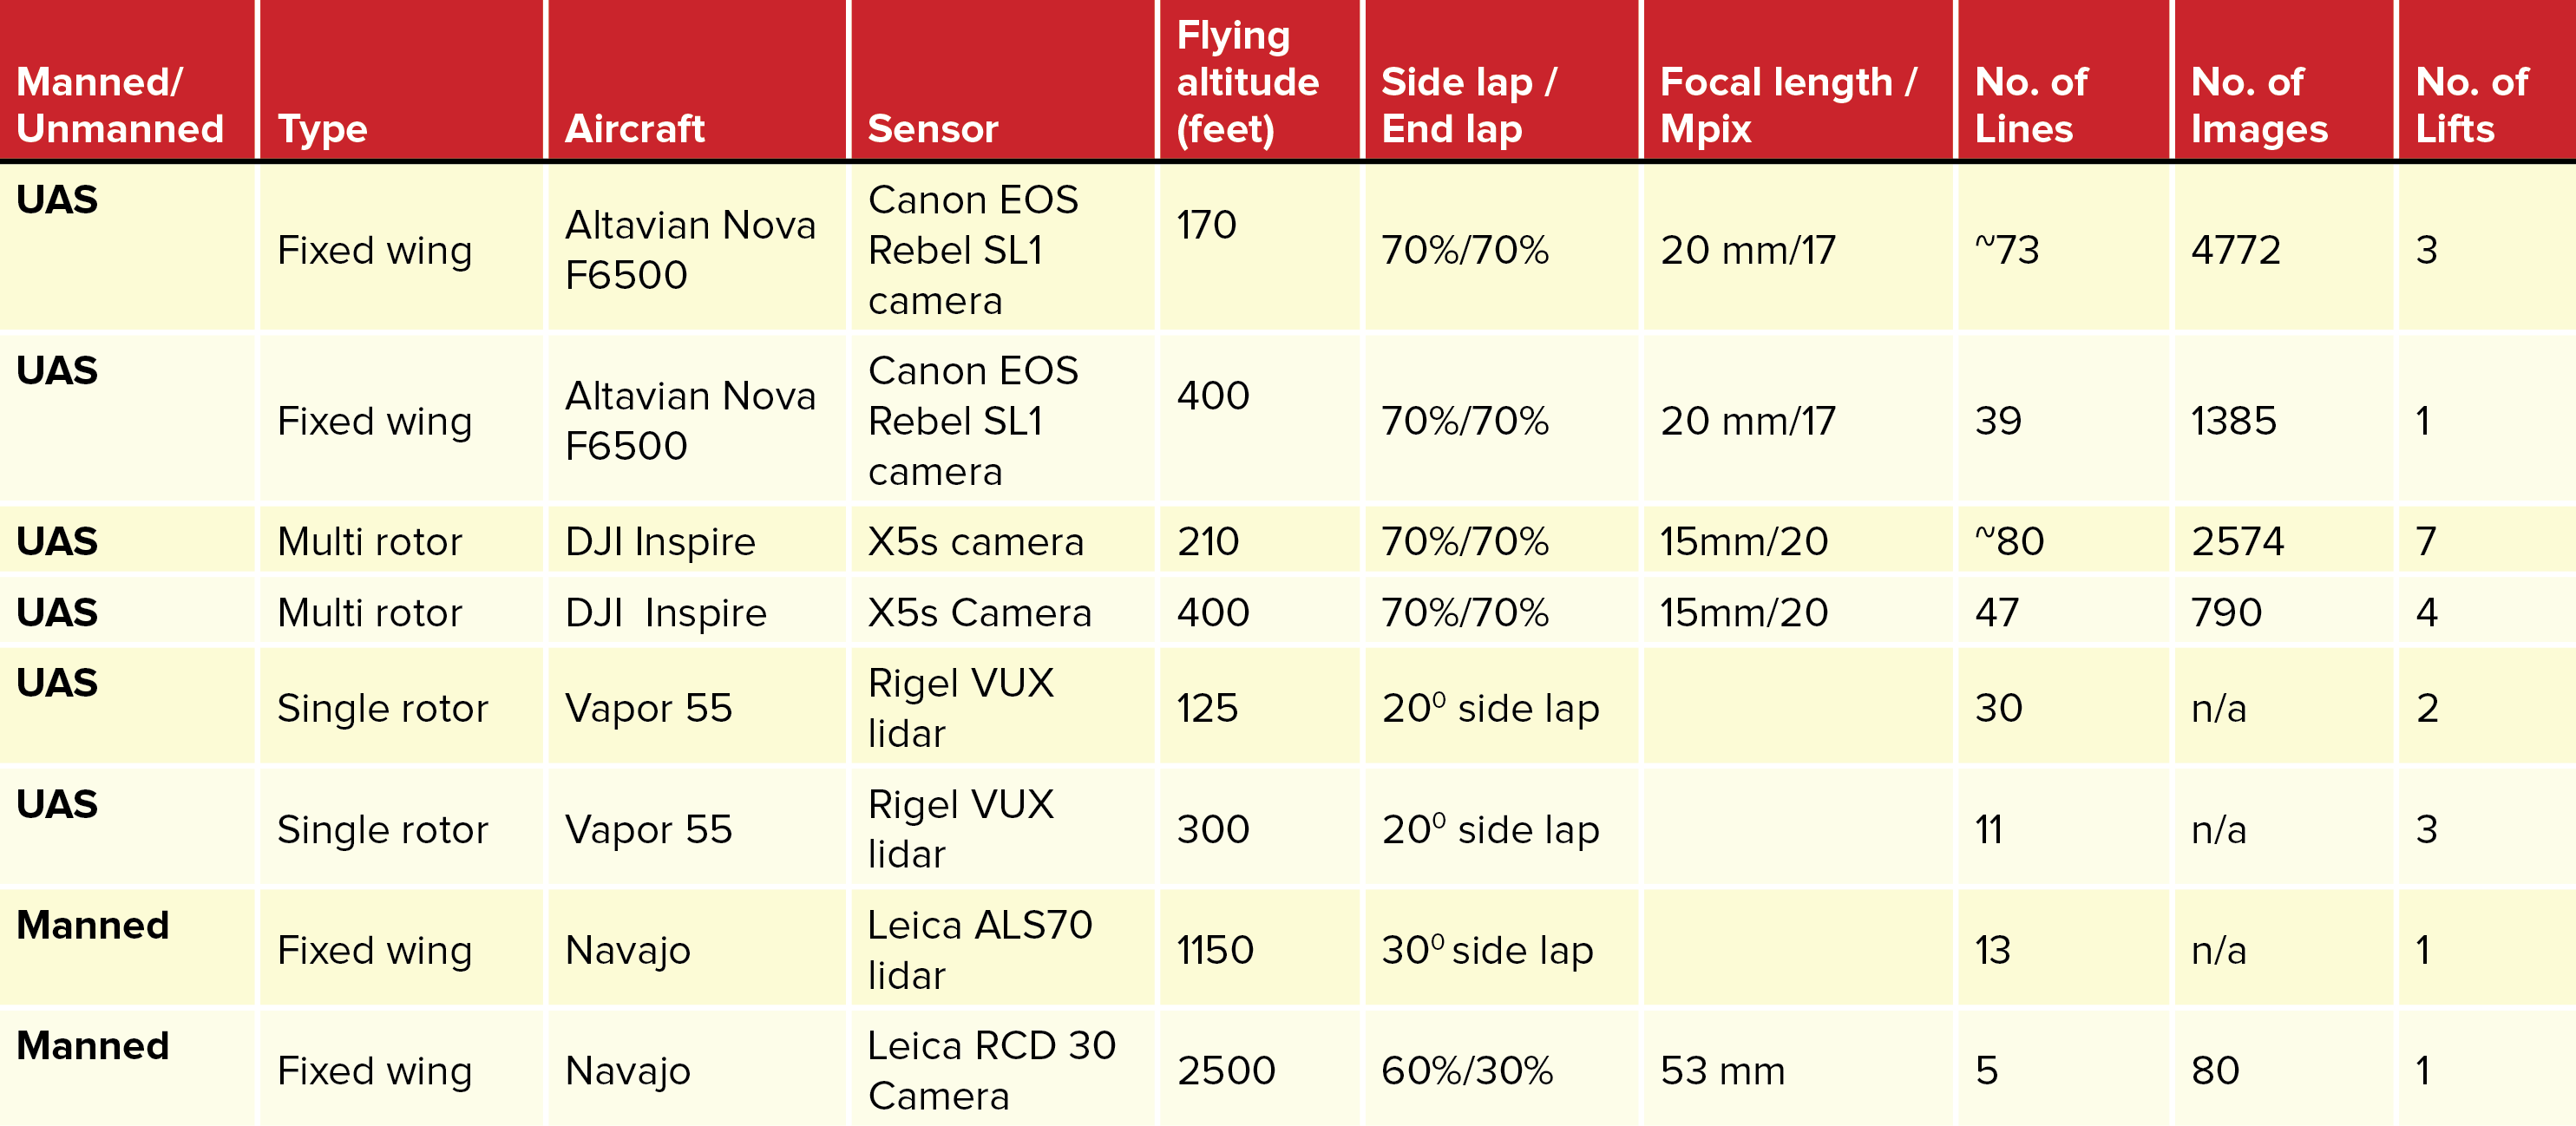
Table 1: Aircraft and sensors used in the project along with the flight lines and number of images
Data sets collected and compared
Table 1 provides information on the sensors, aircraft and data collection parameters used in this study.
Ground control
As part of data processing, a set of 25 control points was established and approximately 75 photo-identifiable check points were also surveyed.
Data processing
The data processing of images collected using Altavian and Inspire systems was performed using the Pix4D software. The Altavian Nova’s integrated GPS was post-processed to improve positioning of each frame. All imagery was then run through a Pix4D workflow to produce DEMs and orthophotography. The DJI Inspire 2’s integrated GPS data was not post-processed. All the Inspire 2 imagery was run through the same Pix4D workflow to produce DEMs and orthophotography. The lidar data collected from fixed wing and UAS was processed using a multitude of software packages including Geocue andTerrasolid. All the datasets were processed using a similar number of control points. Grids with 0.2 ft resolution were generated. The Z value comparison was made on all the grids.
Comparison of different data
The resultant point clouds from each sensor / platform were compared with respect to number of points, point density, point spacing, and data voids. Visual analysis was also performed to compare the different datasets.
Point density comparison
Point density is related to point spacing and logically the closer points are to one another, the higher the point density and vice versa. The point density is normally calculated from the actual data using the “box counting” method, whereby an area of a rectangle is associated with the total number of lidar points inside the rectangle. In the case of lidar scanners, point density is a function of flying altitude, pulse rate, scan rate, and scan angle. Point distributions are rarely regularly or evenly spaced. As a rule of thumb, the more points that are reflected from a target, the better we define that target. Point spacing refers to one-dimensional measurement or a point-to-point distance. The point spacing varies depending on the application and type of deliverables. Point spacing also determines the necessity for the delineation of linear features, such as breaklines, as a supplemental deliverable.
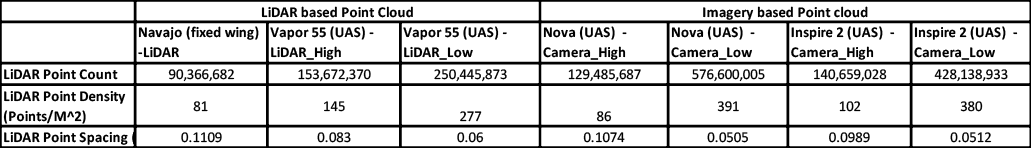
Table 2: Point cloud characteristics from different platforms/sensors/altitudes
The point density of the photogrammetric point cloud is comparable to the point density of the lidar point cloud (Table 2) and in some cases it is much higher. The point densities of the point clouds from the Altavian and Inspire at low altitude are 392 and 381 respectively, compared to 278 for the UAS lidar point cloud, and nearly 5 times denser than the fixed wing lidar flown at 1150 feet. The point spacing is also comparable to the lidar.
The LAS files created from different collections were processed for ground points only and a grid 0.2 ft has been created. The minimum and maximum elevation were also compared from the grids and are given in Table 3.
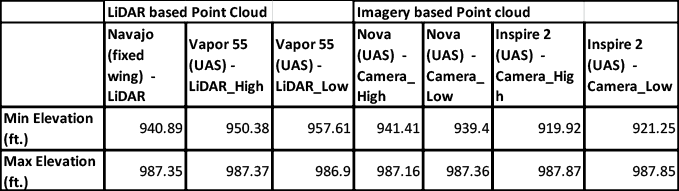
Table 3: Minimum and maximum elevation comparison of the grids created from different point clouds.
The Z values are consistent except for Inspire 2. During the data collection using Inspire, there were some issues that caused inconsistent elevation values. These effects are discussed below.
Completeness and data void
A data void can occur in lidar data for a number of reasons including water absorption. Lidar data voids may be natural (e.g., water bodies or fresh asphalt that absorbs the laser energy), unintentional (e.g., high winds or navigation errors that cause gaps between flight lines), or intentional (e.g., from post-processing for deliberate removal of manmade structures and/or dense vegetation not penetrated by the lidar). The uniformity of the point density throughout the dataset is important.
Likewise, data voids in point clouds created by photogrammetry may occur for the following reasons: issues related to data collection and processing; terrain conditions, including tree cover and surface texture.
With respect to data collection, the following parameters play a role in getting a consistent and accurate photogrammetric point cloud: overlap; motion blur; rolling shutter effects; ground sample distance (GSD).
Terrain conditions, including tree cover and surface texture, are very significant. Vegetation (e.g., trees, crops) cover has an important impact on photogrammetric point clouds as explained in the first part of the article. The texture of the surface from which points are derived has a big impact on whether voids are created. For example, large rooftops with smooth texture are likely to produce a data void in the resulting point cloud. Wind causes vegetation canopies to move during image acquisition, which causes positional and spectral (reflectance) changes in these features between images, and often result in data voids.
Data Processing related
One of the most important issues related to data processing is key point matches, which affect the generation of consistent point clouds from imagery using SfM. The image contrast and quality significantly affect keypoint matches.
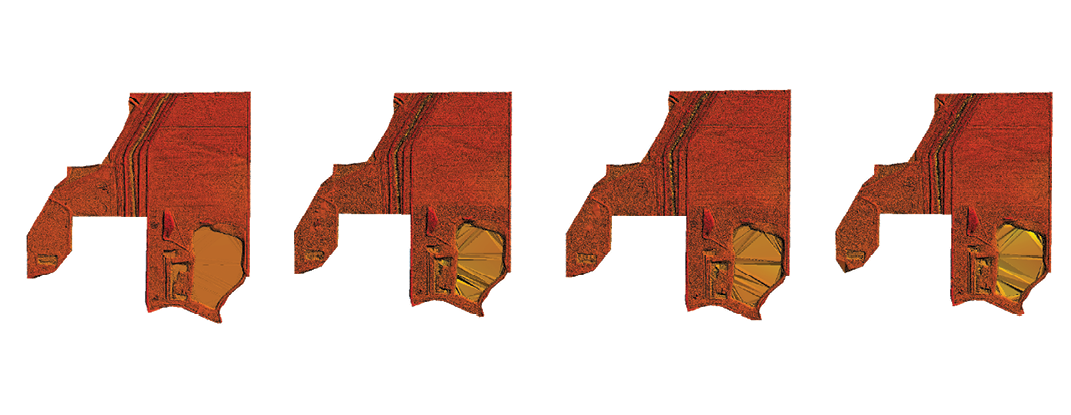
Figure 2: Grids generated from the ground points of the LAS files from 7 different collections. Derivative products like elevation grids and (subsequently) contours can be created from both the point clouds.
The data collected using the DJI Inspire 2 illustrates well several data collection and data processing problems that have measurable effects on the quality of the resultant photogrammetric point cloud. During the data collection, a number of factors contributed to inadequate overlap of approximately 5 photos. These gaps in coverage then caused difficulty in triangulating those photos and adjacent photos. The complete coverage using 400’ & 200’ AGL Inspire 2, and the 400’ AGL fixed-wing is shown in Figure 1. The “green” indicates enough coverage, “yellow” indicates less than the adequate number of images and “red “indicates practically no or very small number of images. The UAS fixed wing coverage is complete as can be seen from the “green wash” and yielded a consistent point cloud.
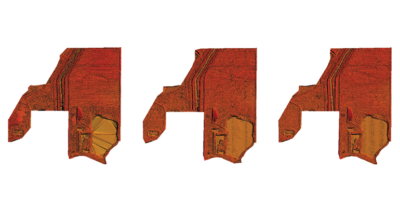 The grids created from all the seven different point cloud from imagery and lidar sensor are shown
in Figure 2.
Conclusion
UAS data processing software products that use either semi-global matching (SGM) or SfM methods to generate point clouds have given rebirth to photogrammetry. UAS-based data collection and processing has become another tool for professionals practicing geomatics. Whenprofessionals understand the important distinctions of each technology, they will be better able to apply the right tool to the right project for optimum results. 
References
Dharmapuri, S. (2013, June 20). Validation of Data Density and Data Void of Aerial LiDARidar Data. Retrieved July 25, 2018, from http://www.localhost:10018/content/view/9814/.
Harwin, S., & Lucieer, A. (2012). Assessing the Accuracy of Georeferenced Point Clouds Produced via Multi-View Stereopsis from Unmanned Aerial Vehicle (UAV) Imagery. Remote Sensing, 4(6), 1573-1599. doi:10.3390/rs4061573
http://bit.ly/2QS2twe.
Schwind, M. (2014). Comparing and characterizing three-dimensional point clouds derived by structure from motion photogrammetry (Unpublished master’s thesis). Texas A&M University Corpus Christi, Corpus Christi, TX.
Tully, M. (2015). Semi global mapping. Tully, M. (2016, January 30). Just How Accurate is Your Drone? – Aerial Services, Inc. (ASI). Retrieved July 25, 2018, from http://aerialservicesinc.com/just-how-accurate-is-your-drone/.
Widyaningrum, E., & Gorte, B. (2017). Comprehensive comparison of two image-based point clouds from aerial photos with airborne LiDAR for large-scale mapping: Door detection to envelope reconstruction. In The International Archives of the Photogrammetry, Remote Sensing and Spatial Information Sciences. (Vol. XLII-2/W7, pp. 557-565). [ISPRS ICWG III/IVb] ISPRS. DOI: 10.5194/isprs-archives-XLII-2-W7-557-2017].