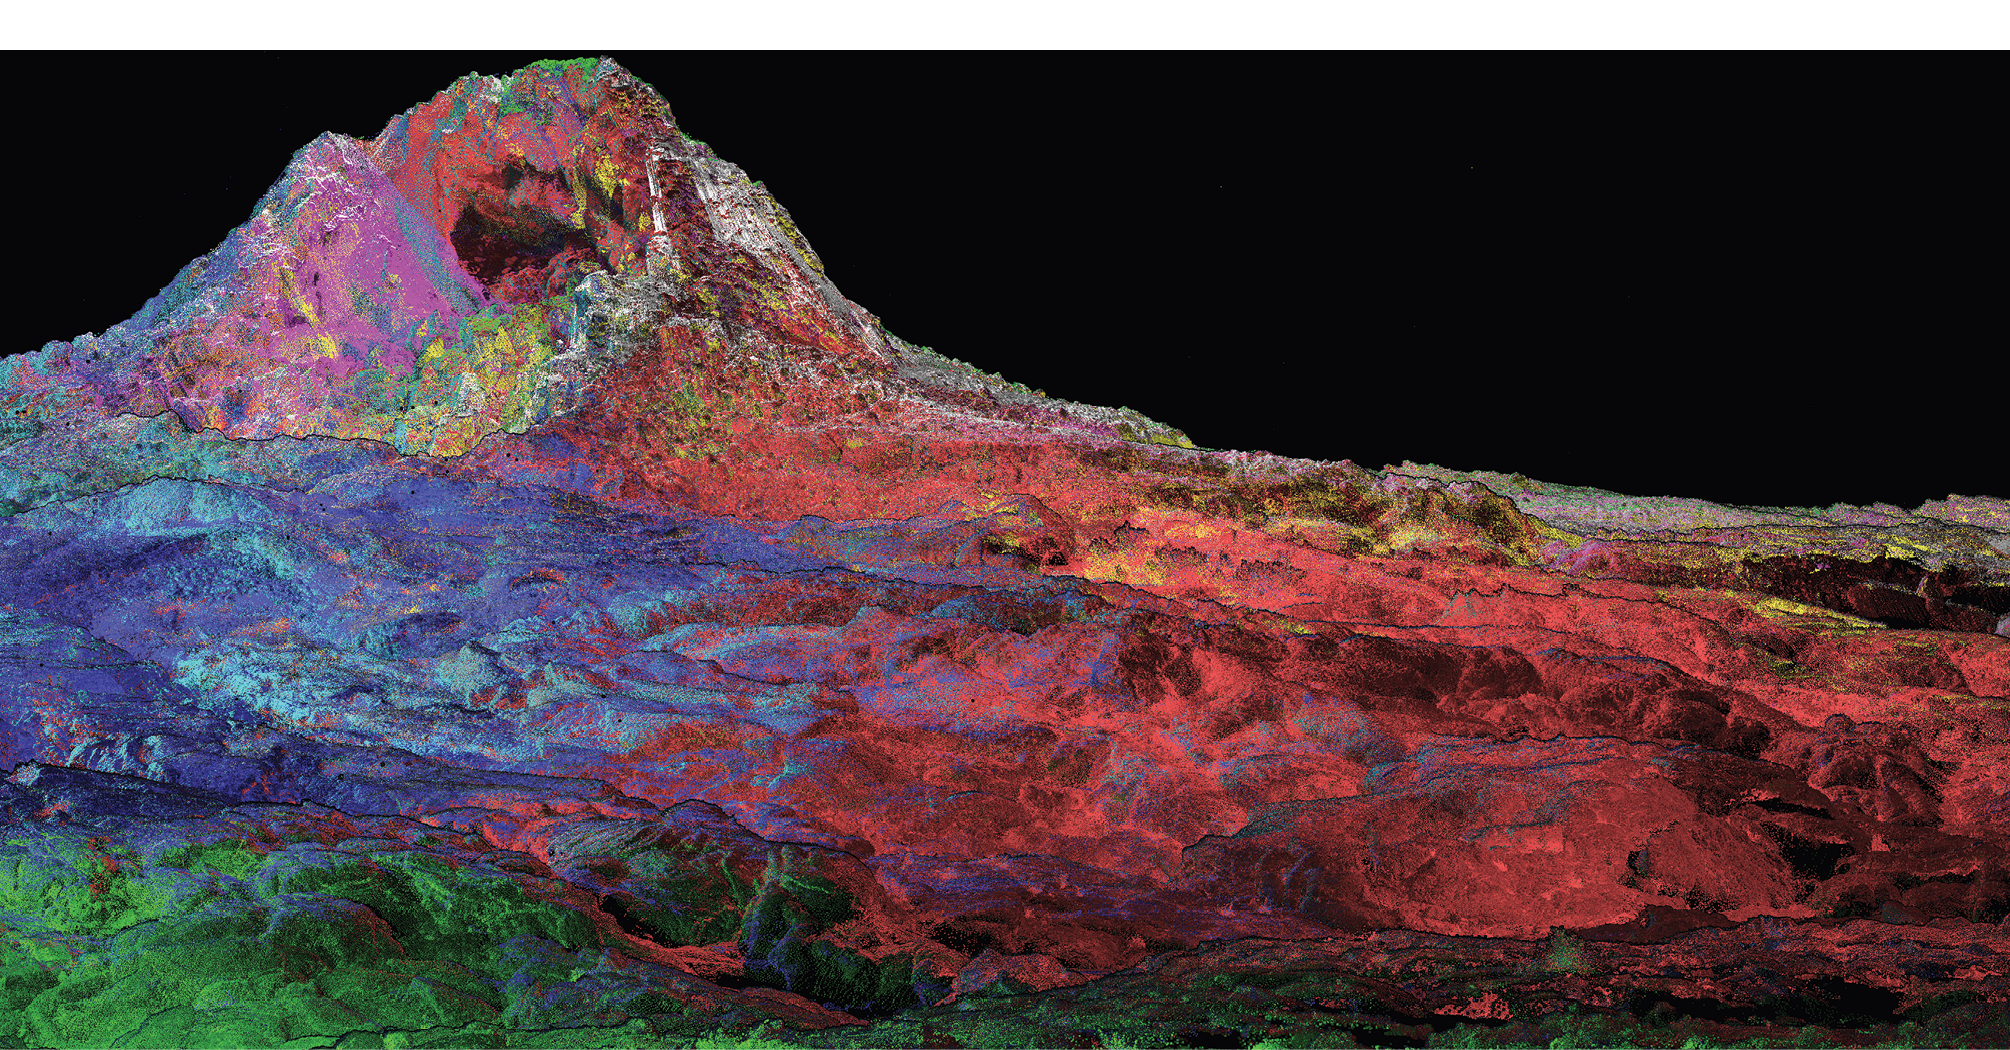
An isolated spatter cone, about 4 m (13 ft) tall, rises above surrounding lava flows, some of which emanate from the central vent. This point cloud was captured by the Akhka R3 KLS backpack mobile lidar system, and is color coded by each minute of data collection. (Kukko, FGI, 2018)
Early explorers set off into the jungle, or the desert, or some exotic land with the intent to learn as much as they could and share that information upon their return. If the place was interesting enough, or offered some resource of value, these early accounts provided the framework for future exploration and eventual settlement. The idea of returning to that place was likely never too far off in the mind of the explorer, because it was relatively feasible to return and explore further.
Editor’s note: A PDF of this article as it appeared in the magazine is available HERE.

Additional scans from our catalog of volcanic features including lava tubes and flows.
Now consider the task of exploring the surface other places in our Solar System, like the Moon, Mars, and beyond. The immense cost of the initial exploration is such that it makes it very unlikely that a chosen landing site will be re-visited, unless there is overwhelming cause for return. After all, with so much of an entire planet to visit, why go back to where you’ve already been?
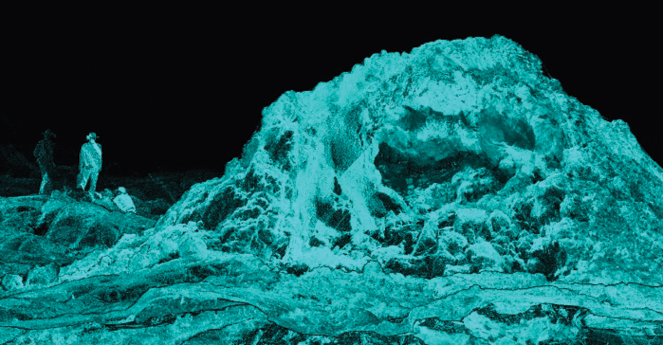
Field team members are gathered to the left of a small, isolated spatter cone in the far reaches of the lava field. Two hours of hiking were needed to access this site, but only ~15 minutes to capture it. KLS point cloud colored by intensity, Kukko, FGI, 2018
So the question for the folks like us who think about this kind of thing is: How do you maximize exploration and discovery? And, how do you do this with limitations on mobility, time, and cost? What is the strategic knowledge needed to answer the question of how to explore other planets?
The simple answer to these questions is to use comparable places on Earth to practice our exploration strategies. A previous issue of this magazine discussed how we use lidar at comparative planetary analog sites in the high arctic to understand climate change and the geomorphology of Mars. In this piece, we discuss how tripod (TLS) and mobile (KLS) lidar instruments were used as part of NASA’s Solar System Exploration Research Virtual Institute (SSERVI) Field Investigations to Enable Solar System Science and Exploration (FINESSE) program. The FINESSE program is a consortium of more than 30 research scientists, professors, and students whose goal is to generate strategic knowledge in preparation for the human and robotic exploration of the Moon, near-Earth asteroids (NEAs) and and the Martian moons Phobos and Deimos. To accomplish this, over the last 5 years FINESSE scientists have explored the Craters of the Moon National Monument and Preserve (CRMO) with the objective of determining the ideal suite of instruments, observation and sampling strategies needed to maximize scientific exploration.
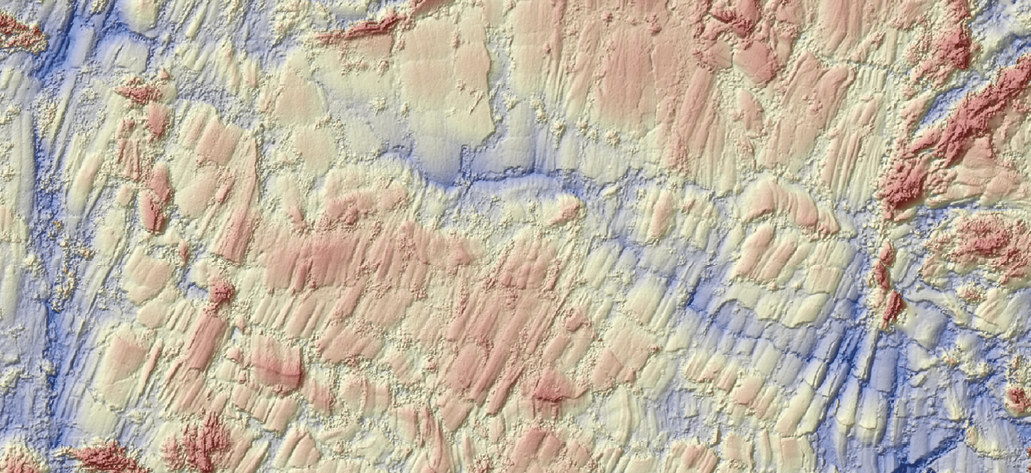
The KLS mobile lidar system provides ultra-high resolution (~1 cm/pixel), enough to discern “rifts” and “micro-plates” formed on the surface of the lava as it oozed and flowed. Image is 35 m (115 ft) wide, with total vertical relief of ~50 cm (1.6 ft).
Associated with the main project goals, those of us interested in lidar surveying want to show how different lidar instruments and surveying techniques can, and should, be considered as integral tools in the future exploration of planets. Our work shows that lidar data delivers maps for navigation, topography and morphology, and terrain roughness, as well as provides important context for other scientific investigations.
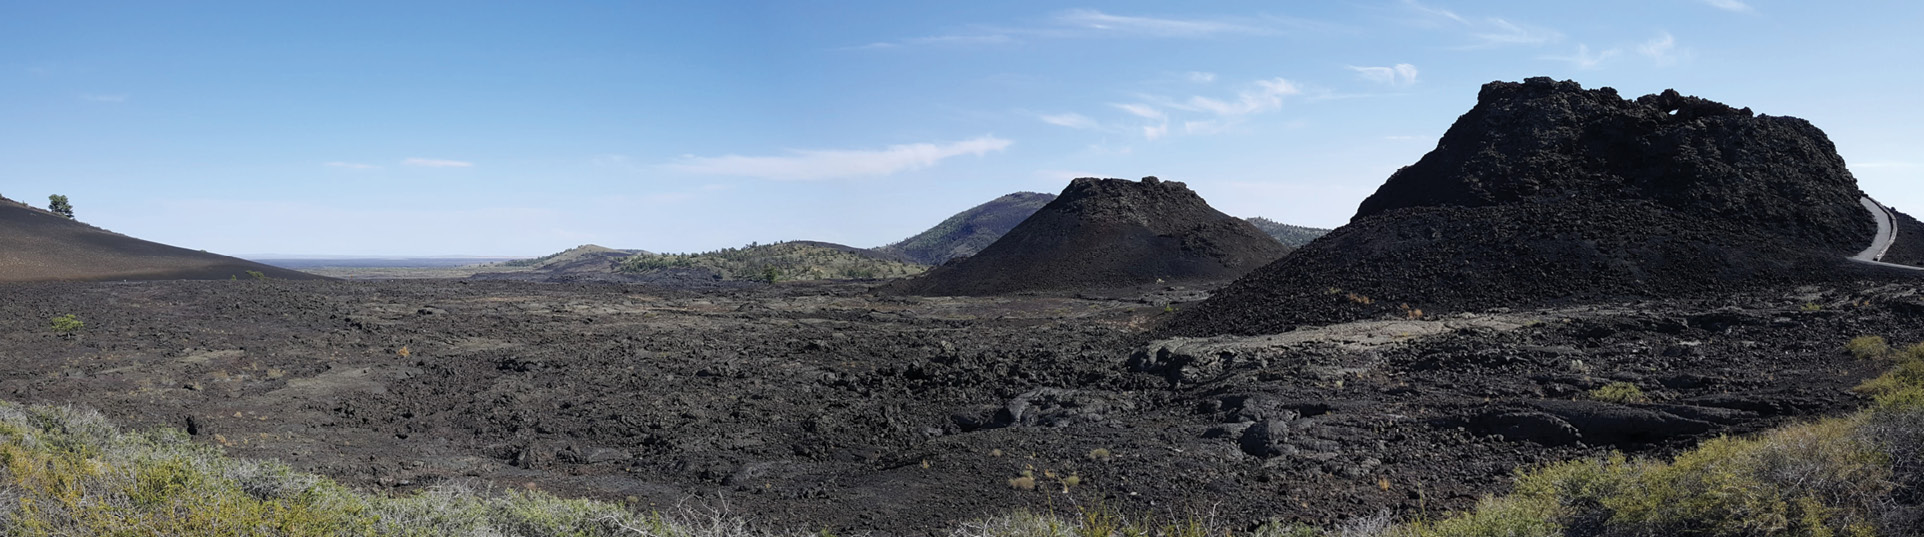
A panoramic view of an area of spatter cones in Craters of the Moon National Monument, Idaho. These mini-volcanoes rise 20 m (65 ft) or more above the expansive lava flows within the park. Zanetti
“A mass of ‘Black Vomit’”
Craters of the Moon National Monument and Preserve is an enormous region (~1900 km2, ~720 mi2) of the Snake River Plain in southern Idaho. The park features some of the best preserved and youngest basaltic lava flows (as recently as ~2000 years ago) in the continental United States. The park is dominated by extensive lava flows, most emanating from a series of fissures and rifts related to basin-and-range tectonics after the North American plate migrated southwestward over the mantle hotspot that now exists under Yellowstone National Park. During the first mapping expedition of the area in the 1830’s, Capt. Benjamin Bonneville described it as “a desolate and awful waste; where no grass grows nor water runs, and where nothing is to be seen but lava”. In the 1860’s, when settlers in wagon trains skirted along its margins while travelling Goodale’s Cutoff of the Oregon Trail, Julius Merrill described the area as “a mass of ‘black vomit’.” Superficially, these descriptions are correct, but fail to capture the eerie beauty and catastrophic violence the area has undergone. Individual lava flows shimmer in iridescent blues and greens, due to oxidation of trace titanium and magnetite. The lava fields glisten in the heat, and the attractiveness of the terrain changes depending on the dehydration level of the observer. Huge cinder cones, formed by fire-fountain lavas typical of Hawai’i, rise above the Great Rift in the central part of the park. Overall, the National Monument shares many similarities to the ‘magnificent desolation’ that Buzz Aldrin described while walking on the Moon during Apollo 11. Indeed, the park was used by Apollo 14 astronauts for geologic training exercises in August, 1969 shortly after Buzz’s return from the Moon.
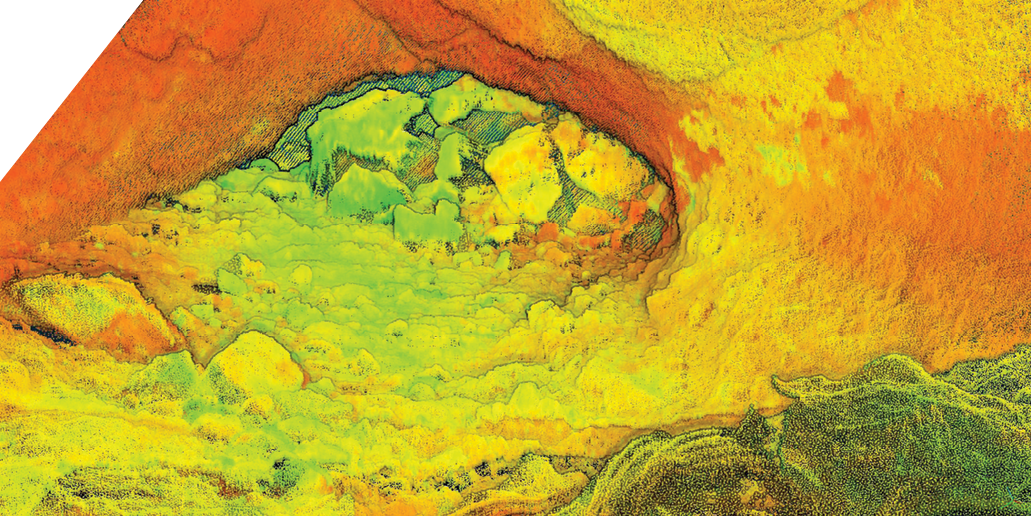
Oblique view looking into the mouth of the Indian Tunnel lava tube. This is point cloud data collected by the KLS and color coded by intensity. Kukko, FGI, 2018

Locations of TLS tripod sites taken to completely capture the extent of the Indian Tunnel. Surface scans are white dots, interior scans are black squares. B. Garry, NASA
Exploring with Lidar
The two main roles for lidar surveying in exploration are to provide high-accuracy topographic maps and to provide vital context for follow-on scientific measurements. As a stand-alone product, lidar point clouds and post-processed raster digital elevation models (DEMs) are essential for terrain mapping, understanding the morphology and morphometry of features, and quantifying the roughness of the terrain for hazard studies and understanding radar remote-sensing. Within the context of our lava flow investigations, lidar serves as an indispensable base map layer for overlays of visible, hyperspectral, and geophysical imagery and data. lidar provides precise and accurate spatial understanding of where samples came from, how they were oriented, and their geologic context. The TLS and KLS systems also proved indispensable for understanding geophysical data from gravity and magnetometer instruments (see sidebar). The ultra-high resolution DEMs from the KLS instrument have also provided a link between satellite and airborne remote-sensing data, allowing for an unprecedented level of accuracy in quantifying surface roughness for studies of radar backscatter properties. Both TLS and KLS systems have delivered exceptionally detailed views of the morphology of different volcanic features, such that we are now just beginning to understand how to use the data to its full potential.
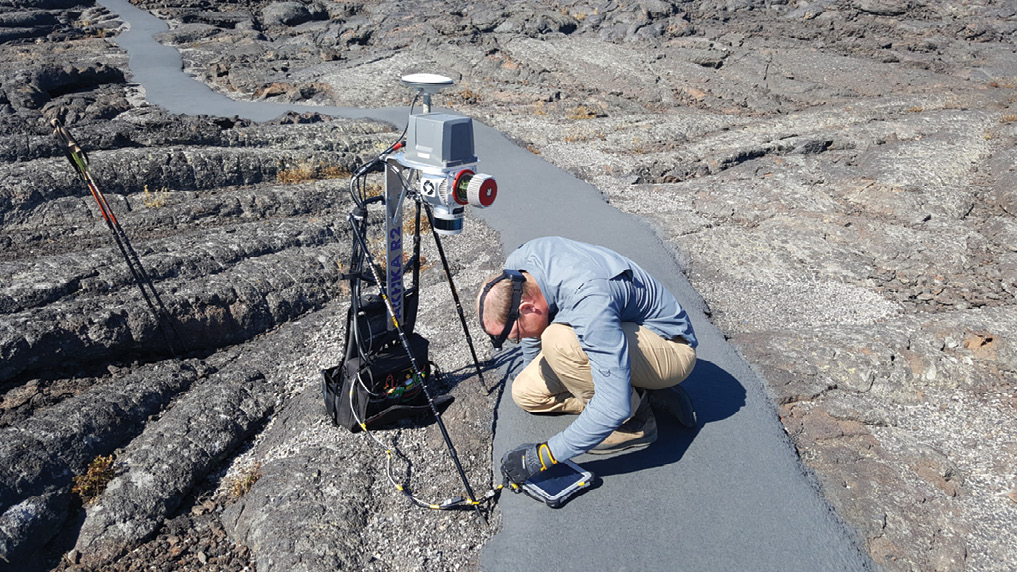
Antero Kukko collects static data for the IMU and GNSS on the Akhka R3 KLS backpack lidar before venturing into the lava tubes (note the headlamp).
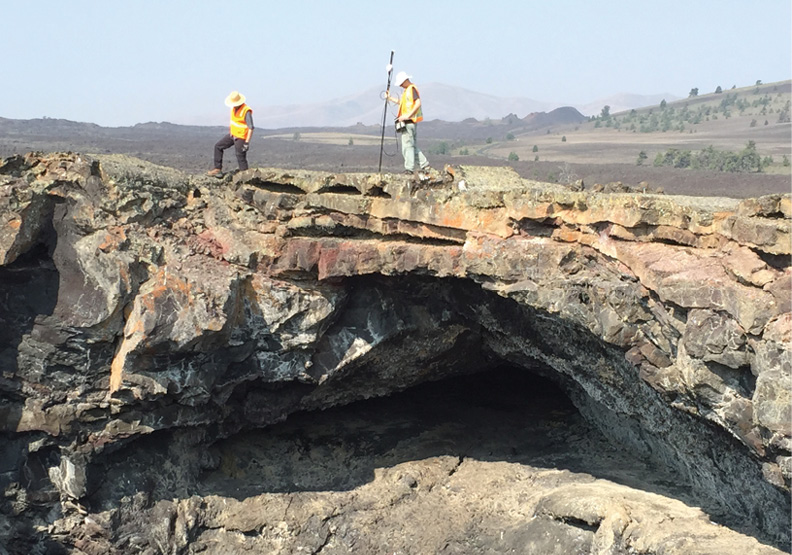
Chris Brown collects magnetometry data around one of the skylight openings of the Indian Tunnel. Lidar and geophysical data proved to be an exceptionally useful pairing. Brown
Technical specs of the Lidar
The lidar point clouds that were produced by our group were done using tripod-mounted TLS and kinematic mobile KLS scanning. The TLS system is a Riegl VZ-400 (RIEGL Laser Measurement Systems GmbH, Austria), mounted with a DSLR and Trimble R8 DGPS (Trimble Inc., USA). Point clouds were processed and matched in RiSCAN Pro 2.3. Our KLS system is the Akhka-R3 Kinematic lidar Scanner (KLS), a custom-made backpack-mounted mobile lidar scanner developed at the Finnish Geospatial Research Institute. The KLS uses a Riegl VUX-1HA profiling laser scanner coupled to a NovAtel UIMU-LCI inertial measurement unit and a Flexpak-6 GNSS receiver coupled with 703-GGG antenna (NovAtel Inc., Canada). Areas of interest were walked (or stumbled based on the terrain) and scanned at ~150 – 250 Hz profiling and 500 – 1000 kHz pulse repetition frequencies and maximum ranging from 150 m (1000kHz) to 300 m (500kHz). Precise point processing (PPP) methods using NovAtel’s Waypoint Inertial Explorer 8.6 and 5Hz DGPS data from a Trimble R10 GNSS base station were carried out to solve for the precise base station location with a ~1-2 km (~1 mile) baseline at each site. The base station data was then used for calculating the solution and 200Hz kinematic platform trajectories for point cloud generation. KLS field data was stored in 1 minute blocks and processed and matched using Riegl’s proprietary software and TerraSolid (TerraSolid Oy, Finland) products. The absolute lack of overhead vegetation at the site permitted full satellite coverage, with typically more than 17 GPS and GNSS satellites locked. Trajectories and inherited point cloud accuracy of the KLS scans were on the order of 1 – 2 cm. However, even this small amount of mismatch of the data was deemed detrimental to capturing very fine scale details of the lava surfaces. Therefore an additional matching steps were taken to remove as much of the discrepancies as possible. Given the millimeter-scale ranging precision and beam spot size of 0.5. mrad (25 mm at 50 m range) from the VUX-1HA and the tactical grade FOG IMU, the KLS has captured surface details at an extraordinary level, often better than 1 cm/pixel raster image resolution.
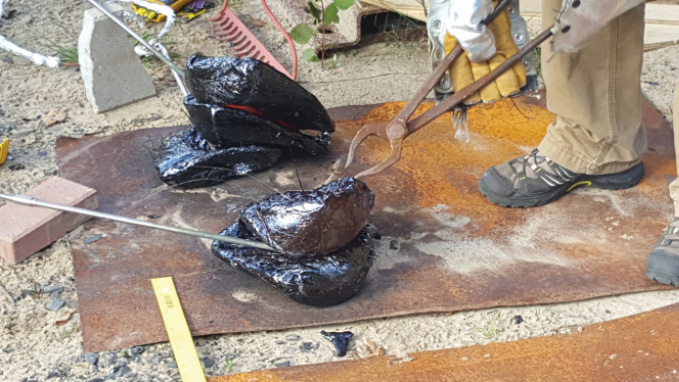
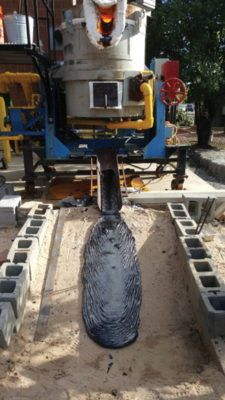
Experiments using 200 kgs of remelted basalt were done to simulate lava flow morphology and spatter cone development using a large furnace at Syracuse University (lavaproject.syr.edu). Zanetti
 TLS and KLS systems each serve different purposes. Our TLS system was best suited for areas of limited GPS coverage, and excelled in the subterranean mapping of lava tubes. However TLS scanning proved time consuming for surface scans, requiring multiple scans to minimize obstruction shadows. The KLS system was advantageous for rapidly covering large surface areas (acres within hours) while also minimizing shadows by easily maneuvering around objects. The trade-off with using a KLS system is a more complicated and error-prone processing protocol (dependent mostly on satellite coverage) compared with TLS data processing.
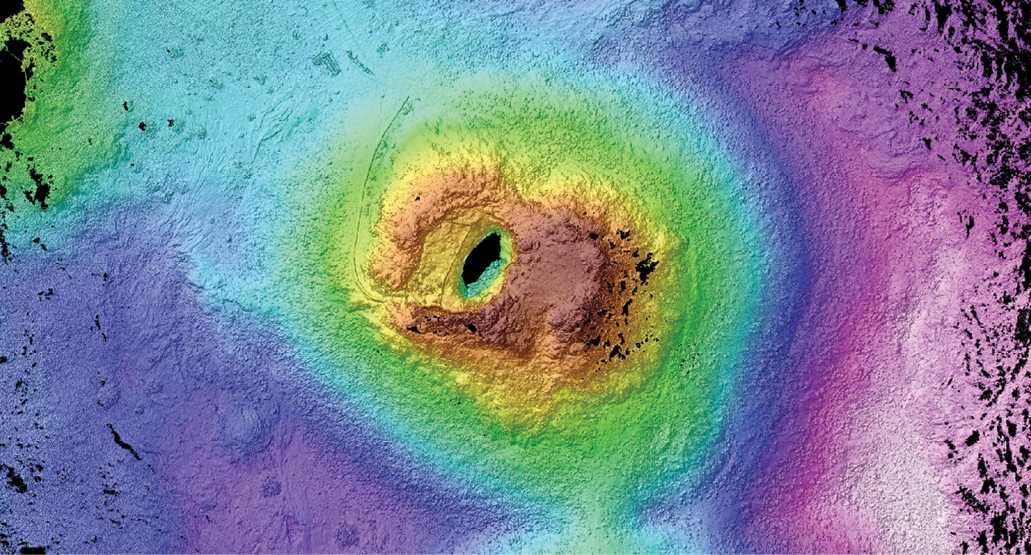
Map view of a DEM created using the KLS scanner of the tourist accessible spatter cone in the park (shown above). The 20 m high dome was created by innumerable “blobs” of lava that exploded from the central vent. A. Kukko and M. Zanetti
Lidar Scans of Volcanic Terrains
In addition to providing context for science investigations, we have begun cataloging the morphology of small-scale volcanic features in unprecedented detail. The data we show here is a small collection of the more than 10 acres scanned and 500 GB of data collected. Some of our scanning focused on mapping common hiking trails to support 3D visualizations for the park, while other features were scanned to understand the detailed geologic evolution of how lava flows are emplaced.
The lavas of Craters of the Moon are nearly all “pahoehoe” style, forming undulating and ropy masses as the lava oozes and flows across the surface. When flowing smoothly, the lava mimics water-rivers (albeit of molten rock) forming eddies, turbulent streams, and “lava-falls”. Sometimes the eruption style changes and becomes more prodigious, ripping off the sides of massive cinder cone volcanoes and rafting huge chucks of Earth miles away from their starting points. The results are massive slabs and rubble piles of once smoothly emplaced flows.
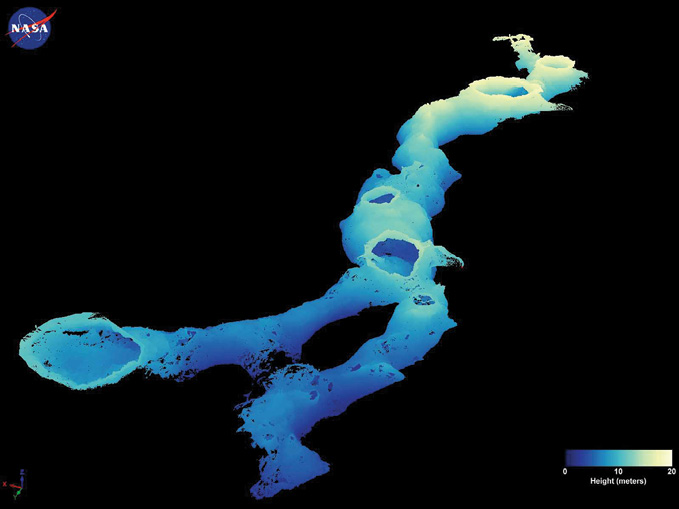
Subterranean map of the Indian Tunnel lava tube as mapped by TLS lidar. Approximately 1 billion points were collected at ~50 TLS sites covering the entirety of the 250 m long tube. B. Garry, NASA
A frequent feature within the endless lava-flows in the park landscape are spatter cones. Spatter cones are made by repeated explosions of ‘blobs’ of molten lava that weld together forming relatively small, steep-sided mounds around a central vent. FINESSE team members have spent significant effort trying to understand the temperature and chemical/geologic conditions necessary for lava to weld itself into huge mounds (contrary to expectation, small volumes of lava can rapidly quench to glass preventing welding). Collaborative experiments with the Syracuse University Lava Project have gone as far as ‘manufacturing’ lava blobs to determine how they stick together.
Surveying Lava Tubes
Within Craters of the Moon National Park there are a number of tubes large enough to walk through. The largest and most popular is the Indian Tunnel, a ~250 m (~820 ft) long lava tube cave that is up to 22 m (72 ft) wide and 12 m (40 ft) high. Lava tubes are the remnants of once molten lava rivers flowing through self-made tunnel systems, appearing similar to a city subway system. The top portion of the lava flowing in the channel can cool and solidify, leaving a roof over the still flowing lava stream. When the lava drains a cave remains, and many times the roof is stable enough to support subsequent lava flows over the top of the cave. Many times these cavernous conduits remain hidden from view, but can be found and accessed through collapse pits that expose the interior chambers. Indian Tunnel is accessible by a few of these pits, but primarily by a rudimentary concrete staircase that terminates on a pile of jagged rocks. The shape of the tunnel is generally domed with a flat floor, which represents the final geometry of the cave when the flowing lava finally solidified, but is strewn with large piles of boulders from the fallen roof material. Indian Tunnel was sampled multiple times for geologic composition and astrobiological and cave-microbe studies, as well as with geophysical measurements of local gravity and magnetic variations.
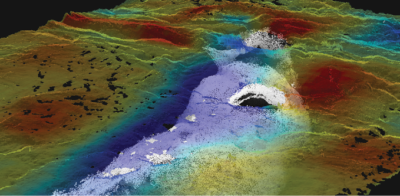
A portion of the combined surface and subsurface lidar data overlain by magnetometry data at the Indian Tunnel lava tube. A lower magnetic signature is seen over the tube demonstrating the effectiveness of geophysical methods for finding subsurface voids.
The FINESSE team was interested in Indian Tunnel because of its similarity to collapse pits (e.g. skylights) that have been observed on both the Moon and Mars. These extraterrestrial caves might prove to be effective bases for human surface operations because they offer relative shelter from harmful radiation and micro-meteorite bombardment, or as locations where extant life on Mars may be found (thus the microbial studies of cave-dwelling species adaptations). If deployed, a planetary lidar system could help investigate if there is an interior from the rim of the pit, determine accessibility, and image the interior in limited light conditions.
Lidar exploration of Indian Tunnel was done by our group using TLS tripod scans and with the KLS system. The TLS scans were done by W. B. Garry using a Reigl VZ-400 and consisted of 50 total scans (29 interior, 21 surface) to create a point cloud of ~1 billion points. TLS scanning of the tunnel was time consuming, requiring nearly 2 full weeks over 2 field seasons to satisfactorily complete. (Dr. Garry’s work as part of the FINESSE program was featured in 2017 on NationalGeographic.com).
Serendipitously, the roof collapse pits acted as skylights for GPS signals and are spaced at close enough intervals that the KLS system was also able to be used for subterranean mobile mapping testing. Using the KLS system we were able to map the entire accessible length of the tunnel in less than 20 minutes, and provide complementary coverage to the TLS surveying. Although successful as a test, mapping the cave system this quickly was treacherous with the top-heavy KLS, and post-processing the data was tedious because of GPS drop-out.
The Role of Lidar in Planetary Exploration
NASA FINESSE and other research teams are demonstrating that Lidar instrumentation should be incorporated in future landed surface robotic and human exploration of the Moon and Mars. Lidar provides ultra-high resolution mapping capabilities which are both accurate and precise. Lidar’s ability to actively sense the range to targets offers improvements over traditional photogrammetry techniques. Lidar offers the combination of navigation and science enhancement from a single instrument, which, from the perspective of payload limited spacecraft, offers a significant advantage. The potential virtual reality immersion from a robotic or astronaut traverse made using a seamless and accurate lidar surface representation would provide both scientific and public engagement windfalls. Still, challenges exist for the adoption of lidar in planetary exploration. Size, weight, and power limits for robotic missions severely limit the design and potential capabilities of compact lidars to operate and survive in the harsh planetary environments. Larger, pressurized rovers used by astronauts could handle a more powerful planetary lidar system. Cloud matching in GPS-free and natural-surface environments, even with SLAM and LOAM techniques, needs to be demonstrated to be accurate and reliable before lidar will usurp photogrammetry as the ‘topography-of-vogue’. Somewhat unique to planetary exploration, point-cloud data volumes could present a barrier. With new space-based laser communications, such as the Lunar Laser Communications Relay Demonstration on the NASA LADEE mission, downlink of nearly 20 Mbps has been achieved. This may solve the problem for lunar exploration, but high data rates will remain elusive for Mars for a long time to come. Regardless, there is both the interest in, and need for, lidar in planetary exploration.

125 highly sensitive gravity measurements were made in a 100 m x 25 m area over the Indian Tunnel tube. The open space of the lava tube resulted in a minute, but detectable, drop of 0.75 gals (or 0.00076g). Combined with magnetic data, such techniques can help subsurface exploration.
Sidebar:
Geophysics applied to Lava Tubes
Gravity and magnetic surveys are geophysical tools used to image the interior of the Earth. These tools are effective at mapping geologic environments we cannot see. Some applications include mineral exploration, oil & gas exploration, structural mapping, utility location and, in our case, cave/lava tube detection. During August 2017 gravity and magnetic surveys were conducted over Indian Tunnel lava tube at COTM by a team from Carleton University. The purpose of the surveys was to test the effectiveness of these methods for lava tube detection.
Gravity surveys measure relative changes in the local gravity field which is partially dependent on subsurface density—the less dense a geologic target is, the weaker the local gravity field should be. In terms of lava tube detection, the density contrast between the void tube and the solid host-rock creates a measurable contrast in the local gravity field. Gravimeters are very sensitive instruments, and great care must be taken when recording data. The gravimeter must be carefully set-up and levelled at each reading station. Due to the complex nature of the Earth’s gravity field, numerous corrections must be made to the data to separate the signal from the noise. Using high-resolution lidar data to make topographic corrections for the gravity data increases the reliability of the data.
Magnetic surveys map the subsurface distribution of magnetic minerals. Often this is caused by changes in the concentrations of iron in different types of rock. Interpretation of magnetic data collected on a planetary surface (the Moon during Apollo 14 and 16) or from satellites (Swarm, Mars Global Surveyor) allows scientists to make strong inferences about the composition and structure of a planetary bodies’ interior. In practice at Indian Tunnel lava tube the open void of the lava tube created a locally weak magnetic field relative to the surrounding, iron-rich basalts. To collect the magnetic data, we were able to walk over the terrain while recording data. This is much simpler than stopping and setting up the instrument for each reading for the gravity survey. As with the gravity survey, mapping of Indian Tunnel was successfully completed using a magnetometer.
The survey done at the Indian Tunnel lava tube accurately measured the both the contrast in the gravity field and magnetic signature between the lava tube and the host rock. The results from the survey allowed us to define the spatial extent of Indian Tunnel from the surface, with the implication that these methods could be used to determine if underground passages exist, and they could be of use for future surface exploration.
Dr. Michael Zanetti is a geologist and research scientist at NASA’s Marshall Space Flight Center in Huntsville, Alabama. He participated in the FINESSE program as a post-doctoral fellow at the University of Western Ontario with Drs. Catherine Neish and Gordon Osinski. He specializes in comparative planetary geomorphology of the Earth, Moon, and Mars, with focus on the integration of ground-based lidar with satellite remote-sensing data.
Prof Dr Antero Kukko is Head of the Mobile mapping and Autonomous Driving Research Group at the Finnish Geospatial Research Institute and adjunct professor in the Department of Built Environment, Aalto University, Finland. His research focuses on the development and application of mobile/kinematic laser scanning in geosciences and engineering.
Chris Brown is a geophysicist with over a decade of experience applying airborne, ground and borehole geophysical methods to assist in the detection and characterization of various types of mineral deposits all over the world.
Dr. W. Brent Garry is Geologist at NASA’s Goddard Space Flight Center in Greenbelt, Maryland, USA. He investigates volcanic terrains and lava flow emplacement processes on Earth for comparison with the Moon and Mars with a focus on geomorphology and geologic mapping.
Dr. Catherine Neish is an assistant professor of Earth Sciences at the University of Western Ontario in London, Ontario. She is an expert in the use of radar remote sensing for the understanding of the geologic evolution of the Earth and other planets. She is a collaborator on the FINESSE project, and led the Western field expeditions to COTM, with funding from the Canadian Space Agency.